More Related Content
What's hot
About the Interaction between water and Pb, Zn, Cu, Cd, Fe, Mn, Ba Mineralize...About the Interaction between water and Pb, Zn, Cu, Cd, Fe, Mn, Ba Mineralize...QUESTJOURNAL
Similar to Vinh et al Methanogenic Diversity Two Vegetation Types
Similar to Vinh et al Methanogenic Diversity Two Vegetation Types (20)
Vinh et al Methanogenic Diversity Two Vegetation Types
- 1. RESEARCH POSTER PRESENTATION DESIGN © 2012
www.PosterPresentations.com
• Microbial activity within freshwater wetland
sediments is the largest natural source of
atmospheric methane (CH4), an important
greenhouse gas (GHG)1.
• Wetland methane production is controlled
by watershed and wetland hydrology and
vegetation morphology and physiology.
• Urbanized wetlands can receive increased
water, nutrient, and organic matter loading
rates.
• How does the diversity of methanogenic
prokaryotes differ between sediments
underlying two vegetation types?
Rationale
Sediment gas fluxes:
- measured in situ with triplicate closed chambers2.
- Methane, carbon dioxide, and nitrous oxide determined
with a Bruker 450-GC GHG analyzer.
Methods
Study Site
Findings
GHG fluxes
• Methane contributed only 0.04% of total
gaseous C loss from sediments suggesting
high rates of methane oxidation (Fig. 2).
• Methane production was highest at the
Typha site (B) (Fig. 2), which also had
higher aboveground biomass, sediment C/N,
and porewater PO4
3- (Table 1).
• Methane fluxes as both sites were linearly
correlated with sediment temperature (not
shown).
Methanogenic diversity
• 159 mcrA sequences were classified into 19
species-level OTUs (cutoff value: 86%
sequence similarity; Figs. 3 & 4).
• Methanolobus and Methanosarcina genera
of the family Methanosarcinaceae made up
of 65% of the sequences (Fig. 3).
• Significant inter-site differences in
vegetation, sediment biogeochemistry and
methane flux dynamics were not associated
with differences in methanogen community
composition (Table 2).
Methanogenic Diversity and Methane Efflux Across
Two Vegetation Zones of an Urban Freshwater Wetland
References
1Bridgham SD, Cadillo-Quiroz H, Keller JK, Zhuang Q. 2013. Methane
emissions from wetlands: biogeochemical, microbial, and modeling
perspectives from local to global scales. Global Change Biology. 19 (5):
1325-1346.
2Howes BL, Dacey JW, Teal JM. 1985.Annual carbon mineralization and
belowground production of Spartina alterniflora in a New England salt
marsh. Ecology. 66 (2): 595-605.
3Steinberg LM, Regan JM. 2008. Phylogenetic comparison of the
methanogenic communities from an acidic, oligotrophic fen and an
anaerobic digester treating municipal wastewater sludge.Applied and
environmental microbiology. 74 (21): 6663-6671.
Tran QV1, Takeuchi M2, Mouginot C1, and Hamersley MR1
1Soka University of America, Aliso Viejo, CA 2School of Civil and Environmental Engineering, Georgia Institute of Technology, Atlanta, GA
Table 1. Vegetation and sediment
properties of study sites.
Results
Acknowledgements
Funding was provided by Soka University ofAmerica. We
thank the J.H. Martiny Lab (UC, Irvine) for technical
assistance and The City of Newport Beach and M. Yurko (CA
Coastal Commission)for access to the site.
Date
Oct Jan Apr Jul Oct
SedimentCO2flux(mgm
-2
h-1
)
0
100
200
300
400
500
Sediment Temperature (°C)
5 10 15 20
SedimentCO2flux(mgm
-2
h-1
)
0
100
200
300
400
500
2012 2013
Date
Oct Jan Apr Jul Oct
SedimentCH4flux(µgm
-2
h-1
)
0
50
100
150
200
400
600
800
Sediment Temperature (°C)
5 10 15 20
SedimentCH4flux(µgm
-2
h-1
)
0
50
100
150
200
400
600
800
2012 2013
Figure 2. Sediment metabolic fluxes.A:
CO2, B: CH4
Figure 4.
Rarefaction curves.
Additional
sequences would
have to be
recovered to sample
all of the mcrA
diversity
(MOTHUR v.1.37.0).
Figure 3. Phylogenetic tree of mcrA (species OTUs)
(Geneious version 7.1).
0
5
10
15
20
0 40 80 120 160
NumberofOTUs
Number of mcrA sequences recovered
Species Genus Family
Table 2. Inter-site and inter-season PERMANOVA
comparisons of methanogen community structure by
mcrA sequence (E-PRIMER 7).
DNA samples:
- extracted from triplicate 5-cm deep sediment plugs
collected in triplicate during 3 seasons (Jan, Jun, Sept).
- Methyl coenzyme M reductase (mcrA) sequences
amplified with mlas and mcra-rev primers3.
- Sanger sequenced (Beckman Genomics).
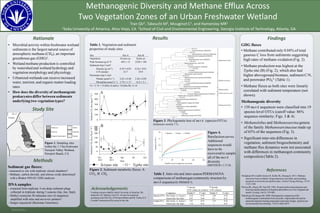
Figure 1. Sampling sites
within the 1.7-ha freshwater
Newport Valley Wetland,
Newport Beach, CA
Site Site A Site B
Vegetation Scirpus sp. Typha sp.
Peak biomass (g m-2)a 465 ± 15 2320 ± 180
Sediment (top 5 cm)b
Density (g cm-3) 0.39 ± 0.03 0.24 ± 0.01
C/N (molar) 23.7 29.9
Porewater (top 5 cm)c
Nitrate (µmol L-1) 2.63 ± 0.48 2.20 ± 0.82
Phosphate (µmol L-1) 2.79 ± 1.37 14.2 ± 3.1
an = 3, bn = 15 (Site A) and n- 18 (Site B), cn =6
Scirpus site Typha site
A
B
A
B
Newport Valley wetland:
Scirpus sp.
Typha sp.
Eriogonum fasciculatum
Upland
Urbanized
Riparian
Estuary
N
50 m
100 ft
A
B
Newport Valley wetland:
Scirpus sp.
Typha sp.
Eriogonum fasciculatum
Upland
Urbanized
Riparian
Estuary
N
50 m
100 ft
Comparison Pseudo-F P-value Pseudo-F P-value
Species OTUs Site (Typha vs. Scirpus ) 0.35 0.78 1.04 0.39
Season (Jan, Jun, Sept) 0.91 0.48 0.9 0.52
Family OTUs Site (Typha vs. Scirpus ) 0.8 0.54 1.39 0.28
Season (Jan, Jun, Sept) 1.16 0.42 1 0.61
α diversity
(OTU richness & evenness)
β diversity
(OTU richness)
Methanobacteriales
Methanosarcinales
Methanocellales
Methanocmassiliicoccales
Methanomicrobiales