
Recommended
More Related Content
What's hot
What's hot (20)
Similar to Cardiac profile tests(biochemical )
Similar to Cardiac profile tests(biochemical ) (20)
More from rohini sane
More from rohini sane (20)
Recently uploaded
Recently uploaded (20)
Cardiac profile tests(biochemical )
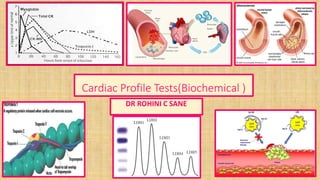
- 1. Cardiac Profile Tests(Biochemical ) DR ROHINI C SANE
- 2. Cardiac Profile Tests IHD –ISCHAEMIC HEART DISEASE: CORONARY BLOOD SUPPLY TO THE MYOCARDIUM IS INADEQUATE AS COMPARED TO ITS DEMAND 1. THE MOST COMMON CAUSE is ATHEROSCLEROSIS 2. CONGENITAL ANAMOLIES OF THE CORONARY ARTERIES 3. CORONARY EMBOLI OF VARIOUS NATURE FROM DIFFIRENT SOURCES (A ) Vegetation of bacterial endocarditis (B ) Atheromatous plague from major coronary artery (C) Diminished blood supply due paroxysmal tachycardia (D) Severe anemia ,CO2 poisoning ,decrease oxygen supply to myocardium
- 3. IHD –ISCHAEMIC HEART DISEASE Clinical manifestation I .Arrhythmias /autonomous disturbance II. Angina pectoris a. Clinical syndrome b. Sudden attacks of chest pain of short duration Precipitation factors 1.Physical exertion 2. Stress 3. Trachycardia 4. Heavy meals 5. Exposure to cold 6. Administration of insulin/T3,T4
- 4. Coronary atheroma Coronary atheroma :lipid deposit within intimal coat of coronary arteries ↓ Narrowing of lumen ↓ Diminished blood supply to myocardium ↓ Formation of thrombus in coronary arteries ↓ Complete occlusion ↓ Infarction /necrosis
- 7. The modifiable risk factors of Cardiac diseases 1. Hyper lipidemia 2. Diabetes Mellitus 3. Smoking 4. Hypertension 5. Stress 6. Obesity 7. Heavy Physical activity 8. Diet high content of saturated fat & cholesterol
- 8. The non-modifiable risk factors of cardiac diseases 1. Heredity: individuals more susceptible to premature atherosclerosis 2. Age : after middle age increase incidence of atherosclerosis 3. Sex : male > women risk of atherosclerosis
- 9. CLASSIFICATION OF CARDIAC PROFILE TESTS GROUP I : DIABETIS MELLITUS - DISTRUBED CARBOHYDRATE METABOLISM ATHEROGENIC RISK FACTORS PRE RENAL CONDITIONS GROUP II : CARDIAC RISK EVALUTION TESTS GROUP III: CARDIAC INJURY PANEL TESTS
- 10. CLASSIFICATION OF CARDIAC PROFILE TESTS • GROUP I : 1. Blood Glucose 2. Blood Urea Nitrogen ( BUN ) 3. Serum creatinine 4. Serum Electrolytes
- 11. CLASSIFICATION OF CARDIAC PROFILE TESTS GROUP II :CARDIAC RISK EVALUTION TESTS 1. Serum Total Cholesterol 2. Serum HDL cholesterol 3. Serum TOTAL/HDL cholesterol 4. Serum VLDL /LDL cholesterol 5. Serum Triglyceride
- 12. CLASSIFICATION OF CARDIAC PROFILE TESTS GROUP III: CARDIAC INJURY PANEL TESTS 1. Serum Creatine Phospho Kinase ( CPK ) 2. Serum Glutamate Oxaloacetate Transferase ( SGPT ) 3. Serum Lactate Dehydrogenase ( LDH ) 4. Serum Hydro Butyrate Dehydrogenase ( SHBD )
- 13. GROUP III: CARDIAC INJURY PANEL TESTS 1. To assess severity of heart disease 2. To follow trend of the disease 3. To determine post operative disease 4. ECG do not permit clear diagnosis ↓ 20% infarct are silent are silent ( elderly Diabetes Mellitus /Hypertension patients ) 5. CPK, LDH ,SGOT, SHBD levels in serum for diagnosis & prognosis 6.Concentration of CPK,LDH ,SGOT ,SHBD α size of infarct
- 15. SERUM LACTATE DEHYDROGENASE (LDH ) • Principle of estimation : Decrease in UV Absorbance at 340 nm as LDH catalyzed reaction progresses • LACTATE + NAD + PYRUVATE + NADH + H + • NORMAL SERUM LEVELS OF LDH = 125- 290 U/ L • OCCURRENCE : HEART ,LIVER ,SKELETAL MUSCLES ,ERYTHROCYTES IDH ,AMI LDH1 > LDH2 ( FLIPPED PATTERN ) • PHYSIOLOGICAL CONDITION : LDH1 < LDH2 ISOENZYME NORMAL RANGE ( % ) UNITS /L (SERUM ) LDH 1 20 – 30 100 LDH 2 32 – 40 115 LDH 3 17 – 23 65 LDH 4 03 - 13 40 LDH 5 04- 12 35
- 16. Cardiac biomarker :Iso-enzymes of Lactate dehydrogenase (LDH ) ENZYME HALF LIFE LDH 1 8 DAYS LDH 6. 8 DAYS CPK -MB 2 DAYS SGOT 4 DAYS AREA UNDER CURVE ,SLOPE OF INITIAL RISE α INFARCT
- 17. Iso enzymes of Lactate dehydrogenase
- 19. Iso enzymes of Lactate dehydrogenase LDH1 LDH5 Optimum condition AEROBIC ANAEROBIC Km high low Affinity for pyruvate low high Synthesis of lactate Not favored Favored
- 20. SERUM APARTATE AMINO TRANSFERASE (AST ) SERUM GLUTAMATE OXALO ACETATE (SGOT ) 1. NORMAL RANGE : 6 – 25 IU/L 2. STARTS INCREASING WITHIN 6 -12 HRS AFTER CHEST PAIN 3. PEAK HRS 24- 48 HRS 4. Less specific indication of myocardial infarction as it occurrence liver, muscle ,hemolytic diseases 5. Prolonged Myocardial Ischemic ,Congestive Heart Failure increase in SGOT ( AST ) 6. Increase in SGOT ( AST ) < Increase in CPK (TOTAL ) 7. HALF LIFE is of small duration & returns to normal within 4-6 days
- 21. Serum Creatinine phosphor kinase (CPK ) 1. Normal ( CPK- MB ) is 6% OF Total CPK activity 2. CPK /GOT ratio < 10 myocardial infarction 3. CPK /GOT ratio > 10 muscular damage 4. Silent myocardial infarction 5. Pain free infarcts Diabetes Mellitus ,Hypertension ,impaired peripheral arterial blood flow 6. ECG /Other findings III ANGINA PECTORIS a) Increase in CPK activity b) Increase in arrhythmias c) Congestive cardiac failure
- 22. Iso enzymes of Creatinine phosphokinase (CPK)
- 23. Creatinine phosphokinase (CPK)-cardiac marker
- 24. Serum Creatine phosphor kinase (CPK ) CPK MM / CPK TOTAL increased observed in 1. myocardial infarction 2. muscular dystrophy 3. Polymyositis 4. Motor neuron disorders 5. acute cerebrovascular accidents Normal range CPK Total Men : 20-50 IU Women : 10-37 IU PRINCIPLE OF ESTIMATION OF CPK (COLORIMETRIC ): CREATINE –P + ADP+ CPK CREATINE + ATP CREATINE + DI ACETYL + α NAPTHOL - alkaline pHcolor complex ( absorbance at 520 nm , green filter )
- 25. Serum Creatine Phospho kinase (CPK ) Precautions for estimation of CPK (1)Patients undergone strenuous exercise before blood collection – erroneous high levels of CPK (2)Minor tissue trauma- erroneous high levels of CPK (3)Sample should be kept in refrigerator until test carried out (4) Cardiac markers (follow time course after onset of AMI )
- 26. MYOGLOBIN (MB ) MYOGLOBIN (MB ) 1. oxygen binding protein in skeletal muscle & cardiac muscles 2. Low molecular weight : cytosolic location 3. Appearance in circulation after muscle injury 4. Myoglobin –monoclonal antibody for estimation by RIA / ELIZA/chemiluminescence 5. Temporal pattern of serum myoglobin & Creatine kinase -2 patients with myocardial infarction
- 28. MYOGLOBIN (MB )as a cardiac marker CLINICAL INTERPRETATION of Serum Myoglobin 1. Increase in serum levels after myocardial infarction as early as 1 hr (necrosis ) 2. Peak values 4-12hrs 3. Myoglobin remain high 0-4hrs 4. Time period :in which CPK -2 & CARDIAC TROPONIN IS VERY SHORT . Disadvantages of Myoglobin as cardiac marker : 1. non specific eg myoglobin increases in any form of muscle damage 2. Methods not tissue specific ( muscle /cardiac ) 3. Muscle injury increase in myoglobin misdiagnosis of AMI
- 29. CARDIAC TROPONINS I. Troponin : “contractile ”proteins of myofibrils regulatory proteins a) Troponin C ( the calcium binding component ) b) Troponin I ( the inhibitory component ) c) Troponin T (Tropomyosin binding component ) II. Component of cardiac muscles III. Longer Half Time –Insoluble Troponin released from infarcted heart muscle therefore circulatory levels remain high . IV .Rise in serum Troponin continues for longer than enzymes
- 30. Comparison between cardiac Troponin I & Troponin T Human cardiac Troponin I Human cardiac Troponin T 30 AMINO ACIDS 11 AMINO ACIDS CARDIAC MARKERS ---SPECIFIC &SENSITIVE MUSCLUAR DYSTROPHY CHRONIC RENAL FAILURE POLYMYOSITIS 2 ISOFORMS—GENETIC ORIGIN INCREASE OBSERVED AFTER AMI—CPK –MB& CPK -TOTAL
- 31. TROPONINS ( MARKER OF MYOCARDIAL INFARCTION ) TROPONINS TYPE PROPERTY TROPONINS C CALCIUM BINDING TROPONINS I ACTINO MYCIN INHIBITORY ATPase TROPONINS T TROPOMYOSIN BINDING ELEMENT
- 33. Cardiac Troponin I &T Clinical interpretation :cardiac troponin ( C Tn I & C Tn T ) 1. Longer half life insoluble troponin released from infarcted heart muscles within 4 to 8 hrs after onset of symptoms 2. Troponin I &C increase significantly after AMI 3. Increase in serum levels of Troponin I &C synchronizes CPK –MB & CPK – TOTAL 4. circulatory levels are maintained for 4-5 days 5. Half life of C Tn I & C Tn T is 5- 10days 6. peak values of C Tn T observed at 72 -100 hrs. 7. peak values of C Tn I observed at 24 -48 hrs. 8. low levels & undetectable serum levels are observed in individuals without cardiac disease( no false + ve or –ve values for C Tn I )
- 34. Comparison of cardiac markers 1. Increase in CPK -2 in conditions individuals without cardiac disease Therefore better risk assessment than CPK –MM . 2. CPK -2 (CPK –MB ) increase in muscle injury 3. ( C Tn I & C Tn T ) don't increase in muscle injury 4. C Tn T excellent marker for AMI VERSES muscle injury when concomitant. 5. C Tn T increases in sepsis, drug induced toxicities ,chronic diseases ,malignancies ,hematological disorder ,non cardiac surgery 6. C Tn I sensitive & specific for AMI
- 35. Biochemical Cardiac Markers CARDIAC MARKER ABNORMAL ACTIVITY DETECTABLE IN ( hrs ) PEAK VALUE OF ABNORMALITY (hrs) DURATION OF ABNORMALITY ( DAYS ) 1 CPK ( TOTAL) 3-8 HRS 10-24 3-4 2 CPK -MB 3-8 HRS 10-24 2-3 3 LDH ( TOTAL ) 8-12HRS 72-144 8-14 4 SGOT ( AST ) 6TO 12HRS ( 24-48 4-6 5 MYOGLOBIN 1TO 3HRS 6-9 1 6 TROPONIN I ( C –T n I ) 3-8 HRS 24-48 3-5 7 TROPONIN T ( C –Tn T ) 3-8 HRS 72-100 5-10
- 36. Homocystein as a cardiac marker Homocystein is formed during biosynthetic pathway of cysteine from Methionine.
- 39. Cardiac profile tests –Homocysteine Normal range : < 15 micro –moles /l (serum ) Inborn error in metabolism of Homocystein: increase serum Homocystein ( paediatric ) > 100 micro –moles /l Free Homocysteine S S Free Homocysteine PROTEINS ← Disulphide bridge ( ) Dimer formation decrease metabolism ( therefore increase in serum Homocystein increase risk of atherosclerosis Molecular basis CHD :damage to lining of blood vessels ( vascular endothelium ) Increase serum Homocystein in growth of vascular muscles
- 44. Causes of Homocysteinuria Genetic causes • Genetic mutation within a gene coding cystathione beta synthetase • Homocystein + Cystathione beta synthase Cystathione Non genetic causes Deficiency of pyridoxal phosphate ( vitamin B6 ) Folic acid (tetra hydro folate ) Vitamin B12 ( CYANOCOBALAMINE ) HOMOCYSTEIN + (VITAMINES B6, B12 ,FA ) METHIONINE Treatment –Dietary supplementation of (VITAMINES B6, B12 ,FA ) till Serum Homocysteine decreases
- 45. Cardiac profile tests –Homocysteine • INCREASE IN SERUM HOMOCYSTEIN Homocysteinemia - coronary arterial disease Molecular basis of coronary arterial disease (CAD )respect to Homocysteinemia 1.damage cell lining of blood vessels 2. increase growth of smooth muscles 3. Homocystein alters anti coagulant properties of endothelial cells to pro coagulant 4. dysfunction of vascular endothelium 5. damaged vascular endothelium Atherosclerosis & CAD Methods of estimation of Homocysteine Gas chromatography, HPLC , immune assays ,Chemiluminescence
- 46. Cardiac profile tests --C reactive protein ( CRP ) 1. ACUTE PHASE PROTEIN (APP ) –MOST SENSITIVE APPS Significant increase observed in a) Inflammatory diseases b) After injury c) inflammation d) Myocardial infarctions e) Tumors 2.NORMAL RANGE : 0.05 TO 0.20mg /L (SERUM ) Increase in Serum CRP indicates high risk of cardio vascular events 20 times increase in CRP ( > 10 mg ) suggestive of AMI
- 47. Cardiac Profile Tests- Serum Hydroxyl Butyrate Dehydogenase(SHBD ) Principle of estimation of SHBD : Alpha oxo butyrate + NADH2 +SHBD ( p H 7.4 ,phosphate buffer ) alpha hydroxyl butyrate + NAD + SOLUTION 1 : PHOSPHATE BUFFER PREPARATION : (STABLE AT 2-8 ◦ C ) 13. 97 gm K2 HPO4 2.69 gm KH2PO4 SOLUTION 2 : (0.0045 mmols/ i e 0.017 gm/dl in 2.5 ml of distilled water ) • Wave length for measurement : 340 nm ,cuvette 1 cm Procedure : 3 ml 0f solution 1 + 0.1 ml of solution2 + sample 0.1 ml mix well ,note extinction at 340nm at 1,2,3 minutes intervals • Determine mean absorbance & change of absorbance (∆ A / minutes ) Calculation : • Concentration of Alpha SHBD ( IU ) = 5079 X ∆ A / minutes • If ∆ A > 0.1 dilute sample 1: 10 with phosphate buffer
- 48. Cardiac profile tests- Serum Hydroxyl Butyrate Dehydogenase Serum SHBD increases significantly in Acute myocardial infarction (AMI) NORMAL RANGE OF SERUM SHBD: • at 25◦ C 55 -140 IU • at 30 ◦ C 65 -165 IU • at 37 ◦ C 72 -182 IU
- 49. Cardiac profile tests- Apo proteins (Apo lipoproteins ) Functions of Apo proteins (Apo lipoproteins ) 1. Structural components of lipoproteins 2. Recognize the membrane surface receptors 3. Activate enzymes involved in lipoprotein metabolism APOPROTEINS SUBGROUPS APO A A-I, AII , AIII APO B B100 ,B 48 APO C C I, CII,CIII APO D APO E
- 52. Cardiac profile tests- Apoproteins (Apolipoproteins ) CLINCAL SIGNIFICANCE OF APOLIPROTEINS : 1. To assess hyper lipedemias with /without increase in LDL CHOLESTROL 2. APO PROTEIN B100 –To assess prognostic value after lipid lowering drug therapy 3. Management of AMI patients decrease risk of re infarction APOPROTEIN TYPE NORMAL RANGE ( PLASMA) Comments Apoprotein A 100-120 mg/dl Apoprotein A1 < 120mg /dl increase risk of CAD > 160mg /dl Protective Apoprotein B 100-120 mg/dl Apoprotein B100 100-120 mg/dl >120 mg /dl HIGH RISK CAD >100 mg /dl moderate RISK CAD Increase in Apoprotein B100 ,decrease Apoprotein B100 suggestive high risk of CAD HDL cholestrol 130-160mg/dl LDL cholesterol 130-160mg/dl
- 53. Cardiac profile tests- Apoproteins (Apolipoproteins ) APOPROTEIN TYPE MOLECULAR WEIGHT COMPONENT OF FUNCTIONS 1. APOPROTEIN A1 28016 HDL & CHYLOMICRONS LECITHIN CHOESTEROL ACYL TANSFERASE (LCAT) ACTIVATOR 2. APOPROTEIN AII 17414 HDL & CHYLOMICRONS SECOND MOST COMMON APOPROTEIN OF HDL 3. APOPROTEIN AIII 46465 HDL & CHYLOMICRONS TRANSFER OF APOPROTEIN BETWEEN HDL & CHYLOMICRONS 4. APOPROTEIN B48 264000 CHYLOMICRONS NECESSARY FOR ASSESSBLY & SECRETION OF CHYLOMICRONS FROM SMALL INTESTINE 5. APOPROTEIN B100 512000 VLDL,IDL,LDL NECESSARY FOR ASSESSBLY & SECRETION OF VLDL FROM LIVER 6. APOPROTEIN CI 7600 VLDL, HDL POSSIBLE LECITHIN CHOESTEROL ACYL TANSFERASE (LCAT) ACTIVATOR 7. APOPROTEIN CII 8900 ALL MAJOR LIPOPROTEINS LECITHIN CHOESTEROL ACYL TANSFERASE (LCAT) ACTIVATOR 8. APOPROTEIN CIII 8800 ALL MAJOR LIPOPROTEINS ACTIVATOR OF LIPOOPROTEIN LIPASE
- 54. Cardiac profile tests- Apoproteins (Apolipoproteins ) APOPROTEIN TYPE MOLECULAR WEIGHT COMPONENT OF FUNCTIONS 9. APOPROTEIN D 22000 MAINLY HDL INVOLVED IN REVERSED CHOLESTEROL TRANSPORT OR ESTERIFIED CHOLESTEROL TO VLDL 10. APOPROTEIN E 34145 ALL MAJOR LIPOPROTEINS LIGAND FOR BINDING OF SEVERAL LIPOPROTEINS TO LDL RECEPTORS
- 55. Cardiac profile tests-ABNORMAL FORM OF LIPOPROTEIN A ( LP a ) 1. Variant of LDL 2. Synthesized in liver 3. LDL –S-S – APO B 100 ( with disulphide bridge ) 4. Interfere with action of plasminogen ( clot resolution ---fibri lysis ) 5. Normal concentration in plasma = < 0.30 gm /l ( <30mg/dl)* 6. High levels of LPa increases in coronary heart disease therefore forms cardio vascular risk factor 7. *Normal range racial specific, vary with ethnic group 8. Lipoprotein levels of African Americans > Caucasians ( more risk for CAD )
- 56. Cardiac profile tests-LIPOPROTEINS /ABNORMAL FORM OF LIPOPROTEIN A ( LP a ) Methods of estimation of LIPOPROTEIN A ( LP a ) : a) Immuno Turbidometric b) Immuno Nephalometric c) Radiometric d) Elisa e) RIA