SlideShare a Scribd company logo
1 of 68
Chapter 7:
Lean Thinking and Lean Systems
McGraw-Hill Education
Copyright © 2018 by The McGraw-Hill Companies, Inc. All
rights reserved.
*
Copyright © 2018 by The McGraw-Hill Companies, Inc. All
rights reserved.
*
The lean systems chapter begins with a broad orientation to lean
and its elements with an historical perspective of its
development. Then each element is discussed in detail in
separate sections. The discussion includes situations in which
elements of lean have been successfully applied, as well as
situations in which they may not be applicable (e.g. smoothing
the master production schedule in services). The chapter
concludes with discussion on implementation of lean systems
and how lean concepts can be applied to all business disciplines
(manufacturing, services, government, etc.).
Chapter 7 Learning ObjectivesLO 7.1 Describe the origins and
evolution of lean thinking.LO 7.2 Describe the five tenets of
lean thinking and the seven forms of waste in a lean system.LO
7.3 Explain how a stabilized master schedule is achieved for
repetitive manufacturing.LO 7.4 Design a kanban system for a
lean system.LO 7.5 Explain how setup time, lot size, layout and
maintenance are related to lean thinking.LO 7.6 Differentiate
how employees, quality, and suppliers are unique in lean
systems.LO 7.7 Explain how to implement a lean system.
7-*
Here are our Learning Objectives for this course. Between
these videos, the textbook, supplemental readings, assignments
and Discussion Boards, you will end the course with some new
skills and many new insights.
*
Evolution of LeanToyota Production System (TPS)Developed in
Japan following WWII (limited resources)Also known as Just-
in-Time (JIT) manufacturingCame to U.S.- 1981 at Kawasaki
motorcycle plant in Lincoln, NebraskaLean ProductionTerm
coined in late 1980sPopularized in 1990s by Womack, Jones &
Roos’ “The Machine That Changed the World”
7-*
Copyright © 2018 by The McGraw-Hill Companies, Inc. All
rights reserved.
Copyright © 2018 by The McGraw-Hill Companies, Inc. All
rights reserved.
After WWII the U. S. system of mass production was the envy
of the world. Mass production – the production of standardized
discrete products in high volume by means of repetitive
manufacturing technologies – was the norm. Materials were
purchased in large batches, and machines were made to run
faster to reduce unit costs.
*
Lean TenetsCreate product/service value from customer
perspectiveReduce waste - mudaIdentify, study, improve the
value streamObserve the process - gembaEnsure simple,
smooth, error-free flowDetermine takt timeProduce only what is
pulled by customerUse kanbansStrive for perfectionHold kaizen
events, 5S, 5 Whys
7-*
Copyright © 2018 by The McGraw-Hill Companies, Inc. All
rights reserved.
Copyright © 2018 by The McGraw-Hill Companies, Inc. All
rights reserved.
Lean thinking is built around five tenets that include specific
concepts, principles, and techniques to organize and deliver
value to customers efficiently. This is where we will focus on
what adds value to a product or service and non-value adding
activities that increase cost and time.
*
The Seven Forms of Waste
7-*
Copyright © 2018 by The McGraw-Hill Companies, Inc. All
rights reserved.Overproduction: Producing more than the
demand for customers, resulting in unnecessary inventory,
handling, paperwork, and warehouse space.Waiting time:
Operators and machines waiting for parts or work to arrive from
suppliers or other operations. Customers waiting in
line.Unnecessary transportation: Double or triple movement of
materials due to poor layouts, lack of coordination, and poor
workplace organization.Excess processing: Poor design or
inadequate maintenance or processes, requiring additional labor
or machine time.Too much inventory: Excess inventory due to
large lot sizes, obsolete items, poor forecasts, or improper
production planning.Unnecessary motion: Wasted movements
of people or extra walking to get materials.Defects: Use of
material, labor, and capacity for production of defects, sorting
out bad parts, or warranty costs with customers.
Copyright © 2018 by The McGraw-Hill Companies, Inc. All
rights reserved.
Remember that value is defined by the customer and provided in
the product or service the customer needs at a place, time, and
price the customer is willing to pay. If inventory is money
sitting on a shelf, then why would a company want to
overproduce and waste its resources? If you are familiar with
your financial statements, then you will know that if the product
is overproduced and has not sold, they suppliers and employees
(inputs) must still be paid on time. This will result in needing
to cover the company’s cost through capital funds, instead of
revenue.
*
Value Stream MappingValue stream is all processing steps to
complete product/serviceExtension of process
flowchartingIncludes value-adding/non-value-adding
activitiesRequires direct observation of process – gemba“Is this
step or task necessary in creating value to the
customer?”Change and improve process
7-*
Copyright © 2018 by The McGraw-Hill Companies, Inc. All
rights reserved.
Copyright © 2018 by The McGraw-Hill Companies, Inc. All
rights reserved.
When we seek to give the customer value and eliminate non-
value activities, we are turning the supply chain into the value
chain. The best method for doing this is to ensure all steps in a
process are needed. Every process is a combination of steps.
By flowcharting a process, we breakdown each activity within
the process into steps. Within a 5 step process, I then seek to
see if I can combine steps 1 & 2, and eliminate step 4. The
number of the step is irrelevant. You can combine steps 2 & 3
and eliminate step 5 or 8. Your goal is to become more
efficient by the reduction of touches or extra procedures that do
not add value to the finished good or service.
*
7-*
Value Stream Mapping
Here is a visual of mapping out a process into steps in order to
identify what is needed (adds value) and what steps are not
needed (non-value adding).
*
Elements of Lean SystemStabilizing the master
scheduleControlling flow with kanban systemReducing setup
time (quick changeover)Small lot sizes (goal lot size of single
unit)Efficient layout (linear flow, low inventories)Preventive
maintenanceCross-training, rewarding workersQuality and
continuous improvementClose relationships with suppliers
(frequent deliveries)
7-*
Copyright © 2018 by The McGraw-Hill Companies, Inc. All
rights reserved.
Copyright © 2018 by The McGraw-Hill Companies, Inc. All
rights reserved.
One of the ways firms can move toward achieving the lean tenet
of simple, smooth, and error-free flow is to level the amount of
work that is performed each day. Remember we spoke of this
earlier when we distributed the workload of producing 100,000
bicycles over 20 production days by manufacturing 5,000 per
day. This practice is referred to as stabilizing the master
schedule. The process of production planning for
manufacturing starts with a long-range production plan using
the forecast, which then is broken down into annual, monthly,
and daily plans.
*
Stabilizing the Master ScheduleProduction horizon set
according to demandProduction schedule repeated each
dayUniform load: level work load across workers/machinesTakt
time: match supply (production rate) to demand rate Produce
planned quantity each day, and no more Desirable, but not
essential, to a lean system
7-*
Copyright © 2018 by The McGraw-Hill Companies, Inc. All
rights reserved.
Copyright © 2018 by The McGraw-Hill Companies, Inc. All
rights reserved.
Matching supply to demand or matching market demand to
production of goods is illustrated by the concept of takt time.
Takt is the German word for the baton that an orchestra director
uses to regulate the speed of the music. A takt time of 2
minutes means that one unit is completed every 2 minutes, or 30
units are produced in an hour.
*
Kanban SystemKanban: “marker” (card, sign)“Pull” production
systemVisual control system of cards and containers, or other
type of signal
Number of containers:
D = Demand rate (at work center)
T = Time for container to complete circuit
C = Container size (# units)
7-*
Copyright © 2018 by The McGraw-Hill Companies, Inc. All
rights reserved.
Copyright © 2018 by The McGraw-Hill Companies, Inc. All
rights reserved.
Kanban is a method of production authorization and materials
movement, which means the company will not over or under
produce, but will meet supply with demand. The production
system supports the tenet of producing only what is pulled by
the customer. This alleviates the buildup of inventory by a pull
production system.
*
The Kanban SystemSignals the need for more partsUses simple
cards or signals to control production/inventoryEach work
center receives production order (card) from succeeding work
centerPrevents the buildup of inventoryReduces lead time
Extends to receiving orders from suppliers
7-*
Copyright © 2018 by The McGraw-Hill Companies, Inc. All
rights reserved.
Copyright © 2018 by The McGraw-Hill Companies, Inc. All
rights reserved.
*
If the market stops or slows, it signals production to stop or
slow, as needed, to meet demand. Go back and visualize having
lunch at Chipotle or Subway. Remember the subassemblies that
are in front of the customer ready to assemble-to-order based on
the customer’s needs. If the customer (market) does not order,
the subassembly does not empty, triggering replenishment.
Kanban System (Figure 7.3)
7-*
Copyright © 2018 by The McGraw-Hill Companies, Inc. All
rights reserved.
Copyright © 2018 by The McGraw-Hill Companies, Inc. All
rights reserved.
Some companies control the movement of containers by using
two types of kanban cards: production cards and withdrawal
(move) cards. These cards are used to authorize production and
to identify the parts in any container. Instead of using cards,
production can also be controlled by kanban squares that
visually signal the need for work (to fill the kanban square), or
by visual control of the empty containers.
*
Reducing Setup Time and Lot SizesReducing setup
time:increases available capacityincreases flexibility to meet
schedule changesreduces inventorySetup typesSingle (single
digit minutes) One-touch (less then 1 min; 2-step
process)Internal (while machine stopped)External (while
machine operating)Lot size reductionGoal: single unit
production
7-*
Copyright © 2018 by The McGraw-Hill Companies, Inc. All
rights reserved.
Copyright © 2018 by The McGraw-Hill Companies, Inc. All
rights reserved.
Time is money and slow production rates waste a company’s
resources. Inventory can be decreased by reducing the size of
the containers or the number of containers used in the kanban
system. This is done by reducing the lead time, the time
required to circulate a container. When any of these times have
been reduced, management can remove kanban cards from the
system and remove a corresponding number of containers. It is
the responsibility of managers and workers in a lean system to
reduce inventory by means of a continuous cycle of
improvement. I say “if it ain’t broken, break it!” Reducing lead
time by reducing the fill, wait, move, use or return times is the
key.
*
Chapter 7 SummaryLO 7.1 Describe the origins and evolution of
lean thinking.LO 7.2 Describe the five tenets of lean thinking
and the seven forms of waste in a lean system.LO 7.3 Explain
how a stabilized master schedule is achieved for repetitive
manufacturing.LO 7.4 Design a kanban system for a lean
system.LO 7.5 Explain how setup time, lot size, layout and
maintenance are related to lean thinking.LO 7.6 Differentiate
how employees, quality, and suppliers are unique in lean
systems.LO 7.7 Explain how to implement a lean system.
7-*
Copyright © 2018 by The McGraw-Hill Companies, Inc. All
rights reserved.
Copyright © 2018 by The McGraw-Hill Companies, Inc. All
rights reserved.
Summarize
*
*
The lean systems chapter begins with a broad orientation to lean
and its elements with an historical perspective of its
development. Then each element is discussed in detail in
separate sections. The discussion includes situations in which
elements of lean have been successfully applied, as well as
situations in which they may not be applicable (e.g. smoothing
the master production schedule in services). The chapter
concludes with discussion on implementation of lean systems
and how lean concepts can be applied to all business disciplines
(manufacturing, services, government, etc.).
Here are our Learning Objectives for this course. Between
these videos, the textbook, supplemental readings, assignments
and Discussion Boards, you will end the course with some new
skills and many new insights.
*
After WWII the U. S. system of mass production was the envy
of the world. Mass production – the production of standardized
discrete products in high volume by means of repetitive
manufacturing technologies – was the norm. Materials were
purchased in large batches, and machines were made to run
faster to reduce unit costs.
*
Lean thinking is built around five tenets that include specific
concepts, principles, and techniques to organize and deliver
value to customers efficiently. This is where we will focus on
what adds value to a product or service and non-value adding
activities that increase cost and time.
*
Remember that value is defined by the customer and provided in
the product or service the customer needs at a place, time, and
price the customer is willing to pay. If inventory is money
sitting on a shelf, then why would a company want to
overproduce and waste its resources? If you are familiar with
your financial statements, then you will know that if the product
is overproduced and has not sold, they suppliers and employees
(inputs) must still be paid on time. This will result in needing
to cover the company’s cost through capital funds, instead of
revenue.
*
When we seek to give the customer value and eliminate non-
value activities, we are turning the supply chain into the value
chain. The best method for doing this is to ensure all steps in a
process are needed. Every process is a combination of steps.
By flowcharting a process, we breakdown each activity within
the process into steps. Within a 5 step process, I then seek to
see if I can combine steps 1 & 2, and eliminate step 4. The
number of the step is irrelevant. You can combine steps 2 & 3
and eliminate step 5 or 8. Your goal is to become more
efficient by the reduction of touches or extra procedures that do
not add value to the finished good or service.
*
Here is a visual of mapping out a process into steps in order to
identify what is needed (adds value) and what steps are not
needed (non-value adding).
*
One of the ways firms can move toward achieving the lean tenet
of simple, smooth, and error-free flow is to level the amount of
work that is performed each day. Remember we spoke of this
earlier when we distributed the workload of producing 100,000
bicycles over 20 production days by manufacturing 5,000 per
day. This practice is referred to as stabilizing the master
schedule. The process of production planning for
manufacturing starts with a long-range production plan using
the forecast, which then is broken down into annual, monthly,
and daily plans.
*
Matching supply to demand or matching market demand to
production of goods is illustrated by the concept of takt time.
Takt is the German word for the baton that an orchestra director
uses to regulate the speed of the music. A takt time of 2
minutes means that one unit is completed every 2 minutes, or 30
units are produced in an hour.
*
Kanban is a method of production authorization and materials
movement, which means the company will not over or under
produce, but will meet supply with demand. The production
system supports the tenet of producing only what is pulled by
the customer. This alleviates the buildup of inventory by a pull
production system.
*
*
If the market stops or slows, it signals production to stop or
slow, as needed, to meet demand. Go back and visualize having
lunch at Chipotle or Subway. Remember the subassemblies that
are in front of the customer ready to assemble-to-order based on
the customer’s needs. If the customer (market) does not order,
the subassembly does not empty, triggering replenishment.
Some companies control the movement of containers by using
two types of kanban cards: production cards and withdrawal
(move) cards. These cards are used to authorize production and
to identify the parts in any container. Instead of using cards,
production can also be controlled by kanban squares that
visually signal the need for work (to fill the kanban square), or
by visual control of the empty containers.
*
Time is money and slow production rates waste a company’s
resources. Inventory can be decreased by reducing the size of
the containers or the number of containers used in the kanban
system. This is done by reducing the lead time, the time
required to circulate a container. When any of these times have
been reduced, management can remove kanban cards from the
system and remove a corresponding number of containers. It is
the responsibility of managers and workers in a lean system to
reduce inventory by means of a continuous cycle of
improvement. I say “if it ain’t broken, break it!” Reducing lead
time by reducing the fill, wait, move, use or return times is the
key.
*
Summarize
*
C
DT
n
=
Chapter 4:
Process Selection
Copyright © 2018 by The McGraw-Hill Companies, Inc. All
rights reserved.
McGraw-Hill Education
Copyright © 2018 by The McGraw-Hill Companies, Inc. All
rights reserved.
4-*
Copyright © 2018 by The McGraw-Hill Companies, Inc. All
rights reserved.
*
The purpose of this chapter is to describe the major types of
processes available and the factors that should be considered in
any process selection decision. Two major dimensions of
process classification are considered; flow of the product, and
type of customer order. The product-process matrix, formulated
by Hayes and Wheelwright, provides a basis for process
selection by linking product-process and corporate strategy.
Focused Operations, Mass Customization and 3D Printing are
also covered as part of process selection decisions.
Chapter 4 Learning ObjectivesLO 4.1 Contrast and compare the
five types of product-flow processes.LO 4.2 Describe the
differences among order fulfillment processes.LO 4.3 Explain
how companies should make process selection decisions.LO 4.4
Correctly place examples of products on the diagonal of the
product-process matrix.LO 4.5 Describe the features of focused
operations.LO 4.6 Discuss the advantages and disadvantages of
mass customization and 3D Printing.LO 4.7 Contrast pollution
prevention, control and practices.
Copyright © 2018 by The McGraw-Hill Companies, Inc. All
rights reserved.
4-*
Copyright © 2018 by The McGraw-Hill Companies, Inc. All
rights reserved.
Here are our Learning Objectives for this course. Between
these videos, the textbook, supplemental readings, assignments
and Discussion Boards, you will end the course with some new
skills and many new insights.
*
Product-Flow Characteristics
Types of Product FlowContinuous processAssembly lineBatch
flowJob shopProject
Copyright © 2018 by The McGraw-Hill Companies, Inc. All
rights reserved.
4-*
Copyright © 2018 by The McGraw-Hill Companies, Inc. All
rights reserved.
Process selection decisions determine the type of process used
to make a product or service. The considerations required for
process selection include the volume of the product and whether
the product is standardized or customized. Remember that
standardization refers to mass production of the same product
(i.e. cookie cutter). This helps keep the unit cost down by
limiting the flexibility of change the product. Customization
enables manufacturers to give customers many choices.
Generally speaking, high-volume products that are standardized
will be made using either a continuous process or an assembly
line, both where there is little to no downtime. Low-volume
customized products will be made using a batch or job shop
process where there’s more down time associated with
producing the product.
*
Product-Flow Characteristics:
Continuous ProcessHighly standardized and
automatedFlexibility limitedHigh volumes of
productionCommodity productsLow cost is the ‘Order
Winner’Process industries (sugar, paper, oil, electricity, etc.)
Copyright © 2018 by The McGraw-Hill Companies, Inc. All
rights reserved.
4-*
Copyright © 2018 by The McGraw-Hill Companies, Inc. All
rights reserved.
Continuous production tends to make products that are difficult
to differentiate and low cost becomes the “order winner” for
manufacturing to compete in very price-sensitive markets.
Therefore, continuous production tends to be highly automated,
operate at capacity, and minimize inventories and distribution
costs to reduce the total cost of manufacturing.
*
Product-Flow Characteristics:
Assembly LineLinear sequence of operations (often paced)Large
capital investment, use of automationVery efficientHigh-
volume, standardized productsLow flexibility to product and
volume changesDiscrete products (autos, appliances, computers,
etc.)
Copyright © 2018 by The McGraw-Hill Companies, Inc. All
rights reserved.
4-*
Copyright © 2018 by The McGraw-Hill Companies, Inc. All
rights reserved.
Assembly lines make only one or a few products and use
inflexible equipment and labor. The assembly-line flow is
characterized by a linear sequence of operations where the
product moves from one step to the next in a sequential manner
from beginning to end. The example I like to reference is
Subway or Chipotle fast food restaurants. You start at one end
then work your way down the assembly line as your order is
being finalized. The sub-assemblies of products are laid out to
give the customer a modular design of options to produce a
finished good.
*
Assembly Line: Metal Bracket (Figure 4.1)
paint
drill
bend
Task or work station
Product flow
cut
Copyright © 2018 by The McGraw-Hill Companies, Inc. All
rights reserved.
4-*
Copyright © 2018 by The McGraw-Hill Companies, Inc. All
rights reserved.
Example of how an assembly line production is set up in a
linear flow.
*
Product-Flow Characteristics:
Batch FlowProduction of batches or lotsBatches flow as a unit
(set) from one work center to anotherProcess layout of work
centers (by tasks)Flow is jumbled and intermittentFlexible labor
and equipment (general purpose)Low to high volume, variety of
productsMany types of products (furniture, dishes, boats)
Copyright © 2018 by The McGraw-Hill Companies, Inc. All
rights reserved.
4-*
Copyright © 2018 by The McGraw-Hill Companies, Inc. All
rights reserved.
Earlier I mentioned that batch flow production has more
downtime than continuous flow and assembly line productions.
This is because items can travel from one work center to
another in jumbled patterns. Because work is completed in
batches or lots, only 10% to 20% of the work being completed.
Imagine 50 boards of lumber waiting to be sawed or cut to a
metric of 30 inches each. While the first board is being cut, the
other 49 boards are waiting (downtime) to be cut. While the
second board is being cut, again, the other 49 boards are
waiting. Not until all boards are cut do they travel to the next
work station, say drilling. If that particular work order does not
require any holes to be drilled, then they can skip that work
center (drilling) and move to another work center (painting).
There’s flexible labor and equipment build into this form of
production flow.
*
Batch Flow: Three Metal Brackets (Figure 4.2)
Cut
Paint
Task or work station
Product flows
Bend
Drill
Batch A
Batch B
Batch C
Copyright © 2018 by The McGraw-Hill Companies, Inc. All
rights reserved.
4-*
Copyright © 2018 by The McGraw-Hill Companies, Inc. All
rights reserved.
Example of how a batch flow production line is set up in a
jumbled flow.
*
Product-Flow Characteristics:
Job ShopCustomized to customer orderProduction of small
batches or lotsLayout/flow similar to Batch FlowFlexible labor
and equipment (general purpose)Many types of made-to-order
products (plastic parts, machine components, sheet metal parts,
custom signs, artificial limbs, etc.)
Copyright © 2018 by The McGraw-Hill Companies, Inc. All
rights reserved.
4-*
Copyright © 2018 by The McGraw-Hill Companies, Inc. All
rights reserved.
Like the batch process, a job shop uses general-purpose
equipment and has a jumbled flow. It has high flexibility for
product is and volume of production, but the costs are higher
since the volume and standardization are low. Typical products
produced in a job shop include products that are made-to-order.
*
Product-Flow Characteristics:
ProjectProduction of customized single productsLabor and
materials brought to sitePlanning, scheduling challengesLittle
automation, general purpose equipmentHighly skilled and
flexible labor Unique, one of a kind products (bridges, building
construction, large aircraft, etc.)
Copyright © 2018 by The McGraw-Hill Companies, Inc. All
rights reserved.
4-*
Copyright © 2018 by The McGraw-Hill Companies, Inc. All
rights reserved.
In the project form of operations, each unit is made individually
and is different from the other units. Projects are used when the
customer desires customization and uniqueness. The costs of
production for projects are high and sometimes difficult to
control. This is the case because the project may be difficult to
define in all its details with the project scope.
*
Throughput Ratio: Process efficiency
TR =
Total processing time for the job
Total time in operations
X 100%
Typically:
90-100% in Continuous Process and Assembly Line
10-20% in Batch Flow and Job Shop
Copyright © 2018 by The McGraw-Hill Companies, Inc. All
rights reserved.
4-*
Copyright © 2018 by The McGraw-Hill Companies, Inc. All
rights reserved.
I stated several times that “time is money” and producing on a
continuous flow or assembly line lowers the product’s unit cost.
This is because of the throughput ratio and how it relates to
uptime and downtime. In the numerator of the throughput ratio
is the total processing time for the job, which includes only the
time the job actually spends being processed by machines or
labor, excluding any waiting time between operations. The
denominator includes the total time the job spends in
operations, including both processing and waiting time. Batch
flow items have between 10% to 20% throughput ratios which
mean they can spend 80% to 90% of their time waiting to be
processed.
*
Order FulfillmentMake-to-Stock (MTS)Make-to-Order
(MTO)Assemble-to-Order (ATO)
Copyright © 2018 by The McGraw-Hill Companies, Inc. All
rights reserved.
4-*
Copyright © 2018 by The McGraw-Hill Companies, Inc. All
rights reserved.
Another critical decision of operations is how the orders from
customers are fulfilled. Remember the difference in operations
when we spoke of the assembly to order process that Chipotle
uses versus the make to order process of a standard taco shop.
*
Make-to-Stock (MTS)Produce finished goods according to
production scheduleCustomer buys from inventoryAdvantage:
faster fulfillment of customer demand, lower cost, smooth
production rateDisadvantage: inventory holding costs, slower
to respond to changes in customer preferences
Copyright © 2018 by The McGraw-Hill Companies, Inc. All
rights reserved.
4-*
Copyright © 2018 by The McGraw-Hill Companies, Inc. All
rights reserved.
When you consider manufactured products that “make-to-stock”
you should think of the word inventory. Remember that
inventory is money sitting on a shelf until it is purchased to you
should only produce what the market pulls from your stock. So
what your company is doing is producing a product that is made
to forecast because there is no end-user request yet. The end-
user walks into a store and purchases the product from the
store’s inventory.
This process results in lower unit costs and smoother production
rates because as we forecast demand, we can level out product
cost. For example: if the market demands 100,000 bicycles per
month, we can break or smooth that product rate down to 5,000
bicycles per day (5 production days per week times 4 weeks per
month). Once we know what our production rate (5,000) is per
day, we hire the right amount of employees, order the precise
number of raw materials to arrive just-in-time, and budget the
associated transportation and holding costs.
*
Make-to-Stock (Figure 4.3)
Customer
Forecast orders
Production
Finished goods inventory
Product
Customer order
Product
Copyright © 2018 by The McGraw-Hill Companies, Inc. All
rights reserved.
4-*
Copyright © 2018 by The McGraw-Hill Companies, Inc. All
rights reserved.
This is a visual example of the make-to-stock product cycle.
The market provides a forecast that is used to calculate
production and produce finished goods that are held in
inventory until customer purchase.
*
MTS Performance MeasuresService level (orders filled when
requested)Inventory replenishment timeInventory turnover
(sales/avg. inventory)Capacity utilizationTime to fill back
orderOthers, such as shrinkage rate
Copyright © 2018 by The McGraw-Hill Companies, Inc. All
rights reserved.
4-*
Copyright © 2018 by The McGraw-Hill Companies, Inc. All
rights reserved.
Inventory turnover is critical because if market demand slows or
stops, a company can be left with over-production. If market
demand increases, a company can suffer from stock outs or lost
sales. Accurate forecasting is also critical to replenishment
time for the same reasons.
Using Christmas day as an example, for customers to have their
purchases available by 12/25, the traditionally conduct their
shopping the day after the Thanksgiving holiday, known as
Black Friday or Cyber Monday. Therefore stores want their
shelfs stocked by 11/25. With 4 weeks manufacturing lead and
throughput times, a company would need to start producing the
products on 10/25. To ensure the raw materials arrive just-in-
time for production to start on 10/25, they may require their
suppliers to commence their production months earlier
depending how far backwards their supply chain are connected.
If we use the bicycles as the products, the manufacturing
company that assembles the bicycles on 10/25 would need to
forecast and order the frames, handle bars, chains, tires, wheels,
etc. months before production begins.
*
Make-to-Order (MTO)Start production after customer ordersNo
finished goods inventoryAdvantage: higher flexibility to
customize order; no finished goods inventory
costsDisadvantage: intermittent production (i.e., lumpy demand
pattern), slower response to customer demand
Copyright © 2018 by The McGraw-Hill Companies, Inc. All
rights reserved.
4-*
Copyright © 2018 by The McGraw-Hill Companies, Inc. All
rights reserved.
No forecast is needed for make-to-order production because it is
more customized per the customer’s wishes. This requires much
flexibility from the manufacturer and the customer. Lead times
are longer because production cycles and rates cannot be
smoothed over time.
*
Make-to-Order (Figure 4.3)
Customer
Production
Product
Customer order
Copyright © 2018 by The McGraw-Hill Companies, Inc. All
rights reserved.
4-*
Copyright © 2018 by The McGraw-Hill Companies, Inc. All
rights reserved.
This is a visual example of the make-to-order product cycle.
The market does not need to provide a forecast as production
does not begin until the customer places an order. There is no
finished inventory.
*
MTO Performance Measures
Lead time
Orders completed on time (%)
Customer request date
Promise date
Copyright © 2018 by The McGraw-Hill Companies, Inc. All
rights reserved.
4-*
Copyright © 2018 by The McGraw-Hill Companies, Inc. All
rights reserved.
The most critical aspect of MTO is delivering the final product
when promised. Lead times will be longer as raw materials and
a customer’s preference is unknown until the order is placed.
*
Assemble-to-Order (ATO)Produce parts and subassemblies
(modules); complete production when customer places order
Advantage: less finished goods inventory, faster fulfillment of
customer order
Disadvantage: work-in-process inventory
Copyright © 2018 by The McGraw-Hill Companies, Inc. All
rights reserved.
4-*
Copyright © 2018 by The McGraw-Hill Companies, Inc. All
rights reserved.
Assemble-to-order uses a hybrid process of MTO and MTS.
There are subassemblies or made-to-stock, but the final
assembly is made-to-order. Visualize walking into a Chipotle
or Subway for lunch. The final product is made from
subassemblies of ingredients and as you walk down the
assembly line, you have a say in how the final product is made.
*
Assemble-to-Order (Figure 4.3)
Customer
Forecast orders
Production of subassemblies
Inventory of subassemblies
Customer order
Product
Assembly of the order
Subassembly
Copyright © 2018 by The McGraw-Hill Companies, Inc. All
rights reserved.
4-*
Copyright © 2018 by The McGraw-Hill Companies, Inc. All
rights reserved.
This is a visual example of the assemble-to-order product cycle.
The market provides a forecast that is used to calculate
production of subassemblies, and then the finished good is
assembled once the customer’s order is received.
*
Process Selection DecisionsProcess characteristics (produce
when? produce how?)When: MTS, MTO, ATOHow:
Continuous process, Assembly line, Batch flow,
Job shop, ProjectFactors affecting process choiceMarket
conditionsCapital requirementsAvailability and cost of
laborTechnology options
Copyright © 2018 by The McGraw-Hill Companies, Inc. All
rights reserved.
4-*
Copyright © 2018 by The McGraw-Hill Companies, Inc. All
rights reserved.
We have discussed two dimensions that can be used for process
classification purposes: product flow and approaches to order
fulfillments. These dimensions are used to construct the six-
cell matrix you will see in the next slide.
*
Process Characteristics Matrix (Table 4.2)
Copyright © 2018 by The McGraw-Hill Companies, Inc. All
rights reserved.
4-*
Copyright © 2018 by The McGraw-Hill Companies, Inc. All
rights reserved.
Characteristics
Make-to-Stock
Make-to-Order
or ATO
Continuous and
Assembly
Line Flow
Automobile assembly
Oil refinery
Cannery
Cafeteria
Automobile assembly
Dell computers
Electronic components
Fast food
Batch and Job Shop
Machine shop
Wine
Glassware factory
Costume jewelry
Machine shop
Restaurant
Hospital
Custom jewelry
Project
Speculation homes
Commercial paintings
Noncommissioned art
Buildings
Movies
Ships
This matrix contains the six combinations used in practice.
Multiple combinations may be used by a single firm, depending
on the products and volumes required by the market. Although
it is common for an assembly-line operation to make-to-stock, it
can also assemble-to-order. For example, an automobile
assembly line is used to produce a large variety of different
automobile options for particular customers, as well as cars that
are being made for dealer stock.
*
Product-Process StrategyStrategy must consider product
characteristics and process capabilities.Product life cycle:
Often begins in Job Shop, then Batch Flow, then
Continuous/Assembly Line. Example: Bread was first
produced by hand in individual units in traditional bakeries, and
is now produced in very large batches in modern automated
bakeries.
Copyright © 2018 by The McGraw-Hill Companies, Inc. All
rights reserved.
4-*
Copyright © 2018 by The McGraw-Hill Companies, Inc. All
rights reserved.
Process decisions are not static because processes evolve over
time. The product-process matrix on the next slide will show
you how a business can decide to move from batch flow to
continuous/assembly flow as market demands increase and
production rates are ramped up to meet that demand.
*
Product-Process Matrix (Figure 4.5)
Low volume,
low
standardization
Printing
Heavy
Equipment
Auto
assembly
Sugar
Refinery
Low volume,
multiple
products
Higher volume
few major
products
High volume, high
standardization,
commodity
NONE
NONE
Unique, one of
a kind
product
Project
Building
Copyright © 2018 by The McGraw-Hill Companies, Inc. All
rights reserved.
4-*
Copyright © 2018 by The McGraw-Hill Companies, Inc. All
rights reserved.
A firm might be tempted to move down the diagonal ahead of its
competitors and thus gain competitive advantage at lower cost.
This can be a good idea if the customer is ready to accept a
more standardized and higher-volume product.
*
Mass CustomizationStrategy to produce products in lot sizes =
1, in high volume.
Made possible by flexible manufacturing.
Traditional mass production provides economies of scale.
Mass Customization means using a high volume process
(economies of scale = low unit cost) to produce relatively
custom products (economies of scope = high variety).
Copyright © 2018 by The McGraw-Hill Companies, Inc. All
rights reserved.
4-*
Copyright © 2018 by The McGraw-Hill Companies, Inc. All
rights reserved.
With the advent of flexible manufacturing, due in large part by
using the modular design concept (few common components
offering a large variety of finished goods), mass customization
is now possible. This dichotomy between mass production and
customization can be overcome by using modern technologies,
including computers, robotics, and the Internet.
*
Chapter 4 SummaryLO 4.1 Contrast and compare the five types
of product-flow processes.LO 4.2 Describe the differences
among order fulfillment processes.LO 4.3 Explain how
companies should make process selection decisions.LO 4.4
Correctly place examples of products on the diagonal of the
product-process matrix.LO 4.5 Describe the features of focused
operations.LO 4.6 Discuss the advantages and disadvantages of
mass customization and 3D Printing.LO 4.7 Contrast pollution
prevention, control and practices.
Copyright © 2018 by The McGraw-Hill Companies, Inc. All
rights reserved.
4-*
Copyright © 2018 by The McGraw-Hill Companies, Inc. All
rights reserved.
Summarize
*
*
The purpose of this chapter is to describe the major types of
processes available and the factors that should be considered in
any process selection decision. Two major dimensions of
process classification are considered; flow of the product, and
type of customer order. The product-process matrix, formulated
by Hayes and Wheelwright, provides a basis for process
selection by linking product-process and corporate strategy.
Focused Operations, Mass Customization and 3D Printing are
also covered as part of process selection decisions.
Here are our Learning Objectives for this course. Between
these videos, the textbook, supplemental readings, assignments
and Discussion Boards, you will end the course with some new
skills and many new insights.
*
Process selection decisions determine the type of process used
to make a product or service. The considerations required for
process selection include the volume of the product and whether
the product is standardized or customized. Remember that
standardization refers to mass production of the same product
(i.e. cookie cutter). This helps keep the unit cost down by
limiting the flexibility of change the product. Customization
enables manufacturers to give customers many choices.
Generally speaking, high-volume products that are standardized
will be made using either a continuous process or an assembly
line, both where there is little to no downtime. Low-volume
customized products will be made using a batch or job shop
process where there’s more down time associated with
producing the product.
*
Continuous production tends to make products that are difficult
to differentiate and low cost becomes the “order winner” for
manufacturing to compete in very price-sensitive markets.
Therefore, continuous production tends to be highly automated,
operate at capacity, and minimize inventories and distribution
costs to reduce the total cost of manufacturing.
*
Assembly lines make only one or a few products and use
inflexible equipment and labor. The assembly-line flow is
characterized by a linear sequence of operations where the
product moves from one step to the next in a sequential manner
from beginning to end. The example I like to reference is
Subway or Chipotle fast food restaurants. You start at one end
then work your way down the assembly line as your order is
being finalized. The sub-assemblies of products are laid out to
give the customer a modular design of options to produce a
finished good.
*
Example of how an assembly line production is set up in a
linear flow.
*
Earlier I mentioned that batch flow production has more
downtime than continuous flow and assembly line productions.
This is because items can travel from one work center to
another in jumbled patterns. Because work is completed in
batches or lots, only 10% to 20% of the work being completed.
Imagine 50 boards of lumber waiting to be sawed or cut to a
metric of 30 inches each. While the first board is being cut, the
other 49 boards are waiting (downtime) to be cut. While the
second board is being cut, again, the other 49 boards are
waiting. Not until all boards are cut do they travel to the next
work station, say drilling. If that particular work order does not
require any holes to be drilled, then they can skip that work
center (drilling) and move to another work center (painting).
There’s flexible labor and equipment build into this form of
production flow.
*
Example of how a batch flow production line is set up in a
jumbled flow.
*
Like the batch process, a job shop uses general-purpose
equipment and has a jumbled flow. It has high flexibility for
product is and volume of production, but the costs are higher
since the volume and standardization are low. Typical products
produced in a job shop include products that are made-to-order.
*
In the project form of operations, each unit is made individually
and is different from the other units. Projects are used when the
customer desires customization and uniqueness. The costs of
production for projects are high and sometimes difficult to
control. This is the case because the project may be difficult to
define in all its details with the project scope.
*
I stated several times that “time is money” and producing on a
continuous flow or assembly line lowers the product’s unit cost.
This is because of the throughput ratio and how it relates to
uptime and downtime. In the numerator of the throughput ratio
is the total processing time for the job, which includes only the
time the job actually spends being processed by machines or
labor, excluding any waiting time between operations. The
denominator includes the total time the job spends in
operations, including both processing and waiting time. Batch
flow items have between 10% to 20% throughput ratios which
mean they can spend 80% to 90% of their time waiting to be
processed.
*
Another critical decision of operations is how the orders from
customers are fulfilled. Remember the difference in operations
when we spoke of the assembly to order process that Chipotle
uses versus the make to order process of a standard taco shop.
*
When you consider manufactured products that “make-to-stock”
you should think of the word inventory. Remember that
inventory is money sitting on a shelf until it is purchased to you
should only produce what the market pulls from your stock. So
what your company is doing is producing a product that is made
to forecast because there is no end-user request yet. The end-
user walks into a store and purchases the product from the
store’s inventory.
This process results in lower unit costs and smoother production
rates because as we forecast demand, we can level out product
cost. For example: if the market demands 100,000 bicycles per
month, we can break or smooth that product rate down to 5,000
bicycles per day (5 production days per week times 4 weeks per
month). Once we know what our production rate (5,000) is per
day, we hire the right amount of employees, order the precise
number of raw materials to arrive just-in-time, and budget the
associated transportation and holding costs.
*
This is a visual example of the make-to-stock product cycle.
The market provides a forecast that is used to calculate
production and produce finished goods that are held in
inventory until customer purchase.
*
Inventory turnover is critical because if market demand slows or
stops, a company can be left with over-production. If market
demand increases, a company can suffer from stock outs or lost
sales. Accurate forecasting is also critical to replenishment
time for the same reasons.
Using Christmas day as an example, for customers to have their
purchases available by 12/25, the traditionally conduct their
shopping the day after the Thanksgiving holiday, known as
Black Friday or Cyber Monday. Therefore stores want their
shelfs stocked by 11/25. With 4 weeks manufacturing lead and
throughput times, a company would need to start producing the
products on 10/25. To ensure the raw materials arrive just-in-
time for production to start on 10/25, they may require their
suppliers to commence their production months earlier
depending how far backwards their supply chain are connected.
If we use the bicycles as the products, the manufacturing
company that assembles the bicycles on 10/25 would need to
forecast and order the frames, handle bars, chains, tires, wheels,
etc. months before production begins.
*
No forecast is needed for make-to-order production because it is
more customized per the customer’s wishes. This requires much
flexibility from the manufacturer and the customer. Lead times
are longer because production cycles and rates cannot be
smoothed over time.
*
This is a visual example of the make-to-order product cycle.
The market does not need to provide a forecast as production
does not begin until the customer places an order. There is no
finished inventory.
*
The most critical aspect of MTO is delivering the final product
when promised. Lead times will be longer as raw materials and
a customer’s preference is unknown until the order is placed.
*
Assemble-to-order uses a hybrid process of MTO and MTS.
There are subassemblies or made-to-stock, but the final
assembly is made-to-order. Visualize walking into a Chipotle
or Subway for lunch. The final product is made from
subassemblies of ingredients and as you walk down the
assembly line, you have a say in how the final product is made.
*
This is a visual example of the assemble-to-order product cycle.
The market provides a forecast that is used to calculate
production of subassemblies, and then the finished good is
assembled once the customer’s order is received.
*
We have discussed two dimensions that can be used for process
classification purposes: product flow and approaches to order
fulfillments. These dimensions are used to construct the six-
cell matrix you will see in the next slide.
*
This matrix contains the six combinations used in practice.
Multiple combinations may be used by a single firm, depending
on the products and volumes required by the market. Although
it is common for an assembly-line operation to make-to-stock, it
can also assemble-to-order. For example, an automobile
assembly line is used to produce a large variety of different
automobile options for particular customers, as well as cars that
are being made for dealer stock.
*
Process decisions are not static because processes evolve over
time. The product-process matrix on the next slide will show
you how a business can decide to move from batch flow to
continuous/assembly flow as market demands increase and
production rates are ramped up to meet that demand.
*
A firm might be tempted to move down the diagonal ahead of its
competitors and thus gain competitive advantage at lower cost.
This can be a good idea if the customer is ready to accept a
more standardized and higher-volume product.
*
With the advent of flexible manufacturing, due in large part by
using the modular design concept (few common components
offering a large variety of finished goods), mass customization
is now possible. This dichotomy between mass production and
customization can be overcome by using modern technologies,
including computers, robotics, and the Internet.
*
Summarize
*
Characteristics Make-to-Stock
Make-to-Order
or ATO
Continuous and
Assembly
Line Flow
Automobile assembly
Oil refinery
Cannery
Cafeteria
Automobile assembly
Dell computers
Electronic components
Fast food
Batch and Job Shop
Machine shop
Wine
Glassware factory
Costume jewelry
Machine shop
Restaurant
Hospital
Custom jewelry
Project
Speculation homes
Commercial painting s
Noncommissioned art
Buildings
Movies
Ships
McGraw-Hill/Irwin
Chapter 3:
Product Design
Copyright © 2018 by The McGraw-Hill Companies, Inc. All
rights reserved.
3-*
Copyright © 2018 by The McGraw-Hill Companies, Inc. All
rights reserved.
*
The purpose of this chapter is to show how product design
relates to the operations function along with collaboration with
customers and suppliers in the supply chain. The chapter
stresses the steps in product design and the interaction between
product design and process design. The chapter also discusses
cross-functional design, quality function deployment, and
reduction of product variety through the use of modular design.
McGraw-Hill/Irwin
Chapter 3 Learning ObjectivesLO 3.1 Compare the three
strategies for new product introduction.LO 3.2 Describe the
three phases of new-product development.LO 3.3 Evaluate how
concurrent engineering deals with misalignment.LO 3.4
Describe the criteria that should be used for supplier
selection.LO 3.5 Evaluate an example of Quality Function
Deployment. LO 3.6 Explain the benefits of modular design.
Copyright © 2018 by The McGraw-Hill Companies, Inc. All
rights reserved.
3-*
Copyright © 2018 by The McGraw-Hill Companies, Inc. All
rights reserved.
McGraw-Hill/Irwin
Product Design:
Why Does Operations Care?Traditionally: throw design “over
the wall”Today:must be able to make the product
(process)technologyavailability of resourcesmust have the right
type and amount of capacitymust deliver a quality product or
servicemust have right inventory at right time
Copyright © 2018 by The McGraw-Hill Companies, Inc. All
rights reserved.
3-*
Copyright © 2018 by The McGraw-Hill Companies, Inc. All
rights reserved.
Imagine a company’s R&D department spending 4 weeks in
designing a product just to have the finance department send the
plans back saying there’s no money in the budget for the
required capital investment on equipment. R&D then redesigns
its plans just to have the operations department inform them
that they do not have the specialized personnel capable of
producing the product. So then the plans go over to the human
resources department where it’s discovered there would need to
be a 4 month pipeline from recruiting, orienting, and training,
to place the right personnel in position. When products are
designed, they must simultaneously design the process. You
must have the capability to make the product in house. You
must set up your supply chain to support your product’s input
needs.
*
McGraw-Hill/Irwin
Strategies for New-Product IntroductionMarket Pull: “Make
what we can sell”Organize resources to fulfill customer
demandFood industry
Technology Push: “Sell what we can make”Develop superior
technologies and productsElectronics
Interfunctional View: most difficultCross-functional design
team – marketing, engineering, operations, financeChallenge to
gain cooperation of all functionsConsider existing and new
markets
Copyright © 2018 by The McGraw-Hill Companies, Inc. All
rights reserved.
3-*
Copyright © 2018 by The McGraw-Hill Companies, Inc. All
rights reserved.
Product design follows from the development of a business
strategy. The business strategy will include a value proposition
that defines the target market, the differentiation of your
product, and why the customer should buy from you. This is the
starting point for designing a new product. These new-product
designs should reflect the business strategy. There are three
different ways to introduce new products. These approaches are
called market pull, technology push, and interfunctional view.
*
McGraw-Hill/Irwin
3-*
Not only is there a wall that blocks communication, there is also
a language barrier. Not all departments speak the same business
language. There’s the left-brain, right-brain theory. The theory
is that people are either left-brained or right-brained, meaning
that one side of their brain is dominant. If you’re mostly
analytical and methodical in your thinking, you’re said to be
left-brained. If you tend to be more creative or artistic, you’re
thought to be right-brained.
*
McGraw-Hill/Irwin
New Product Development ProcessConcept DevelopmentIdea
generation and evaluation of alternative ideasProduct
DesignDesign of the physical productDesign of the production
processPilot Production/TestingTesting production prototypes
(e.g., 3D printing)Finalizing production processFinalizing
‘information package’ specifying product and process design
details
Copyright © 2018 by The McGraw-Hill Companies, Inc. All
rights reserved.
3-*
Copyright © 2018 by The McGraw-Hill Companies, Inc. All
rights reserved.
Most firms have an organized new-product development (NPD)
process that follows specific phases or prescribed steps. The
typical phases followed by firms in developing new products are
concept development where idea generation and the evaluation
of alternative ideas for the new product are defined to meet
specific market needs. Product design is the next phase
concerned with designing the physical new product. At the end
of this product design phase the company has a set of product
specifications and digital images or engineering drawings
specified in sufficient detail that production prototypes can be
built and tested. In the third phase, products require testing of
production prototypes before they are put into production.
*
McGraw-Hill/Irwin
Cross-Functional Product DesignSequential approachFunctions
(marketing, engineering, operations) work independently before
passing work to next step. This is the ‘over the wall’
approach.Often results in misalignment of market needs, design,
and production process.Concurrent approach Also called
concurrent engineering.Functions cooperate, work together over
the same time frame.Cross-functional teams.Not always “best”
approach (e.g. high uncertainty of market or technology).
Copyright © 2018 by The McGraw-Hill Companies, Inc. All
rights reserved.
3-*
Copyright © 2018 by The McGraw-Hill Companies, Inc. All
rights reserved.
The “over the wall” approach to product design is riddled with
constant rework, redesign, and waste of scarce resources. In the
concurrent approach, all functions are involved from the
beginning, frequently by forming NPD teams.
*
McGraw-Hill/Irwin
Supply Chain Collaboration
Relationships with CustomersAsk right questionsAlign
incentives to share knowledgeCreate collaborative technology
platformInclude as advisors to design team
Copyright © 2018 by The McGraw-Hill Companies, Inc. All
rights reserved.
3-*
Copyright © 2018 by The McGraw-Hill Companies, Inc. All
rights reserved.
Just as internal collaboration is important, so is external
collaboration with supply chain customers and suppliers. While
relationships with customers and suppliers often are established
in new-product development, collaboration is something
different, requiring actual participation in the design process.
Remember, if customers determine value a company must value
its customer relationships.
*
McGraw-Hill/Irwin
Supply Chain Collaboration
Criteria for Relationships with SuppliersTechnical
expertiseCapabilities – cost, time, quality targetsCapacity
availabilityLow risk
Copyright © 2018 by The McGraw-Hill Companies, Inc. All
rights reserved.
3-*
Copyright © 2018 by The McGraw-Hill Companies, Inc. All
rights reserved.
Suppliers can be asked to join the NPD team or to provide input
at critical points in the design process. Imagine a company
designing a product simply to discover there are no suppliers
capable of producing parts needed because they lack the
capability in regards to labor cost, equipment cost (capital),
throughput time, or expertise needed to producing a quality
product.
*
McGraw-Hill/Irwin
Quality Function Deployment (QFD)“House of Quality”Tool for
interfunctional cooperationCustomer Attributes “Voice of the
Customer”Engineering Characteristics “Voice of the
Engineer”Helps identify tradeoffsCan include target values and
competitive comparison
Copyright © 2018 by The McGraw-Hill Companies, Inc. All
rights reserved.
3-*
Copyright © 2018 by The McGraw-Hill Companies, Inc. All
rights reserved.
Quality function deployment (QFD) is a tool for linking
customer requirements as defined by the customer to technical
specifications. QFD is very useful in translating the ordinary
language obtained from the customers to technical requirements
understood by engineers. It also facilitates interfunctional
cooperation between marketing, engineering, and
manufacturing. A customer’s use of terms like “light weight”
can be translated by the engineering department as needing to
qualify the use of different metals like aluminum, titanium, or
carbon fiber.
*
McGraw-Hill/Irwin
House of Quality (QFD)
3-*
When using QFD, the company identifies various customer
attributes. Each of these attributes can be met by one or more
engineering characteristics of the product. By using the matrix
shown here in Figure 3.4, the customer attributes on the left
side of the matrix can be related to the engineering
characteristics on the top of the matrix. When the matrix, is
completed, it is called the “house of quality.”
*
McGraw-Hill/Irwin
Modular DesignAllows greater variety through ‘mixing and
matching’ modules
Design, develop, and manage basic product components
(modules) to use in multiple products
Controls costs while maintaining customer choice
Small number of components enables large number of
combinations, e.g., Dell notebooks, IKEA cabinets
Copyright © 2018 by The McGraw-Hill Companies, Inc. All
rights reserved.
3-*
Copyright © 2018 by The McGraw-Hill Companies, Inc. All
rights reserved.
Remember the saying that “time is money.” The faster we can
produce a product, the less time we waste, and the more
efficient we become. Also remember the “cookie cutter”
concept that the more we can standardize a product, again, the
less time we waste and, equally, more efficient we become.
Usually products are designed one at a time without much
regard for commonality of parts or modular properties that can
aid production and still meet customer needs. Modular design
makes it possible to have relatively high product variety and
low component variety at the same time. The core idea is to
develop a series of basic product components, or modules, that
can be assembled into a large number of different products. To
the customer, it appears there are a great number of different
products. To operations, there are only a limited number of
basic components and processes. Modular design is a
prerequisite to mass customization. Also note that limiting the
number of components in your raw materials inventory reduces
ordering cost, limits touches, lowers transportation and holding
costs. All leading to increased productivity while reducing
expenses.
*
McGraw-Hill/Irwin
Modular DesignVolkswagen A5/A5+ PlatformAudi A1Skoda
RapidVW SantanaVW JettaVW VentoVW Polo
Chrysler LX PlatformChrysler 300Dodge ChargerDodge
Magnum wagonLancia Thema (Italian)
Copyright © 2018 by The McGraw-Hill Companies, Inc. All
rights reserved.
3-*
Copyright © 2018 by The McGraw-Hill Companies, Inc. All
rights reserved.
Here are examples of modular components that are used by auto
manufacturers. Common components are used to build multiple
automobile models.
*
McGraw-Hill/Irwin
Chapter 3 SummaryLO 3.1 Compare the three strategies for new
product introduction.LO 3.2 Describe the three phases of new-
product development.LO 3.3 Evaluate how concurrent
engineering deals with misalignment.LO 3.4 Describe the
criteria that should be used for supplier selection.LO 3.5
Evaluate an example of Quality Function Deployment. LO 3.6
Explain the benefits of modular design.
Copyright © 2018 by The McGraw-Hill Companies, Inc. All
rights reserved.
3-*
Copyright © 2018 by The McGraw-Hill Companies, Inc. All
rights reserved.
2-*
Chapter 2:
Operations and Supply Chain Strategy
McGraw-Hill Education
Copyright © 2018 by The McGraw-Hill Companies, Inc. All
rights reserved.
Copyright © 2018 by The McGraw-Hill Companies, Inc. All
rights reserved.
*
There is an increasing awareness that operations and the supply
chain contribute to the global competitive positon of a business
and are not merely making a firm’s products or services.
Operations should be fully connected to the business strategy
and decisions should fulfill the needs of the business and add
competitive advantage to the firm.
2-*
Chapter 2 Learning Objectives
LO 2.1 Define operations strategy.
LO 2.2 Describe the elements of operations strategy and
alignment with business and other functional strategies.
LO 2.3 Differentiate the ways to compete with operations
objectives.
LO 2.4 Compare product imitator and innovator strategies.LO
2.5 Provide examples of a distinctive competence for
operations.LO 2.6 Explain the nature of global operations and
supply chains.LO 2.7 Describe two types of supply chain
strategies.LO 2.8 Illustrate how operations can become more
environmentally sustainable.
Copyright © 2018 by The McGraw-Hill Companies, Inc. All
rights reserved.
Copyright © 2018 by The McGraw-Hill Companies, Inc. All
rights reserved.
Here are our Learning Objectives for this course. Between
these videos, the textbook, supplemental readings, assignments
and Discussion Boards, you will end the course with some new
skills and many new insights.
*
2-*
Operations Strategy
“A consistent pattern of business decisions for operations
and the associated supply chain …
… that are linked to the business strategy and other
functional strategies, leading to a competitive advantage for the
firm.”
Copyright © 2018 by The McGraw-Hill Companies, Inc. All
rights reserved.
Copyright © 2018 by The McGraw-Hill Companies, Inc. All
rights reserved.
Dell Inc.: Using the supply chain to compete
The personal computer (PC) sector was still in its infancy when,
in 1983, medical student Michael Dell began buying up
remainder stocks of outdated IBM PCs from local retailers.
Dell upgraded the machines in his college dorm, then sold them
at bargain prices to eager customers. By 1985 Dell Computer
had switched from upgrading old IMBs to building its own
machines. The machines themselves were technologically
unremarkable, but it was the way in which they were sold -
directly to the customer - that gave the upstart company a
unique advantage over established PC makers.
While industry leaders vied to introduce PCs with ever faster
and more impressive technology, they gave little consideration
to the mundane business of supply chain management. The
computers they produced were invariably made-to-forecast and
because of the way they were sold - through shops and resellers
- were then destined to land on warehouse and shop shelves
(inventory is money sitting on a shelf) for an average of two
months before being purchased. Remember, inventory turnover
is how companies turn to profit.
Dell's own operations continued to be constantly re-examined
(continuous improvement) to squeeze every possible moment of
non-value adding time out of procurement and assemble
processes. As a result, the total number of interventions or
"touches" involved in the manufacture of a Dell PC had been
reduced to 60, against an industry average of around 130. The
simplification is facilitated in part by Dell's focus on common
components.
The supply chain is the network that links together the work and
output of many different organizations. The purchasing function
is responsible for finding other organizations to serve as
sources and then buying the material and service inputs for the
transformation process of the organization. The logistics
function, in contrast, is typically responsible for the actual
movement of goods and/or services across organizations.
On the inbound side too Dell works to minimize inventory and
increase return on capital employed. Many components are not
ordered from a supplier before Dell receives a customer order.
To achieve such levels of co-operation and integration, Dell
progressively reduced its number or suppliers from 204
companies in 1992 to just 47 by 1997. By around 2003, 20
suppliers provided 75% of Dell's direct material purchase. "We
have no inventory and no warehouses in any of our factories.
Instead we're able to pull material into our factories based on
actual orders..." (Dick Hunter, Dell VP Americas Manufacturing
Operations).
Bulky finished sub-assemblies, such as monitors and speakers,
are treated differently. Instead of shipping them to Dell's
factories, they were sent directly to the customer from the
supplier's hub (located close to the market rather than close to
Dell's factory), saving Dell approximately $30 per item in
freight costs (now multiply that figure by millions of products
sold each year).
*
2-*
Operations
Strategy
Process
(Figure 2.1)
Mission
Objectives
(cost, quality, flexibility, delivery)
Strategic Decisions (process, quality system,
capacity, inventory, and supply chain)
Distinctive
Competence
Operations Strategy
Functional strategies in
marketing, finance,
engineering,
human resources,
and
information systems
Corporate strategy
The corporate strategy defines the business that the company is
pursuing. The Walt Disney Corporation considers itself in the
business of “making people happy.” The business strategy
follows from the corporate strategy and defines how each
particular business will compete within their industry. Michael
Porter describes three generic business strategies:
differentiation, low cost, and focus. Differentiation is
associated with a unique and frequently innovative product or
service, while low cost is pursued in commodity markets where
the products or services ae imitative. Focus refers to the
geographical or product portfolio being narrow or broad in
nature. Focus can be combined with either a differentiation or
low-cost strategy.
Every operation should have a mission that is connected to the
business strategy and is coordinated with the other functional
strategy. For example, if the business strategy is differentiation
through innovative products, the operations mission should
emphasize new-product introduction and flexibility to adapt
products to changing market needs. Other business strategies
lead to other operations missions, such as low cost or fast
delivery. The operations mission is thus derived from the
particular business strategy selected by the business unit.
At McDonald’s, the operations mission is to provide food and
service quickly to customers with consistent quality and low
cost in a clean and friendly environment. How then does
McDonald’s turn its mission into reality? By setting operations
objectives derived from the operations mission in quantitative
and measurable terms.
*
2-*
Operations Strategic ObjectivesCost – resources usedQuality –
conformance to customer expectationsDelivery – quickly and on
timeFlexibility – ability to rapidly change operations
Copyright © 2018 by The McGraw-Hill Companies, Inc. All
rights reserved.
Copyright © 2018 by The McGraw-Hill Companies, Inc. All
rights reserved.
How does a firm use these objectives to gain a competitive
advantage?
Remember Dell re-examines its operations to squeeze every
possible moment of non-value adding time out of procurement
and assemble processes. As a result, the total number of
"touches" involved in the manufacture of a Dell PC had been
reduced to 60, against an industry average of around 130.
Simply put, less touches equals less time and fewer employees
that results in saved costs. The simplification is facilitated in
part by Dell's focus on common components. By using a
modular design (to be discussed in a later chapter) of common
components, Dell was able to reduce its inventory of raw
materials and still offer a large variety of finished goods.
The strategic objectives we seek to exploit (cost, quality,
delivery, and flexibility) can be achieved by incorporating the
right strategy into our operations. By reducing the amount of
touches, we pay less employees. If we were to redesign a tool
box that uses 24 parts (nuts, bolts, sides, handle, etc…) down to
2 parts (handle that snaps into a molded box), reducing the
number of parts used to make the final product would reduce
our overall ordering, transporting, holding, and carrying cost
within the supply pipeline and work in progress.
*
2-*
Distinctive CompetenceThis operations capability is something
an organization does better than any competing organization
that adds value for the customer.
Examples: patents, proprietary technology, operations
innovations
Copyright © 2018 by The McGraw-Hill Companies, Inc. All
rights reserved.
Copyright © 2018 by The McGraw-Hill Companies, Inc. All
rights reserved.
All operations should have a distinctive competence that
differentiates it from the competitors. The distinctive
competence is something that operations are difficult to imitate.
Walmart has a mission to be the low-cost retailer. To achieve
this mission it has developed a distinctive competence in cross-
docking aimed at lowering the costs of shipping. Using cross-
docking, goods from supplier’s trucks are transferred across the
loading dock to waiting Walmart trucks and delivered to the
stores without entering the warehouse.
*
2-*
Linking Operations to Business StrategiesBusiness strategy
alternativesProduct ImitatorOperations must focus on keeping
costs low. Product InnovatorOperations must maintain
flexibility in processes, labor and suppliers. Customer
perspectiveOrder Qualifiers: objectives customers consider in
the product/serviceOrder Winners: objectives that cause
customer to choose a particular product/service
Copyright © 2018 by The McGraw-Hill Companies, Inc. All
rights reserved.
Copyright © 2018 by The McGraw-Hill Companies, Inc. All
rights reserved.
Let’s discuss how we can use the four operations objectives
(cost, quality, delivery, and flexibility) that we discussed earlier
to describe different ways to compete through operations. Most
firms choose one or a few objectives to focus on, so that the
strategic decisions made in operations can be aligned with and
support these focused objectives.
Not only should objectives be linked to an operations mission,
operations strategic decisions should be linked to business
strategy and to marketing and financial strategies as well.
Table 2.3 of your text shows two diametrically opposite
business strategies that can be selected and the resulting
functional strategies.
The first one is the product imitator (low-cost) business
strategy, which is typical of a mature, price-sensitive market
with a standardized product or service. When you see the word
“standardized,” you must automatically think of a cookie-cutter
mold. Products are all identically made with the same mold,
increased production rate, little to no downtime, resulting in a
low unit cost.
The second business strategy is the product innovator and new-
product introduction. This strategy typically is used in emerging
and possible growing markets where advantage can be gained by
bringing to market superior-quality products in a short amount
of time. Price is not the dominant form of competition, and
higher prices are charged, thereby putting a lower emphasis on
costs.
When asked to evaluate operations, you must immediately ask,
what is the business strategy, mission, and objective of
operations. The product imitator strategy should focus on mass
distribution, repeat sales, a national sales force, and
maximization of sales opportunities. In contrast, the product
innovator strategy, you should focus on selective distribution,
new-market development, product design, and perhaps sales
through agents.
*
2-*
Example:
McDonald’s Operations StrategyMission: fast product/service,
consistent quality, low cost, clean/friendly environment
Operations Objectives: cost, quality, service
Strategic Decisions: process, quality, capacity, inventory,
supply chain
Distinctive Competence: today: continuous improvement of the
transformation system, and brand (originally: unique
service/supply chain)
Copyright © 2018 by The McGraw-Hill Companies, Inc. All
rights reserved.
Copyright © 2018 by The McGraw-Hill Companies, Inc. All
rights reserved.
McDonald’s successfully links its mission statement directly
into its operations objectives, then makes strategic decisions in
the five operations decisions areas:
Process: Specialized equipment and work flows ensure meals
are delivered to customers quickly.
Quality: More than 2,000 quality, food safety, and inspections
monitor food as it moves from farms to suppliers to restaurants.
Capacity: Restaurant capacity is carefully designed to control
customers waiting times.
Inventory: Just-in-time replenishment ensures food and
packaging are available when needed. Food and packaging are
highly standardized across restaurants.
Supply Chain: Each restaurant is connected to its supply chain
for fast replenishment. The supply chain is designed for
frequent deliveries and to avoid stockouts.
*
2-*
Global Operations and Supply Chains“Traditional” (multi-
country, multi-strategy) versus “Global” (single-strategy)
firm.Characteristics of the “Global Corporation” differ from the
traditional company.Rethink the supply chain (product design,
process design, location, workforce policies).
Copyright © 2018 by The McGraw-Hill Companies, Inc. All
rights reserved.
Copyright © 2018 by The McGraw-Hill Companies, Inc. All
rights reserved.
When operating in global markets, a company needs to be
organized properly to produce and market its products. As a
result, the global corporation has emerged with the following
characteristics. Facilities and plants are located on a worldwide
basis, not a country by country.
*
2-*
Supply Chain StrategyTo achieve competitive advantage for
entire supply chain, rather than individual entities.
Two supply chain strategies:Imitative Products (e.g.
commodities)Predictable demandEfficient, low-cost supply
chainInnovative Products (e.g. new technologies)Unpredictable
demandFlexible, fast supply chain
Firms design supply chain for each product/service or group of
products/servicesAvoid “one size fits all” strategy.
Copyright © 2018 by The McGraw-Hill Companies, Inc. All
rights reserved.
Copyright © 2018 by The McGraw-Hill Companies, Inc. All
rights reserved.
Supply chain strategy includes consideration of customers,
suppliers, sourcing, and logistics in addition to operations.
There is a focus on flows of inventory, materials, and
information throughout the supply chain from the suppliers to
the ultimate customer. A supply chain is the network of
manufacturing and service operations that supply one another
from raw materials through manufacturing to the ultimate
customer.
*
2-*
Environment & Sustainable Operations
Operations Sustainability:
* minimizing or eliminating environmental impact of
operations
* social and financial viability of the firm for future
generations
Operations ‘greening’ may include:Eliminating air, water,
landfill pollutionReducing energy consumptionMinimizing
transportation and total carbon footprintWorking with suppliers
to use recyclable and biodegradable packagingIncorporating
product reuse, end-of-life return, recycling
Copyright © 2018 by The McGraw-Hill Companies, Inc. All
rights reserved.
Copyright © 2018 by The McGraw-Hill Companies, Inc. All
rights reserved.
Sustainable operations have become an increasingly important
part of operations and supply chain objectives and strategy. It
refers to minimizing or eliminating the environmental impact of
operations along with social and financial viability of the firm
for future generations.
*
2-*
Chapter 2 Summary
LO 2.1 Define operations strategy.
LO 2.2 Describe the elements of operations strategy and
alignment with business and other functional strategies.
LO 2.3 Differentiate the ways to compete with operations
objectives.
LO 2.4 Compare product imitator and innovator strategies.LO
2.5 Provide examples of a distinctive competence for
operations.LO 2.6 Explain the nature of global operations and
supply chains.LO 2.7 Describe two types of supply chain
strategies.LO 2.8 Illustrate how operations can become more
environmentally sustainable.
Copyright © 2018 by The McGraw-Hill Companies, Inc. All
rights reserved.
Copyright © 2018 by The McGraw-Hill Companies, Inc. All
rights reserved.
1-*
Chapter 1:
The Operations Function
Copyright © 2018 by The McGraw-Hill Companies, Inc. All
rights reserved.
Copyright © 2018 by The McGraw-Hill Companies, Inc. All
rights reserved.
*
1-*
Chapter 1 Learning ObjectivesLO 1.1 Define operations
management.LO 1.2 Describe the five main decisions made by
operations and supply chain managers.LO 1.3 Explain the
nature of cross-functional decision making with operations.LO
1.4 Define typical inputs and outputs of an operations
transformation system.LO 1.5 Identify contemporary challenges
facing operations and supply chain managers.
Copyright © 2018 by The McGraw-Hill Companies, Inc. All
rights reserved.
Copyright © 2018 by The McGraw-Hill Companies, Inc. All
rights reserved.
1-*
Why Study Operations Management?Cross-functional nature of
decisionsOperations is a major function in every
organizationPrinciples of process thinking can be applied across
the organizationOperations Management is an interesting and
challenging field of study
Copyright © 2018 by The McGraw-Hill Companies, Inc. All
rights reserved.
Copyright © 2018 by The McGraw-Hill Companies, Inc. All
rights reserved.
All organizations thrive by producing and delivering a good or a
service deemed to be of value to customers. Value is the
tangible and intangible benefits that customers derive from
consuming a good or service at a price they are willing to pay.
I often say McDonald’s makes the best hamburger in the fast
food industry and students are fast to disagree because they
immediately assume that I am focusing my statement only on
“taste.” I immediately expand my previous statement by adding
that McDonald’s does not sell customers a tasty hamburger,
they sell a fast service, consistent quality, and low priced
hamburger. It’s those three characteristics that customers
determine are of “value” to them, more than the taste of the
hamburger.
Cross-functional teams (subject matter experts from across the
organization’s departments) help define and set metrics to each
value. The operations function of McDonald’s turns “fast
service” into a series of processes (steps 1, 2, and 3) when
converting their inputs into outputs that can be delivered to
their customers in a timely manner that is of value. As we
progress through this course we will discuss value adding and
non-value adding steps. Learn now that customers will pay for
value added activities. Non-value adding activities are
considered wasteful and non-efficient.
*
1-*
Definition of Operations Management
Operations management focuses on decisions for the production
and delivery of the firm’s products and services.
Copyright © 2018 by The McGraw-Hill Companies, Inc. All
rights reserved.
Copyright © 2018 by The McGraw-Hill Companies, Inc. All
rights reserved.
A success business plan turns $1.50 into $5.00 by converting
inputs like raw materials sourced from suppliers into a finished
good or service. The conversion of the input to the output is the
cost ($1.50) of doing business and can be found on a company’s
profit and loss statement under “expenses.” The $5.00
(revenue) is the sale price a customer is willing to pay for the
good or service. The metrics used in the production process can
be seen as standards or specifications operations managers
focus on to decide how customer’s value needs will be met.
*
1-*
Three aspects of Operations Management
Decisions:
The operations manager must decide:
Process, quality, capacity, inventory, and supply chain
Function:
Major functional areas in organizations:
Operations, marketing, finance
Process:
Planning and controlling the transformation process and its
interfaces (internal/external)
Copyright © 2018 by The McGraw-Hill Companies, Inc. All
rights reserved.
Copyright © 2018 by The McGraw-Hill Companies, Inc. All
rights reserved.
*
When you read the word “process” I want you to think “steps.”
What steps (1, 2, 3, etc…) are needed to complete the process.
Will the company produce 100% of its product or outsource
90% of the production and assemble raw materials into a
finished product to complete the remaining 10% of production.
What are the quality standards (or metrics) that will be set? If
the goal is to produce only what you can sell (over and under
production is wasteful and non-value adding activities that
increase cost under expenses on the PNL) so determining the
right capacity is critical to lean manufacturing. I call inventory
“money sitting on a shelf.” Remember you spend a $1.50 to
make $5.00, but until the product is sold or the service is
delivered, inventory is $1.50 sitting on a shelf waiting to
become revenue. Inventory turner is critical to the company’s
success. When you convert $1.50 into $5.00, you earn a gross
profit of $3.50. Your company’s goal should be to convert
inputs into outputs (inventory turnover) as many times as
possible to realize greater profits. The supply chain is the
network of suppliers, subcontractors, distributors, and retailers
used within your conversion or transformation processes. Every
organization across the supply chain network will plan and
control the flow of materials, money, and information to and
from each other.
1-*
Operations as a Process (Figure 1.2)
Transformation
(Conversion)
Process
Copyright © 2018 by The McGraw-Hill Companies, Inc. All
rights reserved.
Energy
Materials
Labor
Capital
Information
Goods or
Services
Feedback information for
control of process inputs
and process technology
Copyright © 2018 by The McGraw-Hill Companies, Inc. All
rights reserved.
Think of two separate companies that make the same product.
Now think of their internal operations. Do these two companies
convert their raw materials into a finished good using the same
procedures? If you were to walk into a taco shop, the standard
ordering, making, and delivering processes might be different
than that of Chipotle’s fast food chain. In standard taco shop,
you walk up to an order taking employee who takes your order
first and charges you next. The order is then sent to the kitchen
to fulfill your order request. The kitchen has the option of
making your order from scratch before delivering it to your
table or calling out your order number for pick up. At
Chipotle’s, you enter on one side of the counter, place your
order directly to the employee who will start an assembly
process. This assembly process will follow a linear flow of
adding pre-determined ingredients to complete the finished
good (output).
*
1-*
Contemporary Operations ChallengesService and Manufacturing
(differences and implications)Customer-Directed Operations
(“voice of the customer”)Integration of Decisions Internally and
ExternallyEnvironmental SustainabilityGlobalization of
Operations and the Supply Chain
Copyright © 2018 by The McGraw-Hill Companies, Inc. All
rights reserved.
Copyright © 2018 by The McGraw-Hill Companies, Inc. All
rights reserved.
As previously discussed, because customers determine value,
time over taste, the metrics used in the operations process must
focus on delivering a finished good to the customer in a timely
manner. If the customer values costs, then the metrics or
standards used will normally have a quality tradeoff. Because
you want to “hear” what the customer is saying to determine
what metrics or standards to set, it’s important that cross-
functional teams that include marketing personnel or SMEs use
the “voice of the customer” as their bases in the decision-
making process. These decisions will be spread over the entire
supply chain network, both externally and internally to meet
delivery expectations. The external network can cover local,
regional, national, and now global environments and must strive
to minimize the negative impacts on our ecosystem and not
endangering the ability to meet the needs of future generations.
*
1-*
Chapter 1 Summary
LO 1.1 Define operations management.LO 1.2 Describe the five
main decisions made by operations and supply chain
managers.LO 1.3 Explain the nature of cross-functional
decision making with operations.LO 1.4 Define typical inputs
and outputs of an operations transformation system.LO 1.5
Identify contemporary challenges facing operations and supply
chain managers.
Copyright © 2018 by The McGraw-Hill Companies, Inc. All
rights reserved.
Copyright © 2018 by The McGraw-Hill Companies, Inc. All
rights reserved.

More Related Content

Similar to Chapter 7Lean Thinking and Lean SystemsMcGraw-Hill Ed.docx

Just In Time
Just In TimeJust In Time
Just In Timedvyvjy
 
just in time and lean manufacturing
just in time and lean manufacturingjust in time and lean manufacturing
just in time and lean manufacturingAkhil Bhatia
 
Lean production and jit
Lean production and jitLean production and jit
Lean production and jitKusum Parmar
 
15 lean mfg toyota production system (1)
15 lean mfg toyota production system (1)15 lean mfg toyota production system (1)
15 lean mfg toyota production system (1)Ashima Kandari
 
Process Selection and Facility LayoutChapter 6Copyright ©201
Process Selection and Facility LayoutChapter 6Copyright ©201Process Selection and Facility LayoutChapter 6Copyright ©201
Process Selection and Facility LayoutChapter 6Copyright ©201DaliaCulbertson719
 
Just in Time System: A Study and Review
Just in Time System: A Study and ReviewJust in Time System: A Study and Review
Just in Time System: A Study and Reviewvivatechijri
 
A Complete Model of a Business Enterprise in an EtO and PLM environment
A Complete Model of a Business Enterprise in an EtO and PLM environmentA Complete Model of a Business Enterprise in an EtO and PLM environment
A Complete Model of a Business Enterprise in an EtO and PLM environmentFrank Steeneken
 
Just in time (jit) and lean production
Just in time (jit) and lean productionJust in time (jit) and lean production
Just in time (jit) and lean productionهشام جملة
 
IRJET- Implementing Lean Manufacturing Principle in Fabrication Process- A...
IRJET- 	  Implementing Lean Manufacturing Principle in Fabrication Process- A...IRJET- 	  Implementing Lean Manufacturing Principle in Fabrication Process- A...
IRJET- Implementing Lean Manufacturing Principle in Fabrication Process- A...IRJET Journal
 
Danone-a practitioner approach to packaging line productivity by Mathieu Lora...
Danone-a practitioner approach to packaging line productivity by Mathieu Lora...Danone-a practitioner approach to packaging line productivity by Mathieu Lora...
Danone-a practitioner approach to packaging line productivity by Mathieu Lora...Monique Watkins
 
Operations Int 2
Operations Int 2Operations Int 2
Operations Int 2Marcus9000
 
Supply Chain Management Assignment on Lean manufacturing wit real life Exampl...
Supply Chain Management Assignment on Lean manufacturing wit real life Exampl...Supply Chain Management Assignment on Lean manufacturing wit real life Exampl...
Supply Chain Management Assignment on Lean manufacturing wit real life Exampl...Yamini Kahaliya
 
just in time approace literature view
just in time approace literature viewjust in time approace literature view
just in time approace literature viewAnqur Rauth
 
Manufacturing Lead Time Reduction in Monoblock (SWJ) Pump Industry [irjet-v4 ...
Manufacturing Lead Time Reduction in Monoblock (SWJ) Pump Industry [irjet-v4 ...Manufacturing Lead Time Reduction in Monoblock (SWJ) Pump Industry [irjet-v4 ...
Manufacturing Lead Time Reduction in Monoblock (SWJ) Pump Industry [irjet-v4 ...PERUMALSAMY M
 
Manufacturing Lead Time Reduction in Monoblock (SWJ) Pump Industry
Manufacturing Lead Time Reduction in Monoblock (SWJ) Pump IndustryManufacturing Lead Time Reduction in Monoblock (SWJ) Pump Industry
Manufacturing Lead Time Reduction in Monoblock (SWJ) Pump IndustryIRJET Journal
 
Case Study U.S. Strollers
Case Study U.S. StrollersCase Study U.S. Strollers
Case Study U.S. StrollersTiffany Graham
 
just in time approace
just in  time approacejust in  time approace
just in time approaceAnqur Rauth
 

Similar to Chapter 7Lean Thinking and Lean SystemsMcGraw-Hill Ed.docx (20)

Just In Time
Just In TimeJust In Time
Just In Time
 
just in time and lean manufacturing
just in time and lean manufacturingjust in time and lean manufacturing
just in time and lean manufacturing
 
Lean production and jit
Lean production and jitLean production and jit
Lean production and jit
 
15 lean mfg toyota production system (1)
15 lean mfg toyota production system (1)15 lean mfg toyota production system (1)
15 lean mfg toyota production system (1)
 
Lean manufacturing
Lean manufacturingLean manufacturing
Lean manufacturing
 
Process Selection and Facility LayoutChapter 6Copyright ©201
Process Selection and Facility LayoutChapter 6Copyright ©201Process Selection and Facility LayoutChapter 6Copyright ©201
Process Selection and Facility LayoutChapter 6Copyright ©201
 
Just in time
Just in timeJust in time
Just in time
 
Just in Time System: A Study and Review
Just in Time System: A Study and ReviewJust in Time System: A Study and Review
Just in Time System: A Study and Review
 
A Complete Model of a Business Enterprise in an EtO and PLM environment
A Complete Model of a Business Enterprise in an EtO and PLM environmentA Complete Model of a Business Enterprise in an EtO and PLM environment
A Complete Model of a Business Enterprise in an EtO and PLM environment
 
Just in time (jit) and lean production
Just in time (jit) and lean productionJust in time (jit) and lean production
Just in time (jit) and lean production
 
IRJET- Implementing Lean Manufacturing Principle in Fabrication Process- A...
IRJET- 	  Implementing Lean Manufacturing Principle in Fabrication Process- A...IRJET- 	  Implementing Lean Manufacturing Principle in Fabrication Process- A...
IRJET- Implementing Lean Manufacturing Principle in Fabrication Process- A...
 
PPT ON Just in time technique (JIT)
PPT ON Just in time technique (JIT)PPT ON Just in time technique (JIT)
PPT ON Just in time technique (JIT)
 
Danone-a practitioner approach to packaging line productivity by Mathieu Lora...
Danone-a practitioner approach to packaging line productivity by Mathieu Lora...Danone-a practitioner approach to packaging line productivity by Mathieu Lora...
Danone-a practitioner approach to packaging line productivity by Mathieu Lora...
 
Operations Int 2
Operations Int 2Operations Int 2
Operations Int 2
 
Supply Chain Management Assignment on Lean manufacturing wit real life Exampl...
Supply Chain Management Assignment on Lean manufacturing wit real life Exampl...Supply Chain Management Assignment on Lean manufacturing wit real life Exampl...
Supply Chain Management Assignment on Lean manufacturing wit real life Exampl...
 
just in time approace literature view
just in time approace literature viewjust in time approace literature view
just in time approace literature view
 
Manufacturing Lead Time Reduction in Monoblock (SWJ) Pump Industry [irjet-v4 ...
Manufacturing Lead Time Reduction in Monoblock (SWJ) Pump Industry [irjet-v4 ...Manufacturing Lead Time Reduction in Monoblock (SWJ) Pump Industry [irjet-v4 ...
Manufacturing Lead Time Reduction in Monoblock (SWJ) Pump Industry [irjet-v4 ...
 
Manufacturing Lead Time Reduction in Monoblock (SWJ) Pump Industry
Manufacturing Lead Time Reduction in Monoblock (SWJ) Pump IndustryManufacturing Lead Time Reduction in Monoblock (SWJ) Pump Industry
Manufacturing Lead Time Reduction in Monoblock (SWJ) Pump Industry
 
Case Study U.S. Strollers
Case Study U.S. StrollersCase Study U.S. Strollers
Case Study U.S. Strollers
 
just in time approace
just in  time approacejust in  time approace
just in time approace
 

More from robertad6

Chapter 8 Religion and the Restoration of Health in Afric.docx
Chapter 8  Religion and the Restoration of Health in Afric.docxChapter 8  Religion and the Restoration of Health in Afric.docx
Chapter 8 Religion and the Restoration of Health in Afric.docxrobertad6
 
Chapter 8 - Children of alcoholics often display characteristic tr.docx
Chapter 8 - Children of alcoholics often display characteristic tr.docxChapter 8 - Children of alcoholics often display characteristic tr.docx
Chapter 8 - Children of alcoholics often display characteristic tr.docxrobertad6
 
Chapter 8 - Review the Siemens AG case study.  Note the importan.docx
Chapter 8 - Review the Siemens AG case study.  Note the importan.docxChapter 8 - Review the Siemens AG case study.  Note the importan.docx
Chapter 8 - Review the Siemens AG case study.  Note the importan.docxrobertad6
 
Chapter 7Victimology and Patterns of VictimizationThe a.docx
Chapter 7Victimology and Patterns of VictimizationThe a.docxChapter 7Victimology and Patterns of VictimizationThe a.docx
Chapter 7Victimology and Patterns of VictimizationThe a.docxrobertad6
 
Chapter 7Thinking and IntelligenceFigure 7.1 Thinking .docx
Chapter 7Thinking and IntelligenceFigure 7.1 Thinking .docxChapter 7Thinking and IntelligenceFigure 7.1 Thinking .docx
Chapter 7Thinking and IntelligenceFigure 7.1 Thinking .docxrobertad6
 
Chapter 7 2. How does a false positive alarm differ from a f.docx
Chapter 7 2. How does a false positive alarm differ from a f.docxChapter 7 2. How does a false positive alarm differ from a f.docx
Chapter 7 2. How does a false positive alarm differ from a f.docxrobertad6
 
Chapter 7 covers Corporate Information Security and Privacy Regu.docx
Chapter 7 covers Corporate Information Security and Privacy Regu.docxChapter 7 covers Corporate Information Security and Privacy Regu.docx
Chapter 7 covers Corporate Information Security and Privacy Regu.docxrobertad6
 
Chapter 7The Problem of EvilOf all the objections to theism pr.docx
Chapter 7The Problem of EvilOf all the objections to theism pr.docxChapter 7The Problem of EvilOf all the objections to theism pr.docx
Chapter 7The Problem of EvilOf all the objections to theism pr.docxrobertad6
 
Chapter 7Social Networking,Engagement, andSocial Metrics.docx
Chapter 7Social Networking,Engagement, andSocial Metrics.docxChapter 7Social Networking,Engagement, andSocial Metrics.docx
Chapter 7Social Networking,Engagement, andSocial Metrics.docxrobertad6
 
CHAPTER 7The CPU and MemoryThe Architecture of Comp.docx
CHAPTER 7The CPU and MemoryThe Architecture of Comp.docxCHAPTER 7The CPU and MemoryThe Architecture of Comp.docx
CHAPTER 7The CPU and MemoryThe Architecture of Comp.docxrobertad6
 
Chapter 7QUESTION 1. Which of the following is defin.docx
Chapter 7QUESTION 1. Which of the following is defin.docxChapter 7QUESTION 1. Which of the following is defin.docx
Chapter 7QUESTION 1. Which of the following is defin.docxrobertad6
 
Chapter 7One pageAPA stylePlease comment on the followin.docx
Chapter 7One pageAPA stylePlease comment on the followin.docxChapter 7One pageAPA stylePlease comment on the followin.docx
Chapter 7One pageAPA stylePlease comment on the followin.docxrobertad6
 
CHAPTER 7Managing Financial OperationsRevenue cycle (bil.docx
CHAPTER 7Managing Financial OperationsRevenue cycle (bil.docxCHAPTER 7Managing Financial OperationsRevenue cycle (bil.docx
CHAPTER 7Managing Financial OperationsRevenue cycle (bil.docxrobertad6
 
CHAPTER 7Primate BehaviorWhat is Meant By Behavior.docx
CHAPTER 7Primate BehaviorWhat is Meant By Behavior.docxCHAPTER 7Primate BehaviorWhat is Meant By Behavior.docx
CHAPTER 7Primate BehaviorWhat is Meant By Behavior.docxrobertad6
 
Chapter 7Medical Care Production and Costs(c) 2012 Cengage.docx
Chapter 7Medical Care Production and Costs(c) 2012 Cengage.docxChapter 7Medical Care Production and Costs(c) 2012 Cengage.docx
Chapter 7Medical Care Production and Costs(c) 2012 Cengage.docxrobertad6
 
Chapter 7Evaluating HRD ProgramsWerner© 2017 Cengage Learn.docx
Chapter 7Evaluating HRD ProgramsWerner© 2017 Cengage Learn.docxChapter 7Evaluating HRD ProgramsWerner© 2017 Cengage Learn.docx
Chapter 7Evaluating HRD ProgramsWerner© 2017 Cengage Learn.docxrobertad6
 
CHAPTER 7INTEREST RATES AND BOND VALUATIONCopyright © 2019 M.docx
CHAPTER 7INTEREST RATES AND BOND VALUATIONCopyright © 2019 M.docxCHAPTER 7INTEREST RATES AND BOND VALUATIONCopyright © 2019 M.docx
CHAPTER 7INTEREST RATES AND BOND VALUATIONCopyright © 2019 M.docxrobertad6
 
CHAPTER 7FriendshipTHE NATURE OF FRIENDSHIPFRIENDSHIP ACROSS T.docx
CHAPTER 7FriendshipTHE NATURE OF FRIENDSHIPFRIENDSHIP ACROSS T.docxCHAPTER 7FriendshipTHE NATURE OF FRIENDSHIPFRIENDSHIP ACROSS T.docx
CHAPTER 7FriendshipTHE NATURE OF FRIENDSHIPFRIENDSHIP ACROSS T.docxrobertad6
 
Chapter 7Food, Nutrition & Obesity PolicyEyler, Chriqui, M.docx
Chapter 7Food, Nutrition & Obesity PolicyEyler, Chriqui, M.docxChapter 7Food, Nutrition & Obesity PolicyEyler, Chriqui, M.docx
Chapter 7Food, Nutrition & Obesity PolicyEyler, Chriqui, M.docxrobertad6
 
Chapter 7Evaluating and Controlling TechnologyBased.docx
Chapter 7Evaluating and Controlling TechnologyBased.docxChapter 7Evaluating and Controlling TechnologyBased.docx
Chapter 7Evaluating and Controlling TechnologyBased.docxrobertad6
 

More from robertad6 (20)

Chapter 8 Religion and the Restoration of Health in Afric.docx
Chapter 8  Religion and the Restoration of Health in Afric.docxChapter 8  Religion and the Restoration of Health in Afric.docx
Chapter 8 Religion and the Restoration of Health in Afric.docx
 
Chapter 8 - Children of alcoholics often display characteristic tr.docx
Chapter 8 - Children of alcoholics often display characteristic tr.docxChapter 8 - Children of alcoholics often display characteristic tr.docx
Chapter 8 - Children of alcoholics often display characteristic tr.docx
 
Chapter 8 - Review the Siemens AG case study.  Note the importan.docx
Chapter 8 - Review the Siemens AG case study.  Note the importan.docxChapter 8 - Review the Siemens AG case study.  Note the importan.docx
Chapter 8 - Review the Siemens AG case study.  Note the importan.docx
 
Chapter 7Victimology and Patterns of VictimizationThe a.docx
Chapter 7Victimology and Patterns of VictimizationThe a.docxChapter 7Victimology and Patterns of VictimizationThe a.docx
Chapter 7Victimology and Patterns of VictimizationThe a.docx
 
Chapter 7Thinking and IntelligenceFigure 7.1 Thinking .docx
Chapter 7Thinking and IntelligenceFigure 7.1 Thinking .docxChapter 7Thinking and IntelligenceFigure 7.1 Thinking .docx
Chapter 7Thinking and IntelligenceFigure 7.1 Thinking .docx
 
Chapter 7 2. How does a false positive alarm differ from a f.docx
Chapter 7 2. How does a false positive alarm differ from a f.docxChapter 7 2. How does a false positive alarm differ from a f.docx
Chapter 7 2. How does a false positive alarm differ from a f.docx
 
Chapter 7 covers Corporate Information Security and Privacy Regu.docx
Chapter 7 covers Corporate Information Security and Privacy Regu.docxChapter 7 covers Corporate Information Security and Privacy Regu.docx
Chapter 7 covers Corporate Information Security and Privacy Regu.docx
 
Chapter 7The Problem of EvilOf all the objections to theism pr.docx
Chapter 7The Problem of EvilOf all the objections to theism pr.docxChapter 7The Problem of EvilOf all the objections to theism pr.docx
Chapter 7The Problem of EvilOf all the objections to theism pr.docx
 
Chapter 7Social Networking,Engagement, andSocial Metrics.docx
Chapter 7Social Networking,Engagement, andSocial Metrics.docxChapter 7Social Networking,Engagement, andSocial Metrics.docx
Chapter 7Social Networking,Engagement, andSocial Metrics.docx
 
CHAPTER 7The CPU and MemoryThe Architecture of Comp.docx
CHAPTER 7The CPU and MemoryThe Architecture of Comp.docxCHAPTER 7The CPU and MemoryThe Architecture of Comp.docx
CHAPTER 7The CPU and MemoryThe Architecture of Comp.docx
 
Chapter 7QUESTION 1. Which of the following is defin.docx
Chapter 7QUESTION 1. Which of the following is defin.docxChapter 7QUESTION 1. Which of the following is defin.docx
Chapter 7QUESTION 1. Which of the following is defin.docx
 
Chapter 7One pageAPA stylePlease comment on the followin.docx
Chapter 7One pageAPA stylePlease comment on the followin.docxChapter 7One pageAPA stylePlease comment on the followin.docx
Chapter 7One pageAPA stylePlease comment on the followin.docx
 
CHAPTER 7Managing Financial OperationsRevenue cycle (bil.docx
CHAPTER 7Managing Financial OperationsRevenue cycle (bil.docxCHAPTER 7Managing Financial OperationsRevenue cycle (bil.docx
CHAPTER 7Managing Financial OperationsRevenue cycle (bil.docx
 
CHAPTER 7Primate BehaviorWhat is Meant By Behavior.docx
CHAPTER 7Primate BehaviorWhat is Meant By Behavior.docxCHAPTER 7Primate BehaviorWhat is Meant By Behavior.docx
CHAPTER 7Primate BehaviorWhat is Meant By Behavior.docx
 
Chapter 7Medical Care Production and Costs(c) 2012 Cengage.docx
Chapter 7Medical Care Production and Costs(c) 2012 Cengage.docxChapter 7Medical Care Production and Costs(c) 2012 Cengage.docx
Chapter 7Medical Care Production and Costs(c) 2012 Cengage.docx
 
Chapter 7Evaluating HRD ProgramsWerner© 2017 Cengage Learn.docx
Chapter 7Evaluating HRD ProgramsWerner© 2017 Cengage Learn.docxChapter 7Evaluating HRD ProgramsWerner© 2017 Cengage Learn.docx
Chapter 7Evaluating HRD ProgramsWerner© 2017 Cengage Learn.docx
 
CHAPTER 7INTEREST RATES AND BOND VALUATIONCopyright © 2019 M.docx
CHAPTER 7INTEREST RATES AND BOND VALUATIONCopyright © 2019 M.docxCHAPTER 7INTEREST RATES AND BOND VALUATIONCopyright © 2019 M.docx
CHAPTER 7INTEREST RATES AND BOND VALUATIONCopyright © 2019 M.docx
 
CHAPTER 7FriendshipTHE NATURE OF FRIENDSHIPFRIENDSHIP ACROSS T.docx
CHAPTER 7FriendshipTHE NATURE OF FRIENDSHIPFRIENDSHIP ACROSS T.docxCHAPTER 7FriendshipTHE NATURE OF FRIENDSHIPFRIENDSHIP ACROSS T.docx
CHAPTER 7FriendshipTHE NATURE OF FRIENDSHIPFRIENDSHIP ACROSS T.docx
 
Chapter 7Food, Nutrition & Obesity PolicyEyler, Chriqui, M.docx
Chapter 7Food, Nutrition & Obesity PolicyEyler, Chriqui, M.docxChapter 7Food, Nutrition & Obesity PolicyEyler, Chriqui, M.docx
Chapter 7Food, Nutrition & Obesity PolicyEyler, Chriqui, M.docx
 
Chapter 7Evaluating and Controlling TechnologyBased.docx
Chapter 7Evaluating and Controlling TechnologyBased.docxChapter 7Evaluating and Controlling TechnologyBased.docx
Chapter 7Evaluating and Controlling TechnologyBased.docx
 

Recently uploaded

A Critique of the Proposed National Education Policy Reform
A Critique of the Proposed National Education Policy ReformA Critique of the Proposed National Education Policy Reform
A Critique of the Proposed National Education Policy ReformChameera Dedduwage
 
CARE OF CHILD IN INCUBATOR..........pptx
CARE OF CHILD IN INCUBATOR..........pptxCARE OF CHILD IN INCUBATOR..........pptx
CARE OF CHILD IN INCUBATOR..........pptxGaneshChakor2
 
Sanyam Choudhary Chemistry practical.pdf
Sanyam Choudhary Chemistry practical.pdfSanyam Choudhary Chemistry practical.pdf
Sanyam Choudhary Chemistry practical.pdfsanyamsingh5019
 
_Math 4-Q4 Week 5.pptx Steps in Collecting Data
_Math 4-Q4 Week 5.pptx Steps in Collecting Data_Math 4-Q4 Week 5.pptx Steps in Collecting Data
_Math 4-Q4 Week 5.pptx Steps in Collecting DataJhengPantaleon
 
Software Engineering Methodologies (overview)
Software Engineering Methodologies (overview)Software Engineering Methodologies (overview)
Software Engineering Methodologies (overview)eniolaolutunde
 
BASLIQ CURRENT LOOKBOOK LOOKBOOK(1) (1).pdf
BASLIQ CURRENT LOOKBOOK  LOOKBOOK(1) (1).pdfBASLIQ CURRENT LOOKBOOK  LOOKBOOK(1) (1).pdf
BASLIQ CURRENT LOOKBOOK LOOKBOOK(1) (1).pdfSoniaTolstoy
 
18-04-UA_REPORT_MEDIALITERAСY_INDEX-DM_23-1-final-eng.pdf
18-04-UA_REPORT_MEDIALITERAСY_INDEX-DM_23-1-final-eng.pdf18-04-UA_REPORT_MEDIALITERAСY_INDEX-DM_23-1-final-eng.pdf
18-04-UA_REPORT_MEDIALITERAСY_INDEX-DM_23-1-final-eng.pdfssuser54595a
 
Science 7 - LAND and SEA BREEZE and its Characteristics
Science 7 - LAND and SEA BREEZE and its CharacteristicsScience 7 - LAND and SEA BREEZE and its Characteristics
Science 7 - LAND and SEA BREEZE and its CharacteristicsKarinaGenton
 
The Most Excellent Way | 1 Corinthians 13
The Most Excellent Way | 1 Corinthians 13The Most Excellent Way | 1 Corinthians 13
The Most Excellent Way | 1 Corinthians 13Steve Thomason
 
Class 11 Legal Studies Ch-1 Concept of State .pdf
Class 11 Legal Studies Ch-1 Concept of State .pdfClass 11 Legal Studies Ch-1 Concept of State .pdf
Class 11 Legal Studies Ch-1 Concept of State .pdfakmcokerachita
 
Separation of Lanthanides/ Lanthanides and Actinides
Separation of Lanthanides/ Lanthanides and ActinidesSeparation of Lanthanides/ Lanthanides and Actinides
Separation of Lanthanides/ Lanthanides and ActinidesFatimaKhan178732
 
microwave assisted reaction. General introduction
microwave assisted reaction. General introductionmicrowave assisted reaction. General introduction
microwave assisted reaction. General introductionMaksud Ahmed
 
“Oh GOSH! Reflecting on Hackteria's Collaborative Practices in a Global Do-It...
“Oh GOSH! Reflecting on Hackteria's Collaborative Practices in a Global Do-It...“Oh GOSH! Reflecting on Hackteria's Collaborative Practices in a Global Do-It...
“Oh GOSH! Reflecting on Hackteria's Collaborative Practices in a Global Do-It...Marc Dusseiller Dusjagr
 
Employee wellbeing at the workplace.pptx
Employee wellbeing at the workplace.pptxEmployee wellbeing at the workplace.pptx
Employee wellbeing at the workplace.pptxNirmalaLoungPoorunde1
 
Enzyme, Pharmaceutical Aids, Miscellaneous Last Part of Chapter no 5th.pdf
Enzyme, Pharmaceutical Aids, Miscellaneous Last Part of Chapter no 5th.pdfEnzyme, Pharmaceutical Aids, Miscellaneous Last Part of Chapter no 5th.pdf
Enzyme, Pharmaceutical Aids, Miscellaneous Last Part of Chapter no 5th.pdfSumit Tiwari
 
Kisan Call Centre - To harness potential of ICT in Agriculture by answer farm...
Kisan Call Centre - To harness potential of ICT in Agriculture by answer farm...Kisan Call Centre - To harness potential of ICT in Agriculture by answer farm...
Kisan Call Centre - To harness potential of ICT in Agriculture by answer farm...Krashi Coaching
 
Organic Name Reactions for the students and aspirants of Chemistry12th.pptx
Organic Name Reactions  for the students and aspirants of Chemistry12th.pptxOrganic Name Reactions  for the students and aspirants of Chemistry12th.pptx
Organic Name Reactions for the students and aspirants of Chemistry12th.pptxVS Mahajan Coaching Centre
 
The basics of sentences session 2pptx copy.pptx
The basics of sentences session 2pptx copy.pptxThe basics of sentences session 2pptx copy.pptx
The basics of sentences session 2pptx copy.pptxheathfieldcps1
 
Hybridoma Technology ( Production , Purification , and Application )
Hybridoma Technology  ( Production , Purification , and Application  ) Hybridoma Technology  ( Production , Purification , and Application  )
Hybridoma Technology ( Production , Purification , and Application ) Sakshi Ghasle
 

Recently uploaded (20)

A Critique of the Proposed National Education Policy Reform
A Critique of the Proposed National Education Policy ReformA Critique of the Proposed National Education Policy Reform
A Critique of the Proposed National Education Policy Reform
 
CARE OF CHILD IN INCUBATOR..........pptx
CARE OF CHILD IN INCUBATOR..........pptxCARE OF CHILD IN INCUBATOR..........pptx
CARE OF CHILD IN INCUBATOR..........pptx
 
Sanyam Choudhary Chemistry practical.pdf
Sanyam Choudhary Chemistry practical.pdfSanyam Choudhary Chemistry practical.pdf
Sanyam Choudhary Chemistry practical.pdf
 
_Math 4-Q4 Week 5.pptx Steps in Collecting Data
_Math 4-Q4 Week 5.pptx Steps in Collecting Data_Math 4-Q4 Week 5.pptx Steps in Collecting Data
_Math 4-Q4 Week 5.pptx Steps in Collecting Data
 
Software Engineering Methodologies (overview)
Software Engineering Methodologies (overview)Software Engineering Methodologies (overview)
Software Engineering Methodologies (overview)
 
BASLIQ CURRENT LOOKBOOK LOOKBOOK(1) (1).pdf
BASLIQ CURRENT LOOKBOOK  LOOKBOOK(1) (1).pdfBASLIQ CURRENT LOOKBOOK  LOOKBOOK(1) (1).pdf
BASLIQ CURRENT LOOKBOOK LOOKBOOK(1) (1).pdf
 
18-04-UA_REPORT_MEDIALITERAСY_INDEX-DM_23-1-final-eng.pdf
18-04-UA_REPORT_MEDIALITERAСY_INDEX-DM_23-1-final-eng.pdf18-04-UA_REPORT_MEDIALITERAСY_INDEX-DM_23-1-final-eng.pdf
18-04-UA_REPORT_MEDIALITERAСY_INDEX-DM_23-1-final-eng.pdf
 
Science 7 - LAND and SEA BREEZE and its Characteristics
Science 7 - LAND and SEA BREEZE and its CharacteristicsScience 7 - LAND and SEA BREEZE and its Characteristics
Science 7 - LAND and SEA BREEZE and its Characteristics
 
The Most Excellent Way | 1 Corinthians 13
The Most Excellent Way | 1 Corinthians 13The Most Excellent Way | 1 Corinthians 13
The Most Excellent Way | 1 Corinthians 13
 
Class 11 Legal Studies Ch-1 Concept of State .pdf
Class 11 Legal Studies Ch-1 Concept of State .pdfClass 11 Legal Studies Ch-1 Concept of State .pdf
Class 11 Legal Studies Ch-1 Concept of State .pdf
 
Separation of Lanthanides/ Lanthanides and Actinides
Separation of Lanthanides/ Lanthanides and ActinidesSeparation of Lanthanides/ Lanthanides and Actinides
Separation of Lanthanides/ Lanthanides and Actinides
 
microwave assisted reaction. General introduction
microwave assisted reaction. General introductionmicrowave assisted reaction. General introduction
microwave assisted reaction. General introduction
 
“Oh GOSH! Reflecting on Hackteria's Collaborative Practices in a Global Do-It...
“Oh GOSH! Reflecting on Hackteria's Collaborative Practices in a Global Do-It...“Oh GOSH! Reflecting on Hackteria's Collaborative Practices in a Global Do-It...
“Oh GOSH! Reflecting on Hackteria's Collaborative Practices in a Global Do-It...
 
Employee wellbeing at the workplace.pptx
Employee wellbeing at the workplace.pptxEmployee wellbeing at the workplace.pptx
Employee wellbeing at the workplace.pptx
 
Staff of Color (SOC) Retention Efforts DDSD
Staff of Color (SOC) Retention Efforts DDSDStaff of Color (SOC) Retention Efforts DDSD
Staff of Color (SOC) Retention Efforts DDSD
 
Enzyme, Pharmaceutical Aids, Miscellaneous Last Part of Chapter no 5th.pdf
Enzyme, Pharmaceutical Aids, Miscellaneous Last Part of Chapter no 5th.pdfEnzyme, Pharmaceutical Aids, Miscellaneous Last Part of Chapter no 5th.pdf
Enzyme, Pharmaceutical Aids, Miscellaneous Last Part of Chapter no 5th.pdf
 
Kisan Call Centre - To harness potential of ICT in Agriculture by answer farm...
Kisan Call Centre - To harness potential of ICT in Agriculture by answer farm...Kisan Call Centre - To harness potential of ICT in Agriculture by answer farm...
Kisan Call Centre - To harness potential of ICT in Agriculture by answer farm...
 
Organic Name Reactions for the students and aspirants of Chemistry12th.pptx
Organic Name Reactions  for the students and aspirants of Chemistry12th.pptxOrganic Name Reactions  for the students and aspirants of Chemistry12th.pptx
Organic Name Reactions for the students and aspirants of Chemistry12th.pptx
 
The basics of sentences session 2pptx copy.pptx
The basics of sentences session 2pptx copy.pptxThe basics of sentences session 2pptx copy.pptx
The basics of sentences session 2pptx copy.pptx
 
Hybridoma Technology ( Production , Purification , and Application )
Hybridoma Technology  ( Production , Purification , and Application  ) Hybridoma Technology  ( Production , Purification , and Application  )
Hybridoma Technology ( Production , Purification , and Application )
 

Chapter 7Lean Thinking and Lean SystemsMcGraw-Hill Ed.docx

  • 1. Chapter 7: Lean Thinking and Lean Systems McGraw-Hill Education Copyright © 2018 by The McGraw-Hill Companies, Inc. All rights reserved. * Copyright © 2018 by The McGraw-Hill Companies, Inc. All rights reserved. * The lean systems chapter begins with a broad orientation to lean and its elements with an historical perspective of its development. Then each element is discussed in detail in separate sections. The discussion includes situations in which elements of lean have been successfully applied, as well as situations in which they may not be applicable (e.g. smoothing the master production schedule in services). The chapter concludes with discussion on implementation of lean systems and how lean concepts can be applied to all business disciplines (manufacturing, services, government, etc.). Chapter 7 Learning ObjectivesLO 7.1 Describe the origins and evolution of lean thinking.LO 7.2 Describe the five tenets of lean thinking and the seven forms of waste in a lean system.LO 7.3 Explain how a stabilized master schedule is achieved for repetitive manufacturing.LO 7.4 Design a kanban system for a lean system.LO 7.5 Explain how setup time, lot size, layout and maintenance are related to lean thinking.LO 7.6 Differentiate
  • 2. how employees, quality, and suppliers are unique in lean systems.LO 7.7 Explain how to implement a lean system. 7-* Here are our Learning Objectives for this course. Between these videos, the textbook, supplemental readings, assignments and Discussion Boards, you will end the course with some new skills and many new insights. * Evolution of LeanToyota Production System (TPS)Developed in Japan following WWII (limited resources)Also known as Just- in-Time (JIT) manufacturingCame to U.S.- 1981 at Kawasaki motorcycle plant in Lincoln, NebraskaLean ProductionTerm coined in late 1980sPopularized in 1990s by Womack, Jones & Roos’ “The Machine That Changed the World” 7-* Copyright © 2018 by The McGraw-Hill Companies, Inc. All rights reserved. Copyright © 2018 by The McGraw-Hill Companies, Inc. All rights reserved. After WWII the U. S. system of mass production was the envy of the world. Mass production – the production of standardized discrete products in high volume by means of repetitive manufacturing technologies – was the norm. Materials were purchased in large batches, and machines were made to run faster to reduce unit costs. *
  • 3. Lean TenetsCreate product/service value from customer perspectiveReduce waste - mudaIdentify, study, improve the value streamObserve the process - gembaEnsure simple, smooth, error-free flowDetermine takt timeProduce only what is pulled by customerUse kanbansStrive for perfectionHold kaizen events, 5S, 5 Whys 7-* Copyright © 2018 by The McGraw-Hill Companies, Inc. All rights reserved. Copyright © 2018 by The McGraw-Hill Companies, Inc. All rights reserved. Lean thinking is built around five tenets that include specific concepts, principles, and techniques to organize and deliver value to customers efficiently. This is where we will focus on what adds value to a product or service and non-value adding activities that increase cost and time. * The Seven Forms of Waste 7-* Copyright © 2018 by The McGraw-Hill Companies, Inc. All rights reserved.Overproduction: Producing more than the demand for customers, resulting in unnecessary inventory, handling, paperwork, and warehouse space.Waiting time: Operators and machines waiting for parts or work to arrive from suppliers or other operations. Customers waiting in line.Unnecessary transportation: Double or triple movement of materials due to poor layouts, lack of coordination, and poor workplace organization.Excess processing: Poor design or inadequate maintenance or processes, requiring additional labor or machine time.Too much inventory: Excess inventory due to large lot sizes, obsolete items, poor forecasts, or improper production planning.Unnecessary motion: Wasted movements
  • 4. of people or extra walking to get materials.Defects: Use of material, labor, and capacity for production of defects, sorting out bad parts, or warranty costs with customers. Copyright © 2018 by The McGraw-Hill Companies, Inc. All rights reserved. Remember that value is defined by the customer and provided in the product or service the customer needs at a place, time, and price the customer is willing to pay. If inventory is money sitting on a shelf, then why would a company want to overproduce and waste its resources? If you are familiar with your financial statements, then you will know that if the product is overproduced and has not sold, they suppliers and employees (inputs) must still be paid on time. This will result in needing to cover the company’s cost through capital funds, instead of revenue. * Value Stream MappingValue stream is all processing steps to complete product/serviceExtension of process flowchartingIncludes value-adding/non-value-adding activitiesRequires direct observation of process – gemba“Is this step or task necessary in creating value to the customer?”Change and improve process 7-* Copyright © 2018 by The McGraw-Hill Companies, Inc. All rights reserved. Copyright © 2018 by The McGraw-Hill Companies, Inc. All rights reserved. When we seek to give the customer value and eliminate non- value activities, we are turning the supply chain into the value chain. The best method for doing this is to ensure all steps in a process are needed. Every process is a combination of steps.
  • 5. By flowcharting a process, we breakdown each activity within the process into steps. Within a 5 step process, I then seek to see if I can combine steps 1 & 2, and eliminate step 4. The number of the step is irrelevant. You can combine steps 2 & 3 and eliminate step 5 or 8. Your goal is to become more efficient by the reduction of touches or extra procedures that do not add value to the finished good or service. * 7-* Value Stream Mapping Here is a visual of mapping out a process into steps in order to identify what is needed (adds value) and what steps are not needed (non-value adding). * Elements of Lean SystemStabilizing the master scheduleControlling flow with kanban systemReducing setup time (quick changeover)Small lot sizes (goal lot size of single unit)Efficient layout (linear flow, low inventories)Preventive maintenanceCross-training, rewarding workersQuality and continuous improvementClose relationships with suppliers (frequent deliveries) 7-* Copyright © 2018 by The McGraw-Hill Companies, Inc. All rights reserved. Copyright © 2018 by The McGraw-Hill Companies, Inc. All rights reserved. One of the ways firms can move toward achieving the lean tenet of simple, smooth, and error-free flow is to level the amount of
  • 6. work that is performed each day. Remember we spoke of this earlier when we distributed the workload of producing 100,000 bicycles over 20 production days by manufacturing 5,000 per day. This practice is referred to as stabilizing the master schedule. The process of production planning for manufacturing starts with a long-range production plan using the forecast, which then is broken down into annual, monthly, and daily plans. * Stabilizing the Master ScheduleProduction horizon set according to demandProduction schedule repeated each dayUniform load: level work load across workers/machinesTakt time: match supply (production rate) to demand rate Produce planned quantity each day, and no more Desirable, but not essential, to a lean system 7-* Copyright © 2018 by The McGraw-Hill Companies, Inc. All rights reserved. Copyright © 2018 by The McGraw-Hill Companies, Inc. All rights reserved. Matching supply to demand or matching market demand to production of goods is illustrated by the concept of takt time. Takt is the German word for the baton that an orchestra director uses to regulate the speed of the music. A takt time of 2 minutes means that one unit is completed every 2 minutes, or 30 units are produced in an hour. * Kanban SystemKanban: “marker” (card, sign)“Pull” production systemVisual control system of cards and containers, or other
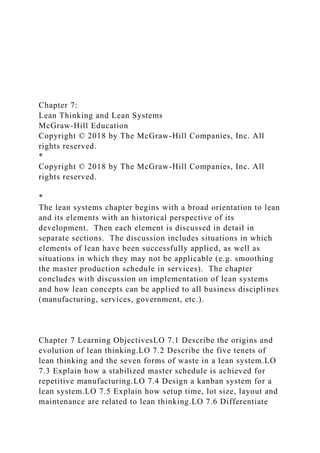
  • 7. type of signal Number of containers: D = Demand rate (at work center) T = Time for container to complete circuit C = Container size (# units) 7-* Copyright © 2018 by The McGraw-Hill Companies, Inc. All rights reserved. Copyright © 2018 by The McGraw-Hill Companies, Inc. All rights reserved. Kanban is a method of production authorization and materials movement, which means the company will not over or under produce, but will meet supply with demand. The production system supports the tenet of producing only what is pulled by the customer. This alleviates the buildup of inventory by a pull production system. * The Kanban SystemSignals the need for more partsUses simple cards or signals to control production/inventoryEach work center receives production order (card) from succeeding work centerPrevents the buildup of inventoryReduces lead time Extends to receiving orders from suppliers 7-* Copyright © 2018 by The McGraw-Hill Companies, Inc. All rights reserved. Copyright © 2018 by The McGraw-Hill Companies, Inc. All rights reserved. * If the market stops or slows, it signals production to stop or slow, as needed, to meet demand. Go back and visualize having
  • 8. lunch at Chipotle or Subway. Remember the subassemblies that are in front of the customer ready to assemble-to-order based on the customer’s needs. If the customer (market) does not order, the subassembly does not empty, triggering replenishment. Kanban System (Figure 7.3) 7-* Copyright © 2018 by The McGraw-Hill Companies, Inc. All rights reserved. Copyright © 2018 by The McGraw-Hill Companies, Inc. All rights reserved. Some companies control the movement of containers by using two types of kanban cards: production cards and withdrawal (move) cards. These cards are used to authorize production and to identify the parts in any container. Instead of using cards, production can also be controlled by kanban squares that visually signal the need for work (to fill the kanban square), or by visual control of the empty containers. * Reducing Setup Time and Lot SizesReducing setup time:increases available capacityincreases flexibility to meet schedule changesreduces inventorySetup typesSingle (single digit minutes) One-touch (less then 1 min; 2-step process)Internal (while machine stopped)External (while machine operating)Lot size reductionGoal: single unit production 7-* Copyright © 2018 by The McGraw-Hill Companies, Inc. All rights reserved. Copyright © 2018 by The McGraw-Hill Companies, Inc. All
  • 9. rights reserved. Time is money and slow production rates waste a company’s resources. Inventory can be decreased by reducing the size of the containers or the number of containers used in the kanban system. This is done by reducing the lead time, the time required to circulate a container. When any of these times have been reduced, management can remove kanban cards from the system and remove a corresponding number of containers. It is the responsibility of managers and workers in a lean system to reduce inventory by means of a continuous cycle of improvement. I say “if it ain’t broken, break it!” Reducing lead time by reducing the fill, wait, move, use or return times is the key. * Chapter 7 SummaryLO 7.1 Describe the origins and evolution of lean thinking.LO 7.2 Describe the five tenets of lean thinking and the seven forms of waste in a lean system.LO 7.3 Explain how a stabilized master schedule is achieved for repetitive manufacturing.LO 7.4 Design a kanban system for a lean system.LO 7.5 Explain how setup time, lot size, layout and maintenance are related to lean thinking.LO 7.6 Differentiate how employees, quality, and suppliers are unique in lean systems.LO 7.7 Explain how to implement a lean system. 7-* Copyright © 2018 by The McGraw-Hill Companies, Inc. All rights reserved. Copyright © 2018 by The McGraw-Hill Companies, Inc. All rights reserved.
  • 10. Summarize * * The lean systems chapter begins with a broad orientation to lean and its elements with an historical perspective of its development. Then each element is discussed in detail in separate sections. The discussion includes situations in which elements of lean have been successfully applied, as well as situations in which they may not be applicable (e.g. smoothing the master production schedule in services). The chapter concludes with discussion on implementation of lean systems and how lean concepts can be applied to all business disciplines (manufacturing, services, government, etc.). Here are our Learning Objectives for this course. Between these videos, the textbook, supplemental readings, assignments and Discussion Boards, you will end the course with some new skills and many new insights. * After WWII the U. S. system of mass production was the envy of the world. Mass production – the production of standardized discrete products in high volume by means of repetitive manufacturing technologies – was the norm. Materials were purchased in large batches, and machines were made to run faster to reduce unit costs. * Lean thinking is built around five tenets that include specific concepts, principles, and techniques to organize and deliver value to customers efficiently. This is where we will focus on what adds value to a product or service and non-value adding activities that increase cost and time. * Remember that value is defined by the customer and provided in the product or service the customer needs at a place, time, and
  • 11. price the customer is willing to pay. If inventory is money sitting on a shelf, then why would a company want to overproduce and waste its resources? If you are familiar with your financial statements, then you will know that if the product is overproduced and has not sold, they suppliers and employees (inputs) must still be paid on time. This will result in needing to cover the company’s cost through capital funds, instead of revenue. * When we seek to give the customer value and eliminate non- value activities, we are turning the supply chain into the value chain. The best method for doing this is to ensure all steps in a process are needed. Every process is a combination of steps. By flowcharting a process, we breakdown each activity within the process into steps. Within a 5 step process, I then seek to see if I can combine steps 1 & 2, and eliminate step 4. The number of the step is irrelevant. You can combine steps 2 & 3 and eliminate step 5 or 8. Your goal is to become more efficient by the reduction of touches or extra procedures that do not add value to the finished good or service. * Here is a visual of mapping out a process into steps in order to identify what is needed (adds value) and what steps are not needed (non-value adding). * One of the ways firms can move toward achieving the lean tenet of simple, smooth, and error-free flow is to level the amount of work that is performed each day. Remember we spoke of this earlier when we distributed the workload of producing 100,000 bicycles over 20 production days by manufacturing 5,000 per day. This practice is referred to as stabilizing the master schedule. The process of production planning for manufacturing starts with a long-range production plan using the forecast, which then is broken down into annual, monthly, and daily plans. *
  • 12. Matching supply to demand or matching market demand to production of goods is illustrated by the concept of takt time. Takt is the German word for the baton that an orchestra director uses to regulate the speed of the music. A takt time of 2 minutes means that one unit is completed every 2 minutes, or 30 units are produced in an hour. * Kanban is a method of production authorization and materials movement, which means the company will not over or under produce, but will meet supply with demand. The production system supports the tenet of producing only what is pulled by the customer. This alleviates the buildup of inventory by a pull production system. * * If the market stops or slows, it signals production to stop or slow, as needed, to meet demand. Go back and visualize having lunch at Chipotle or Subway. Remember the subassemblies that are in front of the customer ready to assemble-to-order based on the customer’s needs. If the customer (market) does not order, the subassembly does not empty, triggering replenishment. Some companies control the movement of containers by using two types of kanban cards: production cards and withdrawal (move) cards. These cards are used to authorize production and to identify the parts in any container. Instead of using cards, production can also be controlled by kanban squares that visually signal the need for work (to fill the kanban square), or by visual control of the empty containers. * Time is money and slow production rates waste a company’s resources. Inventory can be decreased by reducing the size of the containers or the number of containers used in the kanban system. This is done by reducing the lead time, the time required to circulate a container. When any of these times have been reduced, management can remove kanban cards from the system and remove a corresponding number of containers. It is
  • 13. the responsibility of managers and workers in a lean system to reduce inventory by means of a continuous cycle of improvement. I say “if it ain’t broken, break it!” Reducing lead time by reducing the fill, wait, move, use or return times is the key. * Summarize * C DT n = Chapter 4: Process Selection Copyright © 2018 by The McGraw-Hill Companies, Inc. All rights reserved. McGraw-Hill Education Copyright © 2018 by The McGraw-Hill Companies, Inc. All rights reserved. 4-* Copyright © 2018 by The McGraw-Hill Companies, Inc. All rights reserved. * The purpose of this chapter is to describe the major types of processes available and the factors that should be considered in any process selection decision. Two major dimensions of process classification are considered; flow of the product, and type of customer order. The product-process matrix, formulated by Hayes and Wheelwright, provides a basis for process
  • 14. selection by linking product-process and corporate strategy. Focused Operations, Mass Customization and 3D Printing are also covered as part of process selection decisions. Chapter 4 Learning ObjectivesLO 4.1 Contrast and compare the five types of product-flow processes.LO 4.2 Describe the differences among order fulfillment processes.LO 4.3 Explain how companies should make process selection decisions.LO 4.4 Correctly place examples of products on the diagonal of the product-process matrix.LO 4.5 Describe the features of focused operations.LO 4.6 Discuss the advantages and disadvantages of mass customization and 3D Printing.LO 4.7 Contrast pollution prevention, control and practices. Copyright © 2018 by The McGraw-Hill Companies, Inc. All rights reserved. 4-* Copyright © 2018 by The McGraw-Hill Companies, Inc. All rights reserved. Here are our Learning Objectives for this course. Between these videos, the textbook, supplemental readings, assignments and Discussion Boards, you will end the course with some new skills and many new insights. * Product-Flow Characteristics Types of Product FlowContinuous processAssembly lineBatch flowJob shopProject Copyright © 2018 by The McGraw-Hill Companies, Inc. All rights reserved. 4-* Copyright © 2018 by The McGraw-Hill Companies, Inc. All
  • 15. rights reserved. Process selection decisions determine the type of process used to make a product or service. The considerations required for process selection include the volume of the product and whether the product is standardized or customized. Remember that standardization refers to mass production of the same product (i.e. cookie cutter). This helps keep the unit cost down by limiting the flexibility of change the product. Customization enables manufacturers to give customers many choices. Generally speaking, high-volume products that are standardized will be made using either a continuous process or an assembly line, both where there is little to no downtime. Low-volume customized products will be made using a batch or job shop process where there’s more down time associated with producing the product. * Product-Flow Characteristics: Continuous ProcessHighly standardized and automatedFlexibility limitedHigh volumes of productionCommodity productsLow cost is the ‘Order Winner’Process industries (sugar, paper, oil, electricity, etc.) Copyright © 2018 by The McGraw-Hill Companies, Inc. All rights reserved. 4-* Copyright © 2018 by The McGraw-Hill Companies, Inc. All rights reserved. Continuous production tends to make products that are difficult to differentiate and low cost becomes the “order winner” for
  • 16. manufacturing to compete in very price-sensitive markets. Therefore, continuous production tends to be highly automated, operate at capacity, and minimize inventories and distribution costs to reduce the total cost of manufacturing. * Product-Flow Characteristics: Assembly LineLinear sequence of operations (often paced)Large capital investment, use of automationVery efficientHigh- volume, standardized productsLow flexibility to product and volume changesDiscrete products (autos, appliances, computers, etc.) Copyright © 2018 by The McGraw-Hill Companies, Inc. All rights reserved. 4-* Copyright © 2018 by The McGraw-Hill Companies, Inc. All rights reserved. Assembly lines make only one or a few products and use inflexible equipment and labor. The assembly-line flow is characterized by a linear sequence of operations where the product moves from one step to the next in a sequential manner from beginning to end. The example I like to reference is Subway or Chipotle fast food restaurants. You start at one end then work your way down the assembly line as your order is being finalized. The sub-assemblies of products are laid out to give the customer a modular design of options to produce a finished good. *
  • 17. Assembly Line: Metal Bracket (Figure 4.1) paint drill bend Task or work station Product flow cut Copyright © 2018 by The McGraw-Hill Companies, Inc. All rights reserved. 4-* Copyright © 2018 by The McGraw-Hill Companies, Inc. All rights reserved. Example of how an assembly line production is set up in a linear flow. * Product-Flow Characteristics: Batch FlowProduction of batches or lotsBatches flow as a unit (set) from one work center to anotherProcess layout of work centers (by tasks)Flow is jumbled and intermittentFlexible labor and equipment (general purpose)Low to high volume, variety of productsMany types of products (furniture, dishes, boats) Copyright © 2018 by The McGraw-Hill Companies, Inc. All rights reserved. 4-* Copyright © 2018 by The McGraw-Hill Companies, Inc. All rights reserved. Earlier I mentioned that batch flow production has more downtime than continuous flow and assembly line productions.
  • 18. This is because items can travel from one work center to another in jumbled patterns. Because work is completed in batches or lots, only 10% to 20% of the work being completed. Imagine 50 boards of lumber waiting to be sawed or cut to a metric of 30 inches each. While the first board is being cut, the other 49 boards are waiting (downtime) to be cut. While the second board is being cut, again, the other 49 boards are waiting. Not until all boards are cut do they travel to the next work station, say drilling. If that particular work order does not require any holes to be drilled, then they can skip that work center (drilling) and move to another work center (painting). There’s flexible labor and equipment build into this form of production flow. * Batch Flow: Three Metal Brackets (Figure 4.2) Cut Paint Task or work station Product flows Bend Drill Batch A Batch B Batch C Copyright © 2018 by The McGraw-Hill Companies, Inc. All rights reserved. 4-* Copyright © 2018 by The McGraw-Hill Companies, Inc. All rights reserved. Example of how a batch flow production line is set up in a jumbled flow.
  • 19. * Product-Flow Characteristics: Job ShopCustomized to customer orderProduction of small batches or lotsLayout/flow similar to Batch FlowFlexible labor and equipment (general purpose)Many types of made-to-order products (plastic parts, machine components, sheet metal parts, custom signs, artificial limbs, etc.) Copyright © 2018 by The McGraw-Hill Companies, Inc. All rights reserved. 4-* Copyright © 2018 by The McGraw-Hill Companies, Inc. All rights reserved. Like the batch process, a job shop uses general-purpose equipment and has a jumbled flow. It has high flexibility for product is and volume of production, but the costs are higher since the volume and standardization are low. Typical products produced in a job shop include products that are made-to-order. * Product-Flow Characteristics: ProjectProduction of customized single productsLabor and materials brought to sitePlanning, scheduling challengesLittle automation, general purpose equipmentHighly skilled and flexible labor Unique, one of a kind products (bridges, building construction, large aircraft, etc.) Copyright © 2018 by The McGraw-Hill Companies, Inc. All rights reserved.
  • 20. 4-* Copyright © 2018 by The McGraw-Hill Companies, Inc. All rights reserved. In the project form of operations, each unit is made individually and is different from the other units. Projects are used when the customer desires customization and uniqueness. The costs of production for projects are high and sometimes difficult to control. This is the case because the project may be difficult to define in all its details with the project scope. * Throughput Ratio: Process efficiency TR = Total processing time for the job Total time in operations X 100% Typically: 90-100% in Continuous Process and Assembly Line 10-20% in Batch Flow and Job Shop Copyright © 2018 by The McGraw-Hill Companies, Inc. All rights reserved. 4-* Copyright © 2018 by The McGraw-Hill Companies, Inc. All rights reserved. I stated several times that “time is money” and producing on a continuous flow or assembly line lowers the product’s unit cost. This is because of the throughput ratio and how it relates to uptime and downtime. In the numerator of the throughput ratio is the total processing time for the job, which includes only the time the job actually spends being processed by machines or labor, excluding any waiting time between operations. The
  • 21. denominator includes the total time the job spends in operations, including both processing and waiting time. Batch flow items have between 10% to 20% throughput ratios which mean they can spend 80% to 90% of their time waiting to be processed. * Order FulfillmentMake-to-Stock (MTS)Make-to-Order (MTO)Assemble-to-Order (ATO) Copyright © 2018 by The McGraw-Hill Companies, Inc. All rights reserved. 4-* Copyright © 2018 by The McGraw-Hill Companies, Inc. All rights reserved. Another critical decision of operations is how the orders from customers are fulfilled. Remember the difference in operations when we spoke of the assembly to order process that Chipotle uses versus the make to order process of a standard taco shop. * Make-to-Stock (MTS)Produce finished goods according to production scheduleCustomer buys from inventoryAdvantage: faster fulfillment of customer demand, lower cost, smooth production rateDisadvantage: inventory holding costs, slower to respond to changes in customer preferences Copyright © 2018 by The McGraw-Hill Companies, Inc. All rights reserved. 4-* Copyright © 2018 by The McGraw-Hill Companies, Inc. All rights reserved.
  • 22. When you consider manufactured products that “make-to-stock” you should think of the word inventory. Remember that inventory is money sitting on a shelf until it is purchased to you should only produce what the market pulls from your stock. So what your company is doing is producing a product that is made to forecast because there is no end-user request yet. The end- user walks into a store and purchases the product from the store’s inventory. This process results in lower unit costs and smoother production rates because as we forecast demand, we can level out product cost. For example: if the market demands 100,000 bicycles per month, we can break or smooth that product rate down to 5,000 bicycles per day (5 production days per week times 4 weeks per month). Once we know what our production rate (5,000) is per day, we hire the right amount of employees, order the precise number of raw materials to arrive just-in-time, and budget the associated transportation and holding costs. * Make-to-Stock (Figure 4.3) Customer Forecast orders Production Finished goods inventory Product Customer order Product Copyright © 2018 by The McGraw-Hill Companies, Inc. All
  • 23. rights reserved. 4-* Copyright © 2018 by The McGraw-Hill Companies, Inc. All rights reserved. This is a visual example of the make-to-stock product cycle. The market provides a forecast that is used to calculate production and produce finished goods that are held in inventory until customer purchase. * MTS Performance MeasuresService level (orders filled when requested)Inventory replenishment timeInventory turnover (sales/avg. inventory)Capacity utilizationTime to fill back orderOthers, such as shrinkage rate Copyright © 2018 by The McGraw-Hill Companies, Inc. All rights reserved. 4-* Copyright © 2018 by The McGraw-Hill Companies, Inc. All rights reserved. Inventory turnover is critical because if market demand slows or stops, a company can be left with over-production. If market demand increases, a company can suffer from stock outs or lost sales. Accurate forecasting is also critical to replenishment time for the same reasons. Using Christmas day as an example, for customers to have their purchases available by 12/25, the traditionally conduct their shopping the day after the Thanksgiving holiday, known as Black Friday or Cyber Monday. Therefore stores want their shelfs stocked by 11/25. With 4 weeks manufacturing lead and throughput times, a company would need to start producing the products on 10/25. To ensure the raw materials arrive just-in-
  • 24. time for production to start on 10/25, they may require their suppliers to commence their production months earlier depending how far backwards their supply chain are connected. If we use the bicycles as the products, the manufacturing company that assembles the bicycles on 10/25 would need to forecast and order the frames, handle bars, chains, tires, wheels, etc. months before production begins. * Make-to-Order (MTO)Start production after customer ordersNo finished goods inventoryAdvantage: higher flexibility to customize order; no finished goods inventory costsDisadvantage: intermittent production (i.e., lumpy demand pattern), slower response to customer demand Copyright © 2018 by The McGraw-Hill Companies, Inc. All rights reserved. 4-* Copyright © 2018 by The McGraw-Hill Companies, Inc. All rights reserved. No forecast is needed for make-to-order production because it is more customized per the customer’s wishes. This requires much flexibility from the manufacturer and the customer. Lead times are longer because production cycles and rates cannot be smoothed over time. * Make-to-Order (Figure 4.3) Customer
  • 25. Production Product Customer order Copyright © 2018 by The McGraw-Hill Companies, Inc. All rights reserved. 4-* Copyright © 2018 by The McGraw-Hill Companies, Inc. All rights reserved. This is a visual example of the make-to-order product cycle. The market does not need to provide a forecast as production does not begin until the customer places an order. There is no finished inventory. * MTO Performance Measures Lead time Orders completed on time (%) Customer request date Promise date Copyright © 2018 by The McGraw-Hill Companies, Inc. All rights reserved. 4-* Copyright © 2018 by The McGraw-Hill Companies, Inc. All rights reserved. The most critical aspect of MTO is delivering the final product when promised. Lead times will be longer as raw materials and a customer’s preference is unknown until the order is placed. * Assemble-to-Order (ATO)Produce parts and subassemblies
  • 26. (modules); complete production when customer places order Advantage: less finished goods inventory, faster fulfillment of customer order Disadvantage: work-in-process inventory Copyright © 2018 by The McGraw-Hill Companies, Inc. All rights reserved. 4-* Copyright © 2018 by The McGraw-Hill Companies, Inc. All rights reserved. Assemble-to-order uses a hybrid process of MTO and MTS. There are subassemblies or made-to-stock, but the final assembly is made-to-order. Visualize walking into a Chipotle or Subway for lunch. The final product is made from subassemblies of ingredients and as you walk down the assembly line, you have a say in how the final product is made. * Assemble-to-Order (Figure 4.3) Customer Forecast orders Production of subassemblies Inventory of subassemblies Customer order Product Assembly of the order Subassembly Copyright © 2018 by The McGraw-Hill Companies, Inc. All
  • 27. rights reserved. 4-* Copyright © 2018 by The McGraw-Hill Companies, Inc. All rights reserved. This is a visual example of the assemble-to-order product cycle. The market provides a forecast that is used to calculate production of subassemblies, and then the finished good is assembled once the customer’s order is received. * Process Selection DecisionsProcess characteristics (produce when? produce how?)When: MTS, MTO, ATOHow: Continuous process, Assembly line, Batch flow, Job shop, ProjectFactors affecting process choiceMarket conditionsCapital requirementsAvailability and cost of laborTechnology options Copyright © 2018 by The McGraw-Hill Companies, Inc. All rights reserved. 4-* Copyright © 2018 by The McGraw-Hill Companies, Inc. All rights reserved. We have discussed two dimensions that can be used for process classification purposes: product flow and approaches to order fulfillments. These dimensions are used to construct the six- cell matrix you will see in the next slide. * Process Characteristics Matrix (Table 4.2) Copyright © 2018 by The McGraw-Hill Companies, Inc. All rights reserved.
  • 28. 4-* Copyright © 2018 by The McGraw-Hill Companies, Inc. All rights reserved. Characteristics Make-to-Stock Make-to-Order or ATO Continuous and Assembly Line Flow Automobile assembly Oil refinery Cannery Cafeteria Automobile assembly Dell computers Electronic components Fast food Batch and Job Shop Machine shop Wine Glassware factory Costume jewelry Machine shop Restaurant
  • 29. Hospital Custom jewelry Project Speculation homes Commercial paintings Noncommissioned art Buildings Movies Ships This matrix contains the six combinations used in practice. Multiple combinations may be used by a single firm, depending on the products and volumes required by the market. Although it is common for an assembly-line operation to make-to-stock, it can also assemble-to-order. For example, an automobile assembly line is used to produce a large variety of different automobile options for particular customers, as well as cars that are being made for dealer stock. * Product-Process StrategyStrategy must consider product characteristics and process capabilities.Product life cycle: Often begins in Job Shop, then Batch Flow, then Continuous/Assembly Line. Example: Bread was first produced by hand in individual units in traditional bakeries, and
  • 30. is now produced in very large batches in modern automated bakeries. Copyright © 2018 by The McGraw-Hill Companies, Inc. All rights reserved. 4-* Copyright © 2018 by The McGraw-Hill Companies, Inc. All rights reserved. Process decisions are not static because processes evolve over time. The product-process matrix on the next slide will show you how a business can decide to move from batch flow to continuous/assembly flow as market demands increase and production rates are ramped up to meet that demand. * Product-Process Matrix (Figure 4.5) Low volume, low standardization Printing Heavy Equipment Auto assembly Sugar Refinery Low volume, multiple products Higher volume few major products High volume, high
  • 31. standardization, commodity NONE NONE Unique, one of a kind product Project Building Copyright © 2018 by The McGraw-Hill Companies, Inc. All rights reserved. 4-* Copyright © 2018 by The McGraw-Hill Companies, Inc. All rights reserved. A firm might be tempted to move down the diagonal ahead of its competitors and thus gain competitive advantage at lower cost. This can be a good idea if the customer is ready to accept a more standardized and higher-volume product. * Mass CustomizationStrategy to produce products in lot sizes = 1, in high volume. Made possible by flexible manufacturing. Traditional mass production provides economies of scale. Mass Customization means using a high volume process (economies of scale = low unit cost) to produce relatively custom products (economies of scope = high variety). Copyright © 2018 by The McGraw-Hill Companies, Inc. All rights reserved. 4-* Copyright © 2018 by The McGraw-Hill Companies, Inc. All
  • 32. rights reserved. With the advent of flexible manufacturing, due in large part by using the modular design concept (few common components offering a large variety of finished goods), mass customization is now possible. This dichotomy between mass production and customization can be overcome by using modern technologies, including computers, robotics, and the Internet. * Chapter 4 SummaryLO 4.1 Contrast and compare the five types of product-flow processes.LO 4.2 Describe the differences among order fulfillment processes.LO 4.3 Explain how companies should make process selection decisions.LO 4.4 Correctly place examples of products on the diagonal of the product-process matrix.LO 4.5 Describe the features of focused operations.LO 4.6 Discuss the advantages and disadvantages of mass customization and 3D Printing.LO 4.7 Contrast pollution prevention, control and practices. Copyright © 2018 by The McGraw-Hill Companies, Inc. All rights reserved. 4-* Copyright © 2018 by The McGraw-Hill Companies, Inc. All rights reserved. Summarize * * The purpose of this chapter is to describe the major types of processes available and the factors that should be considered in any process selection decision. Two major dimensions of process classification are considered; flow of the product, and type of customer order. The product-process matrix, formulated
  • 33. by Hayes and Wheelwright, provides a basis for process selection by linking product-process and corporate strategy. Focused Operations, Mass Customization and 3D Printing are also covered as part of process selection decisions. Here are our Learning Objectives for this course. Between these videos, the textbook, supplemental readings, assignments and Discussion Boards, you will end the course with some new skills and many new insights. * Process selection decisions determine the type of process used to make a product or service. The considerations required for process selection include the volume of the product and whether the product is standardized or customized. Remember that standardization refers to mass production of the same product (i.e. cookie cutter). This helps keep the unit cost down by limiting the flexibility of change the product. Customization enables manufacturers to give customers many choices. Generally speaking, high-volume products that are standardized will be made using either a continuous process or an assembly line, both where there is little to no downtime. Low-volume customized products will be made using a batch or job shop process where there’s more down time associated with producing the product. * Continuous production tends to make products that are difficult to differentiate and low cost becomes the “order winner” for manufacturing to compete in very price-sensitive markets. Therefore, continuous production tends to be highly automated, operate at capacity, and minimize inventories and distribution costs to reduce the total cost of manufacturing. * Assembly lines make only one or a few products and use inflexible equipment and labor. The assembly-line flow is
  • 34. characterized by a linear sequence of operations where the product moves from one step to the next in a sequential manner from beginning to end. The example I like to reference is Subway or Chipotle fast food restaurants. You start at one end then work your way down the assembly line as your order is being finalized. The sub-assemblies of products are laid out to give the customer a modular design of options to produce a finished good. * Example of how an assembly line production is set up in a linear flow. * Earlier I mentioned that batch flow production has more downtime than continuous flow and assembly line productions. This is because items can travel from one work center to another in jumbled patterns. Because work is completed in batches or lots, only 10% to 20% of the work being completed. Imagine 50 boards of lumber waiting to be sawed or cut to a metric of 30 inches each. While the first board is being cut, the other 49 boards are waiting (downtime) to be cut. While the second board is being cut, again, the other 49 boards are waiting. Not until all boards are cut do they travel to the next work station, say drilling. If that particular work order does not require any holes to be drilled, then they can skip that work center (drilling) and move to another work center (painting). There’s flexible labor and equipment build into this form of production flow. * Example of how a batch flow production line is set up in a jumbled flow. * Like the batch process, a job shop uses general-purpose equipment and has a jumbled flow. It has high flexibility for product is and volume of production, but the costs are higher since the volume and standardization are low. Typical products produced in a job shop include products that are made-to-order.
  • 35. * In the project form of operations, each unit is made individually and is different from the other units. Projects are used when the customer desires customization and uniqueness. The costs of production for projects are high and sometimes difficult to control. This is the case because the project may be difficult to define in all its details with the project scope. * I stated several times that “time is money” and producing on a continuous flow or assembly line lowers the product’s unit cost. This is because of the throughput ratio and how it relates to uptime and downtime. In the numerator of the throughput ratio is the total processing time for the job, which includes only the time the job actually spends being processed by machines or labor, excluding any waiting time between operations. The denominator includes the total time the job spends in operations, including both processing and waiting time. Batch flow items have between 10% to 20% throughput ratios which mean they can spend 80% to 90% of their time waiting to be processed. * Another critical decision of operations is how the orders from customers are fulfilled. Remember the difference in operations when we spoke of the assembly to order process that Chipotle uses versus the make to order process of a standard taco shop. * When you consider manufactured products that “make-to-stock” you should think of the word inventory. Remember that inventory is money sitting on a shelf until it is purchased to you should only produce what the market pulls from your stock. So what your company is doing is producing a product that is made to forecast because there is no end-user request yet. The end- user walks into a store and purchases the product from the store’s inventory.
  • 36. This process results in lower unit costs and smoother production rates because as we forecast demand, we can level out product cost. For example: if the market demands 100,000 bicycles per month, we can break or smooth that product rate down to 5,000 bicycles per day (5 production days per week times 4 weeks per month). Once we know what our production rate (5,000) is per day, we hire the right amount of employees, order the precise number of raw materials to arrive just-in-time, and budget the associated transportation and holding costs. * This is a visual example of the make-to-stock product cycle. The market provides a forecast that is used to calculate production and produce finished goods that are held in inventory until customer purchase. * Inventory turnover is critical because if market demand slows or stops, a company can be left with over-production. If market demand increases, a company can suffer from stock outs or lost sales. Accurate forecasting is also critical to replenishment time for the same reasons. Using Christmas day as an example, for customers to have their purchases available by 12/25, the traditionally conduct their shopping the day after the Thanksgiving holiday, known as Black Friday or Cyber Monday. Therefore stores want their shelfs stocked by 11/25. With 4 weeks manufacturing lead and throughput times, a company would need to start producing the products on 10/25. To ensure the raw materials arrive just-in- time for production to start on 10/25, they may require their suppliers to commence their production months earlier depending how far backwards their supply chain are connected. If we use the bicycles as the products, the manufacturing company that assembles the bicycles on 10/25 would need to forecast and order the frames, handle bars, chains, tires, wheels, etc. months before production begins. *
  • 37. No forecast is needed for make-to-order production because it is more customized per the customer’s wishes. This requires much flexibility from the manufacturer and the customer. Lead times are longer because production cycles and rates cannot be smoothed over time. * This is a visual example of the make-to-order product cycle. The market does not need to provide a forecast as production does not begin until the customer places an order. There is no finished inventory. * The most critical aspect of MTO is delivering the final product when promised. Lead times will be longer as raw materials and a customer’s preference is unknown until the order is placed. * Assemble-to-order uses a hybrid process of MTO and MTS. There are subassemblies or made-to-stock, but the final assembly is made-to-order. Visualize walking into a Chipotle or Subway for lunch. The final product is made from subassemblies of ingredients and as you walk down the assembly line, you have a say in how the final product is made. * This is a visual example of the assemble-to-order product cycle. The market provides a forecast that is used to calculate production of subassemblies, and then the finished good is assembled once the customer’s order is received. * We have discussed two dimensions that can be used for process classification purposes: product flow and approaches to order fulfillments. These dimensions are used to construct the six- cell matrix you will see in the next slide. * This matrix contains the six combinations used in practice. Multiple combinations may be used by a single firm, depending on the products and volumes required by the market. Although it is common for an assembly-line operation to make-to-stock, it
  • 38. can also assemble-to-order. For example, an automobile assembly line is used to produce a large variety of different automobile options for particular customers, as well as cars that are being made for dealer stock. * Process decisions are not static because processes evolve over time. The product-process matrix on the next slide will show you how a business can decide to move from batch flow to continuous/assembly flow as market demands increase and production rates are ramped up to meet that demand. * A firm might be tempted to move down the diagonal ahead of its competitors and thus gain competitive advantage at lower cost. This can be a good idea if the customer is ready to accept a more standardized and higher-volume product. * With the advent of flexible manufacturing, due in large part by using the modular design concept (few common components offering a large variety of finished goods), mass customization is now possible. This dichotomy between mass production and customization can be overcome by using modern technologies, including computers, robotics, and the Internet. * Summarize * Characteristics Make-to-Stock Make-to-Order or ATO Continuous and Assembly Line Flow Automobile assembly Oil refinery Cannery
  • 39. Cafeteria Automobile assembly Dell computers Electronic components Fast food Batch and Job Shop Machine shop Wine Glassware factory Costume jewelry Machine shop Restaurant Hospital Custom jewelry Project Speculation homes Commercial painting s Noncommissioned art Buildings Movies Ships McGraw-Hill/Irwin Chapter 3: Product Design Copyright © 2018 by The McGraw-Hill Companies, Inc. All rights reserved. 3-* Copyright © 2018 by The McGraw-Hill Companies, Inc. All
  • 40. rights reserved. * The purpose of this chapter is to show how product design relates to the operations function along with collaboration with customers and suppliers in the supply chain. The chapter stresses the steps in product design and the interaction between product design and process design. The chapter also discusses cross-functional design, quality function deployment, and reduction of product variety through the use of modular design. McGraw-Hill/Irwin Chapter 3 Learning ObjectivesLO 3.1 Compare the three strategies for new product introduction.LO 3.2 Describe the three phases of new-product development.LO 3.3 Evaluate how concurrent engineering deals with misalignment.LO 3.4 Describe the criteria that should be used for supplier selection.LO 3.5 Evaluate an example of Quality Function Deployment. LO 3.6 Explain the benefits of modular design. Copyright © 2018 by The McGraw-Hill Companies, Inc. All rights reserved. 3-* Copyright © 2018 by The McGraw-Hill Companies, Inc. All rights reserved. McGraw-Hill/Irwin Product Design: Why Does Operations Care?Traditionally: throw design “over the wall”Today:must be able to make the product (process)technologyavailability of resourcesmust have the right
  • 41. type and amount of capacitymust deliver a quality product or servicemust have right inventory at right time Copyright © 2018 by The McGraw-Hill Companies, Inc. All rights reserved. 3-* Copyright © 2018 by The McGraw-Hill Companies, Inc. All rights reserved. Imagine a company’s R&D department spending 4 weeks in designing a product just to have the finance department send the plans back saying there’s no money in the budget for the required capital investment on equipment. R&D then redesigns its plans just to have the operations department inform them that they do not have the specialized personnel capable of producing the product. So then the plans go over to the human resources department where it’s discovered there would need to be a 4 month pipeline from recruiting, orienting, and training, to place the right personnel in position. When products are designed, they must simultaneously design the process. You must have the capability to make the product in house. You must set up your supply chain to support your product’s input needs. * McGraw-Hill/Irwin Strategies for New-Product IntroductionMarket Pull: “Make what we can sell”Organize resources to fulfill customer demandFood industry Technology Push: “Sell what we can make”Develop superior technologies and productsElectronics Interfunctional View: most difficultCross-functional design team – marketing, engineering, operations, financeChallenge to gain cooperation of all functionsConsider existing and new
  • 42. markets Copyright © 2018 by The McGraw-Hill Companies, Inc. All rights reserved. 3-* Copyright © 2018 by The McGraw-Hill Companies, Inc. All rights reserved. Product design follows from the development of a business strategy. The business strategy will include a value proposition that defines the target market, the differentiation of your product, and why the customer should buy from you. This is the starting point for designing a new product. These new-product designs should reflect the business strategy. There are three different ways to introduce new products. These approaches are called market pull, technology push, and interfunctional view. * McGraw-Hill/Irwin 3-* Not only is there a wall that blocks communication, there is also a language barrier. Not all departments speak the same business language. There’s the left-brain, right-brain theory. The theory is that people are either left-brained or right-brained, meaning that one side of their brain is dominant. If you’re mostly analytical and methodical in your thinking, you’re said to be left-brained. If you tend to be more creative or artistic, you’re thought to be right-brained. * McGraw-Hill/Irwin
  • 43. New Product Development ProcessConcept DevelopmentIdea generation and evaluation of alternative ideasProduct DesignDesign of the physical productDesign of the production processPilot Production/TestingTesting production prototypes (e.g., 3D printing)Finalizing production processFinalizing ‘information package’ specifying product and process design details Copyright © 2018 by The McGraw-Hill Companies, Inc. All rights reserved. 3-* Copyright © 2018 by The McGraw-Hill Companies, Inc. All rights reserved. Most firms have an organized new-product development (NPD) process that follows specific phases or prescribed steps. The typical phases followed by firms in developing new products are concept development where idea generation and the evaluation of alternative ideas for the new product are defined to meet specific market needs. Product design is the next phase concerned with designing the physical new product. At the end of this product design phase the company has a set of product specifications and digital images or engineering drawings specified in sufficient detail that production prototypes can be built and tested. In the third phase, products require testing of production prototypes before they are put into production. * McGraw-Hill/Irwin Cross-Functional Product DesignSequential approachFunctions
  • 44. (marketing, engineering, operations) work independently before passing work to next step. This is the ‘over the wall’ approach.Often results in misalignment of market needs, design, and production process.Concurrent approach Also called concurrent engineering.Functions cooperate, work together over the same time frame.Cross-functional teams.Not always “best” approach (e.g. high uncertainty of market or technology). Copyright © 2018 by The McGraw-Hill Companies, Inc. All rights reserved. 3-* Copyright © 2018 by The McGraw-Hill Companies, Inc. All rights reserved. The “over the wall” approach to product design is riddled with constant rework, redesign, and waste of scarce resources. In the concurrent approach, all functions are involved from the beginning, frequently by forming NPD teams. * McGraw-Hill/Irwin Supply Chain Collaboration Relationships with CustomersAsk right questionsAlign incentives to share knowledgeCreate collaborative technology platformInclude as advisors to design team Copyright © 2018 by The McGraw-Hill Companies, Inc. All rights reserved. 3-* Copyright © 2018 by The McGraw-Hill Companies, Inc. All rights reserved. Just as internal collaboration is important, so is external
  • 45. collaboration with supply chain customers and suppliers. While relationships with customers and suppliers often are established in new-product development, collaboration is something different, requiring actual participation in the design process. Remember, if customers determine value a company must value its customer relationships. * McGraw-Hill/Irwin Supply Chain Collaboration Criteria for Relationships with SuppliersTechnical expertiseCapabilities – cost, time, quality targetsCapacity availabilityLow risk Copyright © 2018 by The McGraw-Hill Companies, Inc. All rights reserved. 3-* Copyright © 2018 by The McGraw-Hill Companies, Inc. All rights reserved. Suppliers can be asked to join the NPD team or to provide input at critical points in the design process. Imagine a company designing a product simply to discover there are no suppliers capable of producing parts needed because they lack the capability in regards to labor cost, equipment cost (capital), throughput time, or expertise needed to producing a quality product. * McGraw-Hill/Irwin Quality Function Deployment (QFD)“House of Quality”Tool for interfunctional cooperationCustomer Attributes “Voice of the
  • 46. Customer”Engineering Characteristics “Voice of the Engineer”Helps identify tradeoffsCan include target values and competitive comparison Copyright © 2018 by The McGraw-Hill Companies, Inc. All rights reserved. 3-* Copyright © 2018 by The McGraw-Hill Companies, Inc. All rights reserved. Quality function deployment (QFD) is a tool for linking customer requirements as defined by the customer to technical specifications. QFD is very useful in translating the ordinary language obtained from the customers to technical requirements understood by engineers. It also facilitates interfunctional cooperation between marketing, engineering, and manufacturing. A customer’s use of terms like “light weight” can be translated by the engineering department as needing to qualify the use of different metals like aluminum, titanium, or carbon fiber. * McGraw-Hill/Irwin House of Quality (QFD) 3-* When using QFD, the company identifies various customer attributes. Each of these attributes can be met by one or more engineering characteristics of the product. By using the matrix shown here in Figure 3.4, the customer attributes on the left side of the matrix can be related to the engineering characteristics on the top of the matrix. When the matrix, is completed, it is called the “house of quality.”
  • 47. * McGraw-Hill/Irwin Modular DesignAllows greater variety through ‘mixing and matching’ modules Design, develop, and manage basic product components (modules) to use in multiple products Controls costs while maintaining customer choice Small number of components enables large number of combinations, e.g., Dell notebooks, IKEA cabinets Copyright © 2018 by The McGraw-Hill Companies, Inc. All rights reserved. 3-* Copyright © 2018 by The McGraw-Hill Companies, Inc. All rights reserved. Remember the saying that “time is money.” The faster we can produce a product, the less time we waste, and the more efficient we become. Also remember the “cookie cutter” concept that the more we can standardize a product, again, the less time we waste and, equally, more efficient we become. Usually products are designed one at a time without much regard for commonality of parts or modular properties that can aid production and still meet customer needs. Modular design makes it possible to have relatively high product variety and low component variety at the same time. The core idea is to develop a series of basic product components, or modules, that can be assembled into a large number of different products. To the customer, it appears there are a great number of different products. To operations, there are only a limited number of basic components and processes. Modular design is a prerequisite to mass customization. Also note that limiting the number of components in your raw materials inventory reduces
  • 48. ordering cost, limits touches, lowers transportation and holding costs. All leading to increased productivity while reducing expenses. * McGraw-Hill/Irwin Modular DesignVolkswagen A5/A5+ PlatformAudi A1Skoda RapidVW SantanaVW JettaVW VentoVW Polo Chrysler LX PlatformChrysler 300Dodge ChargerDodge Magnum wagonLancia Thema (Italian) Copyright © 2018 by The McGraw-Hill Companies, Inc. All rights reserved. 3-* Copyright © 2018 by The McGraw-Hill Companies, Inc. All rights reserved. Here are examples of modular components that are used by auto manufacturers. Common components are used to build multiple automobile models. * McGraw-Hill/Irwin Chapter 3 SummaryLO 3.1 Compare the three strategies for new product introduction.LO 3.2 Describe the three phases of new- product development.LO 3.3 Evaluate how concurrent engineering deals with misalignment.LO 3.4 Describe the criteria that should be used for supplier selection.LO 3.5 Evaluate an example of Quality Function Deployment. LO 3.6 Explain the benefits of modular design. Copyright © 2018 by The McGraw-Hill Companies, Inc. All
  • 49. rights reserved. 3-* Copyright © 2018 by The McGraw-Hill Companies, Inc. All rights reserved. 2-* Chapter 2: Operations and Supply Chain Strategy McGraw-Hill Education Copyright © 2018 by The McGraw-Hill Companies, Inc. All rights reserved. Copyright © 2018 by The McGraw-Hill Companies, Inc. All rights reserved. * There is an increasing awareness that operations and the supply chain contribute to the global competitive positon of a business and are not merely making a firm’s products or services. Operations should be fully connected to the business strategy and decisions should fulfill the needs of the business and add competitive advantage to the firm. 2-* Chapter 2 Learning Objectives LO 2.1 Define operations strategy. LO 2.2 Describe the elements of operations strategy and alignment with business and other functional strategies. LO 2.3 Differentiate the ways to compete with operations objectives.
  • 50. LO 2.4 Compare product imitator and innovator strategies.LO 2.5 Provide examples of a distinctive competence for operations.LO 2.6 Explain the nature of global operations and supply chains.LO 2.7 Describe two types of supply chain strategies.LO 2.8 Illustrate how operations can become more environmentally sustainable. Copyright © 2018 by The McGraw-Hill Companies, Inc. All rights reserved. Copyright © 2018 by The McGraw-Hill Companies, Inc. All rights reserved. Here are our Learning Objectives for this course. Between these videos, the textbook, supplemental readings, assignments and Discussion Boards, you will end the course with some new skills and many new insights. * 2-* Operations Strategy “A consistent pattern of business decisions for operations and the associated supply chain … … that are linked to the business strategy and other functional strategies, leading to a competitive advantage for the firm.” Copyright © 2018 by The McGraw-Hill Companies, Inc. All rights reserved. Copyright © 2018 by The McGraw-Hill Companies, Inc. All rights reserved. Dell Inc.: Using the supply chain to compete
  • 51. The personal computer (PC) sector was still in its infancy when, in 1983, medical student Michael Dell began buying up remainder stocks of outdated IBM PCs from local retailers. Dell upgraded the machines in his college dorm, then sold them at bargain prices to eager customers. By 1985 Dell Computer had switched from upgrading old IMBs to building its own machines. The machines themselves were technologically unremarkable, but it was the way in which they were sold - directly to the customer - that gave the upstart company a unique advantage over established PC makers. While industry leaders vied to introduce PCs with ever faster and more impressive technology, they gave little consideration to the mundane business of supply chain management. The computers they produced were invariably made-to-forecast and because of the way they were sold - through shops and resellers - were then destined to land on warehouse and shop shelves (inventory is money sitting on a shelf) for an average of two months before being purchased. Remember, inventory turnover is how companies turn to profit. Dell's own operations continued to be constantly re-examined (continuous improvement) to squeeze every possible moment of non-value adding time out of procurement and assemble processes. As a result, the total number of interventions or "touches" involved in the manufacture of a Dell PC had been reduced to 60, against an industry average of around 130. The simplification is facilitated in part by Dell's focus on common components. The supply chain is the network that links together the work and output of many different organizations. The purchasing function is responsible for finding other organizations to serve as sources and then buying the material and service inputs for the transformation process of the organization. The logistics function, in contrast, is typically responsible for the actual
  • 52. movement of goods and/or services across organizations. On the inbound side too Dell works to minimize inventory and increase return on capital employed. Many components are not ordered from a supplier before Dell receives a customer order. To achieve such levels of co-operation and integration, Dell progressively reduced its number or suppliers from 204 companies in 1992 to just 47 by 1997. By around 2003, 20 suppliers provided 75% of Dell's direct material purchase. "We have no inventory and no warehouses in any of our factories. Instead we're able to pull material into our factories based on actual orders..." (Dick Hunter, Dell VP Americas Manufacturing Operations). Bulky finished sub-assemblies, such as monitors and speakers, are treated differently. Instead of shipping them to Dell's factories, they were sent directly to the customer from the supplier's hub (located close to the market rather than close to Dell's factory), saving Dell approximately $30 per item in freight costs (now multiply that figure by millions of products sold each year). * 2-* Operations Strategy Process (Figure 2.1) Mission Objectives (cost, quality, flexibility, delivery)
  • 53. Strategic Decisions (process, quality system, capacity, inventory, and supply chain) Distinctive Competence Operations Strategy Functional strategies in marketing, finance, engineering, human resources, and information systems Corporate strategy The corporate strategy defines the business that the company is pursuing. The Walt Disney Corporation considers itself in the business of “making people happy.” The business strategy follows from the corporate strategy and defines how each particular business will compete within their industry. Michael Porter describes three generic business strategies: differentiation, low cost, and focus. Differentiation is associated with a unique and frequently innovative product or service, while low cost is pursued in commodity markets where the products or services ae imitative. Focus refers to the geographical or product portfolio being narrow or broad in nature. Focus can be combined with either a differentiation or low-cost strategy. Every operation should have a mission that is connected to the business strategy and is coordinated with the other functional strategy. For example, if the business strategy is differentiation through innovative products, the operations mission should emphasize new-product introduction and flexibility to adapt products to changing market needs. Other business strategies
  • 54. lead to other operations missions, such as low cost or fast delivery. The operations mission is thus derived from the particular business strategy selected by the business unit. At McDonald’s, the operations mission is to provide food and service quickly to customers with consistent quality and low cost in a clean and friendly environment. How then does McDonald’s turn its mission into reality? By setting operations objectives derived from the operations mission in quantitative and measurable terms. * 2-* Operations Strategic ObjectivesCost – resources usedQuality – conformance to customer expectationsDelivery – quickly and on timeFlexibility – ability to rapidly change operations Copyright © 2018 by The McGraw-Hill Companies, Inc. All rights reserved. Copyright © 2018 by The McGraw-Hill Companies, Inc. All rights reserved. How does a firm use these objectives to gain a competitive advantage? Remember Dell re-examines its operations to squeeze every possible moment of non-value adding time out of procurement and assemble processes. As a result, the total number of "touches" involved in the manufacture of a Dell PC had been reduced to 60, against an industry average of around 130. Simply put, less touches equals less time and fewer employees
  • 55. that results in saved costs. The simplification is facilitated in part by Dell's focus on common components. By using a modular design (to be discussed in a later chapter) of common components, Dell was able to reduce its inventory of raw materials and still offer a large variety of finished goods. The strategic objectives we seek to exploit (cost, quality, delivery, and flexibility) can be achieved by incorporating the right strategy into our operations. By reducing the amount of touches, we pay less employees. If we were to redesign a tool box that uses 24 parts (nuts, bolts, sides, handle, etc…) down to 2 parts (handle that snaps into a molded box), reducing the number of parts used to make the final product would reduce our overall ordering, transporting, holding, and carrying cost within the supply pipeline and work in progress. * 2-* Distinctive CompetenceThis operations capability is something an organization does better than any competing organization that adds value for the customer. Examples: patents, proprietary technology, operations innovations Copyright © 2018 by The McGraw-Hill Companies, Inc. All rights reserved. Copyright © 2018 by The McGraw-Hill Companies, Inc. All rights reserved. All operations should have a distinctive competence that differentiates it from the competitors. The distinctive competence is something that operations are difficult to imitate. Walmart has a mission to be the low-cost retailer. To achieve this mission it has developed a distinctive competence in cross-
  • 56. docking aimed at lowering the costs of shipping. Using cross- docking, goods from supplier’s trucks are transferred across the loading dock to waiting Walmart trucks and delivered to the stores without entering the warehouse. * 2-* Linking Operations to Business StrategiesBusiness strategy alternativesProduct ImitatorOperations must focus on keeping costs low. Product InnovatorOperations must maintain flexibility in processes, labor and suppliers. Customer perspectiveOrder Qualifiers: objectives customers consider in the product/serviceOrder Winners: objectives that cause customer to choose a particular product/service Copyright © 2018 by The McGraw-Hill Companies, Inc. All rights reserved. Copyright © 2018 by The McGraw-Hill Companies, Inc. All rights reserved. Let’s discuss how we can use the four operations objectives (cost, quality, delivery, and flexibility) that we discussed earlier to describe different ways to compete through operations. Most firms choose one or a few objectives to focus on, so that the strategic decisions made in operations can be aligned with and support these focused objectives. Not only should objectives be linked to an operations mission, operations strategic decisions should be linked to business strategy and to marketing and financial strategies as well. Table 2.3 of your text shows two diametrically opposite business strategies that can be selected and the resulting functional strategies.
  • 57. The first one is the product imitator (low-cost) business strategy, which is typical of a mature, price-sensitive market with a standardized product or service. When you see the word “standardized,” you must automatically think of a cookie-cutter mold. Products are all identically made with the same mold, increased production rate, little to no downtime, resulting in a low unit cost. The second business strategy is the product innovator and new- product introduction. This strategy typically is used in emerging and possible growing markets where advantage can be gained by bringing to market superior-quality products in a short amount of time. Price is not the dominant form of competition, and higher prices are charged, thereby putting a lower emphasis on costs. When asked to evaluate operations, you must immediately ask, what is the business strategy, mission, and objective of operations. The product imitator strategy should focus on mass distribution, repeat sales, a national sales force, and maximization of sales opportunities. In contrast, the product innovator strategy, you should focus on selective distribution, new-market development, product design, and perhaps sales through agents. * 2-* Example: McDonald’s Operations StrategyMission: fast product/service, consistent quality, low cost, clean/friendly environment Operations Objectives: cost, quality, service
  • 58. Strategic Decisions: process, quality, capacity, inventory, supply chain Distinctive Competence: today: continuous improvement of the transformation system, and brand (originally: unique service/supply chain) Copyright © 2018 by The McGraw-Hill Companies, Inc. All rights reserved. Copyright © 2018 by The McGraw-Hill Companies, Inc. All rights reserved. McDonald’s successfully links its mission statement directly into its operations objectives, then makes strategic decisions in the five operations decisions areas: Process: Specialized equipment and work flows ensure meals are delivered to customers quickly. Quality: More than 2,000 quality, food safety, and inspections monitor food as it moves from farms to suppliers to restaurants. Capacity: Restaurant capacity is carefully designed to control customers waiting times. Inventory: Just-in-time replenishment ensures food and packaging are available when needed. Food and packaging are highly standardized across restaurants. Supply Chain: Each restaurant is connected to its supply chain for fast replenishment. The supply chain is designed for frequent deliveries and to avoid stockouts. * 2-*
  • 59. Global Operations and Supply Chains“Traditional” (multi- country, multi-strategy) versus “Global” (single-strategy) firm.Characteristics of the “Global Corporation” differ from the traditional company.Rethink the supply chain (product design, process design, location, workforce policies). Copyright © 2018 by The McGraw-Hill Companies, Inc. All rights reserved. Copyright © 2018 by The McGraw-Hill Companies, Inc. All rights reserved. When operating in global markets, a company needs to be organized properly to produce and market its products. As a result, the global corporation has emerged with the following characteristics. Facilities and plants are located on a worldwide basis, not a country by country. * 2-* Supply Chain StrategyTo achieve competitive advantage for entire supply chain, rather than individual entities. Two supply chain strategies:Imitative Products (e.g. commodities)Predictable demandEfficient, low-cost supply chainInnovative Products (e.g. new technologies)Unpredictable demandFlexible, fast supply chain Firms design supply chain for each product/service or group of products/servicesAvoid “one size fits all” strategy. Copyright © 2018 by The McGraw-Hill Companies, Inc. All rights reserved. Copyright © 2018 by The McGraw-Hill Companies, Inc. All rights reserved.
  • 60. Supply chain strategy includes consideration of customers, suppliers, sourcing, and logistics in addition to operations. There is a focus on flows of inventory, materials, and information throughout the supply chain from the suppliers to the ultimate customer. A supply chain is the network of manufacturing and service operations that supply one another from raw materials through manufacturing to the ultimate customer. * 2-* Environment & Sustainable Operations Operations Sustainability: * minimizing or eliminating environmental impact of operations * social and financial viability of the firm for future generations Operations ‘greening’ may include:Eliminating air, water, landfill pollutionReducing energy consumptionMinimizing transportation and total carbon footprintWorking with suppliers to use recyclable and biodegradable packagingIncorporating product reuse, end-of-life return, recycling Copyright © 2018 by The McGraw-Hill Companies, Inc. All rights reserved. Copyright © 2018 by The McGraw-Hill Companies, Inc. All rights reserved. Sustainable operations have become an increasingly important part of operations and supply chain objectives and strategy. It refers to minimizing or eliminating the environmental impact of operations along with social and financial viability of the firm for future generations.
  • 61. * 2-* Chapter 2 Summary LO 2.1 Define operations strategy. LO 2.2 Describe the elements of operations strategy and alignment with business and other functional strategies. LO 2.3 Differentiate the ways to compete with operations objectives. LO 2.4 Compare product imitator and innovator strategies.LO 2.5 Provide examples of a distinctive competence for operations.LO 2.6 Explain the nature of global operations and supply chains.LO 2.7 Describe two types of supply chain strategies.LO 2.8 Illustrate how operations can become more environmentally sustainable. Copyright © 2018 by The McGraw-Hill Companies, Inc. All rights reserved. Copyright © 2018 by The McGraw-Hill Companies, Inc. All rights reserved. 1-* Chapter 1: The Operations Function Copyright © 2018 by The McGraw-Hill Companies, Inc. All rights reserved. Copyright © 2018 by The McGraw-Hill Companies, Inc. All rights reserved. *
  • 62. 1-* Chapter 1 Learning ObjectivesLO 1.1 Define operations management.LO 1.2 Describe the five main decisions made by operations and supply chain managers.LO 1.3 Explain the nature of cross-functional decision making with operations.LO 1.4 Define typical inputs and outputs of an operations transformation system.LO 1.5 Identify contemporary challenges facing operations and supply chain managers. Copyright © 2018 by The McGraw-Hill Companies, Inc. All rights reserved. Copyright © 2018 by The McGraw-Hill Companies, Inc. All rights reserved. 1-* Why Study Operations Management?Cross-functional nature of decisionsOperations is a major function in every organizationPrinciples of process thinking can be applied across the organizationOperations Management is an interesting and challenging field of study Copyright © 2018 by The McGraw-Hill Companies, Inc. All rights reserved. Copyright © 2018 by The McGraw-Hill Companies, Inc. All rights reserved. All organizations thrive by producing and delivering a good or a service deemed to be of value to customers. Value is the tangible and intangible benefits that customers derive from consuming a good or service at a price they are willing to pay. I often say McDonald’s makes the best hamburger in the fast
  • 63. food industry and students are fast to disagree because they immediately assume that I am focusing my statement only on “taste.” I immediately expand my previous statement by adding that McDonald’s does not sell customers a tasty hamburger, they sell a fast service, consistent quality, and low priced hamburger. It’s those three characteristics that customers determine are of “value” to them, more than the taste of the hamburger. Cross-functional teams (subject matter experts from across the organization’s departments) help define and set metrics to each value. The operations function of McDonald’s turns “fast service” into a series of processes (steps 1, 2, and 3) when converting their inputs into outputs that can be delivered to their customers in a timely manner that is of value. As we progress through this course we will discuss value adding and non-value adding steps. Learn now that customers will pay for value added activities. Non-value adding activities are considered wasteful and non-efficient. * 1-* Definition of Operations Management Operations management focuses on decisions for the production and delivery of the firm’s products and services. Copyright © 2018 by The McGraw-Hill Companies, Inc. All rights reserved. Copyright © 2018 by The McGraw-Hill Companies, Inc. All rights reserved. A success business plan turns $1.50 into $5.00 by converting inputs like raw materials sourced from suppliers into a finished good or service. The conversion of the input to the output is the
  • 64. cost ($1.50) of doing business and can be found on a company’s profit and loss statement under “expenses.” The $5.00 (revenue) is the sale price a customer is willing to pay for the good or service. The metrics used in the production process can be seen as standards or specifications operations managers focus on to decide how customer’s value needs will be met. * 1-* Three aspects of Operations Management Decisions: The operations manager must decide: Process, quality, capacity, inventory, and supply chain Function: Major functional areas in organizations: Operations, marketing, finance Process: Planning and controlling the transformation process and its interfaces (internal/external) Copyright © 2018 by The McGraw-Hill Companies, Inc. All rights reserved. Copyright © 2018 by The McGraw-Hill Companies, Inc. All rights reserved. * When you read the word “process” I want you to think “steps.” What steps (1, 2, 3, etc…) are needed to complete the process. Will the company produce 100% of its product or outsource 90% of the production and assemble raw materials into a finished product to complete the remaining 10% of production. What are the quality standards (or metrics) that will be set? If the goal is to produce only what you can sell (over and under production is wasteful and non-value adding activities that
  • 65. increase cost under expenses on the PNL) so determining the right capacity is critical to lean manufacturing. I call inventory “money sitting on a shelf.” Remember you spend a $1.50 to make $5.00, but until the product is sold or the service is delivered, inventory is $1.50 sitting on a shelf waiting to become revenue. Inventory turner is critical to the company’s success. When you convert $1.50 into $5.00, you earn a gross profit of $3.50. Your company’s goal should be to convert inputs into outputs (inventory turnover) as many times as possible to realize greater profits. The supply chain is the network of suppliers, subcontractors, distributors, and retailers used within your conversion or transformation processes. Every organization across the supply chain network will plan and control the flow of materials, money, and information to and from each other. 1-* Operations as a Process (Figure 1.2) Transformation (Conversion) Process Copyright © 2018 by The McGraw-Hill Companies, Inc. All rights reserved. Energy Materials Labor Capital
  • 66. Information Goods or Services Feedback information for control of process inputs and process technology Copyright © 2018 by The McGraw-Hill Companies, Inc. All rights reserved. Think of two separate companies that make the same product. Now think of their internal operations. Do these two companies convert their raw materials into a finished good using the same procedures? If you were to walk into a taco shop, the standard ordering, making, and delivering processes might be different than that of Chipotle’s fast food chain. In standard taco shop, you walk up to an order taking employee who takes your order first and charges you next. The order is then sent to the kitchen to fulfill your order request. The kitchen has the option of making your order from scratch before delivering it to your table or calling out your order number for pick up. At Chipotle’s, you enter on one side of the counter, place your order directly to the employee who will start an assembly process. This assembly process will follow a linear flow of adding pre-determined ingredients to complete the finished good (output). * 1-* Contemporary Operations ChallengesService and Manufacturing
  • 67. (differences and implications)Customer-Directed Operations (“voice of the customer”)Integration of Decisions Internally and ExternallyEnvironmental SustainabilityGlobalization of Operations and the Supply Chain Copyright © 2018 by The McGraw-Hill Companies, Inc. All rights reserved. Copyright © 2018 by The McGraw-Hill Companies, Inc. All rights reserved. As previously discussed, because customers determine value, time over taste, the metrics used in the operations process must focus on delivering a finished good to the customer in a timely manner. If the customer values costs, then the metrics or standards used will normally have a quality tradeoff. Because you want to “hear” what the customer is saying to determine what metrics or standards to set, it’s important that cross- functional teams that include marketing personnel or SMEs use the “voice of the customer” as their bases in the decision- making process. These decisions will be spread over the entire supply chain network, both externally and internally to meet delivery expectations. The external network can cover local, regional, national, and now global environments and must strive to minimize the negative impacts on our ecosystem and not endangering the ability to meet the needs of future generations. * 1-* Chapter 1 Summary LO 1.1 Define operations management.LO 1.2 Describe the five main decisions made by operations and supply chain managers.LO 1.3 Explain the nature of cross-functional decision making with operations.LO 1.4 Define typical inputs and outputs of an operations transformation system.LO 1.5
  • 68. Identify contemporary challenges facing operations and supply chain managers. Copyright © 2018 by The McGraw-Hill Companies, Inc. All rights reserved. Copyright © 2018 by The McGraw-Hill Companies, Inc. All rights reserved.