Download to read offline
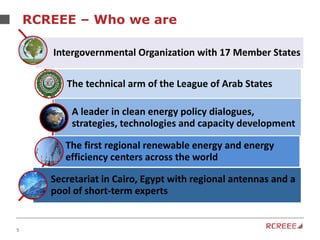
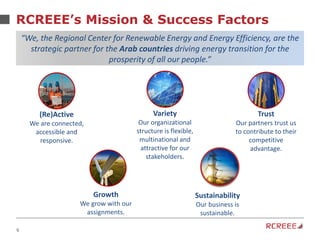
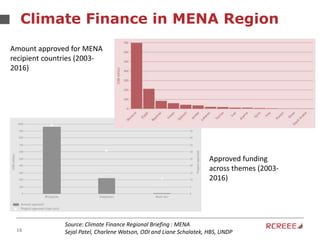
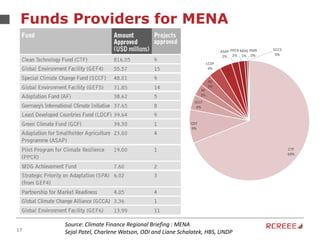
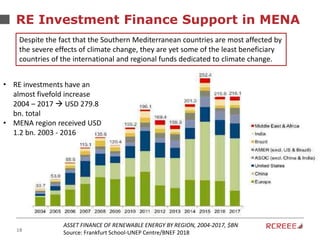


The document discusses the role and mission of the Regional Center for Renewable Energy and Energy Efficiency (RCREEE) in promoting clean energy in the Arab region. It highlights energy challenges, climate risks, and the need for regional coordination, while providing data on energy consumption, emissions, and mitigation targets among member states. Additionally, it addresses climate finance trends and the gap in funding for renewable energy projects across the region.


