SlideShare a Scribd company logo
1 of 16
Download to read offline
April 2021 Monthly Snapshot
One-Year Change in One-Year Change in
Median Sales Price Single
Family
Median Sales Price
Condo/TIC/Coop
2
3
4
5
6
7
8
9
10
11
12
13
14
15
16
Monthly Indicators
+ 12.1% - 5.9% + 3.3%
One-Year Change in
April was another strong month for home sales. The busy spring market
continues to see many multiple offer situations driving sales prices above
asking price. With such strong activity, by the time a property sale closes, the
market may have already moved higher than that sold price suggests. Such
markets can create stress and frustration for prospective homebuyers, who are
frequently having to submit offers on multiple properties before they are able to
secure a purchase.
New Listings were up 37.1 percent for single family homes and 43.7 percent for
Condo/TIC/Coop properties. Pending Sales increased 249.4 percent for single
family homes and 396.7 percent for Condo/TIC/Coop properties.
The Median Sales Price was up 12.1 percent to $1,800,000 for single family
homes but decreased 5.9 percent to $1,200,000 for Condo/TIC/Coop
properties. Months Supply of Inventory decreased 45.5 percent for single family
units and 22.4 percent for Condo/TIC/Coop units.
In the spirit of the great Wayne Gretzky, buyers, sellers, and their agents are all
trying their best to skate to where the puck, or rather, the housing market, is
going, not where it has been. While housing affordability remains an area to
watch as prices continue to rise, strong buyer demand and limited housing
supply show no signs of easing soon, pointing to a continuation of this market
trend through spring and into summer.
Median Sales Price
All Property Types
Residential real estate activity in San Francisco County (Districts 1-10)
composed of single-family properties, townhomes and condominiums. Percent
changes are calculated using rounded figures.
Single Family Activity Overview
Months Supply of Inventory
Current as of May 11, 2021. All data from the San Francisco MLS. Report © 2021 ShowingTime.
Condo/TIC/Coop Activity Overview
Inventory of Active Listings
% of Properties Sold Over List Price
% of List Price Received
Housing Affordability Ratio
All Properties Activity Overview
New Listings
Pending Sales
Sold Listings
Median Sales Price
Average Sales Price
Days on Market Until Sale
Activity by District
Single Family Activity Overview
Key metrics by report month and for year-to-date (YTD) starting from the first of the year.
Key Metrics Historical Sparkbars 4-2020 4-2021 Percent Change YTD 2020 YTD 2021 Percent Change
Current as of May 11, 2021. All data from the San Francisco MLS. Report © 2021 ShowingTime. | 2
Months Supply 3.3 1.8 - 45.5% -- -- --
Affordability Ratio 34 31 - 8.8%
% of List Price Received 108.8% 113.8% + 4.6% 110.9%
35
71.0% - 1.5%
+ 0.1%
33 - 5.7%
111.0%
% of Properties Sold Over List Price 70.0% 76.2% + 8.9% 72.1%
Active Listings 606 454 - 25.1% --
Avg. Sales Price $2,183,677 $2,443,828 + 11.9% $2,053,979
Days on Market 20 19 - 5.0% 25 25 0.0%
$2,253,689
-- --
Median Sales Price $1,605,000 $1,800,000 + 12.1% $1,570,000
Sold Listings 120 286 + 138.3% 539
New Listings 175 240 + 37.1% 879
Pending Sales 79 276 + 249.4% + 86.1%
517 962
+ 19.7%
1,052
876 + 62.5%
$1,710,000 + 8.9%
+ 9.7%
4-2018 4-2019 4-2020 4-2021
4-2018 4-2019 4-2020 4-2021
4-2018 4-2019 4-2020 4-2021
4-2018 4-2019 4-2020 4-2021
4-2018 4-2019 4-2020 4-2021
4-2018 4-2019 4-2020 4-2021
4-2018 4-2019 4-2020 4-2021
4-2018 4-2019 4-2020 4-2021
4-2018 4-2019 4-2020 4-2021
4-2018 4-2019 4-2020 4-2021
4-2018 4-2019 4-2020 4-2021
Condo/TIC/Coop Activity Overview
Key metrics by report month and for year-to-date (YTD) starting from the first of the year.
Key Metrics Historical Sparkbars 4-2020 4-2021 Percent Change YTD 2020 YTD 2021 Percent Change
Current as of May 11, 2021. All data from the San Francisco MLS. Report © 2021 ShowingTime. | 3
Months Supply 4.9 3.8 - 22.4% -- -- --
Affordability Ratio 51 55 + 7.8%
% of List Price Received 105.3% 103.8% - 1.4% 103.8%
53
38.2% - 30.3%
- 1.9%
55 + 3.8%
101.8%
% of Properties Sold Over List Price 59.8% 45.6% - 23.7% 54.8%
Active Listings 1,065 1,211 + 13.7% --
Avg. Sales Price $1,347,363 $1,352,237 + 0.4% $1,337,510
Days on Market 32 44 + 37.5% 36
$1,190,000 - 2.5%
- 0.7%
53 + 47.2%
$1,328,647
-- --
Sold Listings 117 441 + 276.9% 682 1,441 + 111.3%
Median Sales Price $1,275,000 $1,200,000 - 5.9% $1,220,000
+ 46.8%
Pending Sales 92 457 + 396.7% 663 1,596 + 140.7%
New Listings 229 329 + 43.7% 1,268 1,861
4-2018 4-2019 4-2020 4-2021
4-2018 4-2019 4-2020 4-2021
4-2018 4-2019 4-2020 4-2021
4-2018 4-2019 4-2020 4-2021
4-2018 4-2019 4-2020 4-2021
4-2018 4-2019 4-2020 4-2021
4-2018 4-2019 4-2020 4-2021
4-2018 4-2019 4-2020 4-2021
4-2018 4-2019 4-2020 4-2021
4-2018 4-2019 4-2020 4-2021
4-2018 4-2019 4-2020 4-2021
New Listings
strong month for
home sales. The
busy spring market
Single
Family
Year-Over-Year
Change
Condo/TIC/
Coop
Year-Over-Year
Change
May-2020 274 -11.3% 503 +34.5%
Jun-2020 359 +34.0% 579 +89.2%
Jul-2020 407 +75.4% 695 +112.5%
Aug-2020 353 +29.3% 649 +96.1%
Sep-2020 356 +1.7% 662 +26.8%
Oct-2020 369 +33.2% 520 +44.0%
Nov-2020 239 +41.4% 248 +46.7%
Dec-2020 145 +52.6% 239 +82.4%
Jan-2021 245 -5.0% 512 +35.1%
Feb-2021 278 +2.2% 470 +16.0%
Mar-2021 289 +66.1% 550 +115.7%
Apr-2021 240 +37.1% 329 +43.7%
12-Month Avg 296 +24.6% 496 +57.2%
Historical New Listings by Month
Current as of May 11, 2021. All data from the San Francisco MLS. Report © 2021 ShowingTime. | 4
A count of the properties that have been newly listed on the market in a given month.
276
367
175
229
240
329
Single Family Condo/TIC/Coop
April
0
200
400
600
800
1-2005 1-2006 1-2007 1-2008 1-2009 1-2010 1-2011 1-2012 1-2013 1-2014 1-2015 1-2016 1-2017 1-2018 1-2019 1-2020 1-2021
Single Family Condo/TIC/Coop
1,003
1,429
879
1,268
1,052
1,861
Single Family Condo/TIC/Coop
Year to Date
2019 2020 2021
+ 43.7%
- 37.6%
+ 37.1%
- 36.6% - 11.3%
+ 19.7%
- 12.4% + 46.8%
2019 2020 2021 2019 2020 2021 2019 2020 2021
- 6.1% - 4.8% - 4.2%
- 4.2%
Pending Sales
strong month for
home sales. The
busy spring market
Single
Family
Year-Over-Year
Change
Condo/TIC/
Coop
Year-Over-Year
Change
May-2020 162 -40.7% 141 -57.7%
Jun-2020 227 +8.6% 234 -5.3%
Jul-2020 276 +29.6% 242 +12.6%
Aug-2020 235 +37.4% 322 +54.8%
Sep-2020 281 +29.5% 305 +33.2%
Oct-2020 311 +17.8% 333 +5.4%
Nov-2020 307 +38.3% 299 +26.2%
Dec-2020 209 +57.1% 306 +100.0%
Jan-2021 174 +47.5% 292 +81.4%
Feb-2021 224 +51.4% 377 +66.1%
Mar-2021 288 +67.4% 470 +156.8%
Apr-2021 276 +249.4% 457 +396.7%
12-Month Avg 248 +33.8% 315 +45.3%
Historical Pending Sales by Month
A count of the properties on which offers have been accepted in a given month.
Current as of May 11, 2021. All data from the San Francisco MLS. Report © 2021 ShowingTime. | 5
251
307
79 92
276
457
Single Family Condo/TIC/Coop
April
0
100
200
300
400
500
1-2005 1-2006 1-2007 1-2008 1-2009 1-2010 1-2011 1-2012 1-2013 1-2014 1-2015 1-2016 1-2017 1-2018 1-2019 1-2020 1-2021
Single Family Condo/TIC/Coop
743
969
517
663
962
1,596
Single Family Condo/TIC/Coop
Year to Date
2019 2020 2021
+ 396.7%
- 70.0%
+ 249.4%
- 68.5% - 31.6%
+ 86.1%
- 30.4% + 140.7%
2019 2020 2021 2019 2020 2021 2019 2020 2021
+ 6.8% - 1.3% - 6.7%
+ 5.5%
Sold Listings
strong month for
home sales. The
busy spring market
Single
Family
Year-Over-Year
Change
Condo/TIC/
Coop
Year-Over-Year
Change
May-2020 114 -57.9% 114 -65.8%
Jun-2020 181 -12.6% 177 -32.2%
Jul-2020 238 -0.4% 266 +6.8%
Aug-2020 243 +24.6% 240 +12.1%
Sep-2020 257 +77.2% 323 +75.5%
Oct-2020 305 +10.9% 292 +8.6%
Nov-2020 284 +26.8% 341 +25.8%
Dec-2020 301 +43.3% 353 +54.1%
Jan-2021 161 +47.7% 268 +77.5%
Feb-2021 162 +23.7% 278 +56.2%
Mar-2021 267 +49.2% 454 +92.4%
Apr-2021 286 +138.3% 441 +276.9%
12-Month Avg 233 +21.4% 296 +31.8%
Historical Sold Listings by Month
A count of the actual sales that closed in a given month.
Current as of May 11, 2021. All data from the San Francisco MLS. Report © 2021 ShowingTime. | 6
249
325
120 117
286
441
Single Family Condo/TIC/Coop
April
0
100
200
300
400
500
1-2005 1-2006 1-2007 1-2008 1-2009 1-2010 1-2011 1-2012 1-2013 1-2014 1-2015 1-2016 1-2017 1-2018 1-2019 1-2020 1-2021
Single Family Condo/TIC/Coop
675
879
539
682
876
1,441
Single Family Condo/TIC/Coop
Year to Date
2019 2020 2021
+ 276.9%
- 64.0%
+ 138.3%
- 51.8% - 22.4%
+ 62.5%
- 20.1% + 111.3%
2019 2020 2021 2019 2020 2021 2019 2020 2021
+ 15.8% + 0.7% - 7.6%
+ 8.0%
Median Sales Price
strong month for
home sales. The
busy spring market
Single
Family
Year-Over-Year
Change
Condo/TIC/
Coop
Year-Over-Year
Change
May-2020 $1,587,500 -2.0% $1,087,500 -11.2%
Jun-2020 $1,730,000 -1.1% $1,225,000 -5.4%
Jul-2020 $1,604,000 +3.5% $1,260,700 +5.1%
Aug-2020 $1,625,000 +1.6% $1,210,000 -2.1%
Sep-2020 $1,650,000 +8.2% $1,175,000 -9.6%
Oct-2020 $1,605,000 +0.3% $1,152,500 -11.4%
Nov-2020 $1,637,500 +7.2% $1,172,125 +0.2%
Dec-2020 $1,550,000 +11.7% $1,100,000 -7.2%
Jan-2021 $1,575,000 +7.9% $1,072,500 -7.2%
Feb-2021 $1,655,000 +2.8% $1,196,500 -5.0%
Mar-2021 $1,730,000 +9.8% $1,220,000 -2.4%
Apr-2021 $1,800,000 +12.1% $1,200,000 -5.9%
12-Month Avg* $1,650,000 +5.1% $1,180,000 -3.7%
Historical Median Sales Price by Month
Point at which half of the sales sold for more and half sold for less, not accounting for seller concessions, in a given month.
* Median Sales Price for all properties from May 2020 through April 2021. This is not the average
of the individual figures above.
Current as of May 11, 2021. All data from the San Francisco MLS. Report © 2021 ShowingTime. | 7
$1,600,000
$1,225,000
$1,605,000
$1,275,000
$1,800,000
$1,200,000
Single Family Condo/TIC/Coop
April
$500,000
$750,000
$1,000,000
$1,250,000
$1,500,000
$1,750,000
$2,000,000
1-2005 1-2006 1-2007 1-2008 1-2009 1-2010 1-2011 1-2012 1-2013 1-2014 1-2015 1-2016 1-2017 1-2018 1-2019 1-2020 1-2021
Single Family Condo/TIC/Coop
$1,540,000
$1,175,000
$1,570,000
$1,220,000
$1,710,000
$1,190,000
Single Family Condo/TIC/Coop
Year to Date
2019 2020 2021
- 5.9%
+ 4.1%
+ 12.1%
+ 0.3% + 3.8%
+ 8.9%
+ 1.9% - 2.5%
2019 2020 2021 2019 2020 2021 2019 2020 2021
0.0% - 2.5% + 0.8%
+ 0.4%
Average Sales Price
strong month for
home sales. The
busy spring market
Single
Family
Year-Over-Year
Change
Condo/TIC/
Coop
Year-Over-Year
Change
May-2020 $1,877,767 -9.1% $1,251,342 -4.7%
Jun-2020 $2,200,915 +3.2% $1,415,327 -0.6%
Jul-2020 $2,013,417 +5.5% $1,397,387 +8.7%
Aug-2020 $1,987,092 +8.7% $1,326,561 -2.7%
Sep-2020 $1,896,046 -4.6% $1,306,022 -9.2%
Oct-2020 $1,907,545 +1.7% $1,252,476 -12.2%
Nov-2020 $2,035,750 +6.6% $1,270,960 -3.1%
Dec-2020 $2,014,010 +9.1% $1,281,834 +2.7%
Jan-2021 $1,951,746 -8.2% $1,209,875 -4.6%
Feb-2021 $2,266,482 +18.6% $1,344,643 -0.5%
Mar-2021 $2,224,329 +9.6% $1,366,049 -0.0%
Apr-2021 $2,443,828 +11.9% $1,352,237 +0.4%
12-Month Avg* $2,072,946 +5.2% $1,316,966 -2.1%
Historical Average Sales Price by Month
Average sales price for all closed sales, not accounting for seller concessions, in a given month.
* Avg. Sales Price for all properties from May 2020 through April 2021. This is not the average of
the individual figures above.
Current as of May 11, 2021. All data from the San Francisco MLS. Report © 2021 ShowingTime. | 8
$2,181,450
$1,350,269
$2,183,677
$1,347,363
$2,443,828
$1,352,237
Single Family Condo/TIC/Coop
April
$500,000
$1,000,000
$1,500,000
$2,000,000
$2,500,000
$3,000,000
1-2005 1-2006 1-2007 1-2008 1-2009 1-2010 1-2011 1-2012 1-2013 1-2014 1-2015 1-2016 1-2017 1-2018 1-2019 1-2020 1-2021
Single Family Condo/TIC/Coop
$1,975,984
$1,318,201
$2,053,979
$1,337,510
$2,253,689
$1,328,647
Single Family Condo/TIC/Coop
Year to Date
2019 2020 2021
+ 0.4%
- 0.2%
+ 11.9%
+ 0.1% + 1.5%
+ 9.7%
+ 3.9% - 0.7%
2019 2020 2021 2019 2020 2021 2019 2020 2021
+ 3.9% + 0.8% + 1.1%
+ 3.1%
Days on Market Until Sale
strong month for
home sales. The
busy spring market
Single
Family
Year-Over-Year
Change
Condo/TIC/
Coop
Year-Over-Year
Change
May-2020 24 +9.1% 40 +33.3%
Jun-2020 26 +18.2% 34 +6.3%
Jul-2020 25 +8.7% 38 +15.2%
Aug-2020 24 -7.7% 40 +17.6%
Sep-2020 25 -7.4% 45 +32.4%
Oct-2020 27 +22.7% 41 +41.4%
Nov-2020 33 +37.5% 50 +51.5%
Dec-2020 35 +16.7% 62 +29.2%
Jan-2021 37 +2.8% 70 +14.8%
Feb-2021 30 +20.0% 62 +121.4%
Mar-2021 23 +9.5% 45 +66.7%
Apr-2021 19 -5.0% 44 +37.5%
12-Month Avg* 27 +11.3% 48 +40.6%
Historical Days on Market Until Sale by Month
Average number of days between when a property is listed and when an offer is accepted in a given month.
* Days on Market for all properties from May 2020 through April 2021. This is not the average of
the individual figures above.
Current as of May 11, 2021. All data from the San Francisco MLS. Report © 2021 ShowingTime. | 9
27
38
20
32
19
44
Single Family Condo/TIC/Coop
April
0
20
40
60
80
100
120
1-2005 1-2006 1-2007 1-2008 1-2009 1-2010 1-2011 1-2012 1-2013 1-2014 1-2015 1-2016 1-2017 1-2018 1-2019 1-2020 1-2021
Single Family Condo/TIC/Coop
29
40
25
36
25
53
Single Family Condo/TIC/Coop
Year to Date
2019 2020 2021
+ 37.5%
- 15.8%
- 5.0%
- 25.9% - 10.0%
0.0%
- 13.8% + 47.2%
2019 2020 2021 2019 2020 2021 2019 2020 2021
+ 50.0% + 31.8% + 21.2%
+ 46.2%
Inventory of Active Listings
strong month for
home sales. The
busy spring market
Single
Family
Year-Over-Year
Change
Condo/TIC/
Coop
Year-Over-Year
Change
May-2020 685 +32.2% 1,336 +61.0%
Jun-2020 780 +45.5% 1,561 +84.7%
Jul-2020 857 +65.1% 1,920 +117.7%
Aug-2020 920 +55.9% 2,096 +124.4%
Sep-2020 926 +36.2% 2,305 +103.1%
Oct-2020 921 +43.0% 2,337 +114.0%
Nov-2020 783 +42.4% 2,070 +122.6%
Dec-2020 572 +45.5% 1,473 +106.0%
Jan-2021 564 +15.3% 1,550 +79.0%
Feb-2021 571 -2.1% 1,511 +53.4%
Mar-2021 522 -5.1% 1,436 +44.8%
Apr-2021 454 -25.1% 1,211 +13.7%
12-Month Avg* 713 +28.5% 1,734 +84.6%
Historical Inventory of Active Listings by Month
The number of properties available for sale in active status at the end of a given month.
* Active Listings for all properties from May 2020 through April 2021. This is not the average of
the individual figures above.
Current as of May 11, 2021. All data from the San Francisco MLS. Report © 2021 ShowingTime. | 10
512
838
606
1,065
454
1,211
Single Family Condo/TIC/Coop
April
0
500
1,000
1,500
2,000
2,500
1-2005 1-2006 1-2007 1-2008 1-2009 1-2010 1-2011 1-2012 1-2013 1-2014 1-2015 1-2016 1-2017 1-2018 1-2019 1-2020 1-2021
Single Family Condo/TIC/Coop
2019 2020 2021
+ 13.7%
+ 27.1%
- 25.1%
+ 18.4%
2019 2020 2021
+ 6.2% + 6.9%
% of Properties Sold Over List Price
strong month for
home sales. The
busy spring market
Single
Family
Year-Over-Year
Change
Condo/TIC/
Coop
Year-Over-Year
Change
May-2020 63.2% -21.4% 42.1% -33.6%
Jun-2020 55.2% -31.6% 31.1% -51.4%
Jul-2020 64.7% -21.1% 44.4% -36.5%
Aug-2020 65.8% -20.3% 34.2% -40.5%
Sep-2020 65.0% -12.8% 34.4% -41.4%
Oct-2020 67.5% -16.0% 42.8% -33.8%
Nov-2020 61.6% -20.2% 32.8% -49.2%
Dec-2020 63.1% -7.6% 28.6% -38.8%
Jan-2021 58.4% -6.7% 21.6% -33.5%
Feb-2021 68.5% -6.5% 35.3% -44.4%
Mar-2021 74.5% -4.7% 42.5% -29.4%
Apr-2021 76.2% +8.9% 45.6% -23.7%
12-Month Avg 66.0% -14.4% 36.7% -38.7%
Historical % of Properties Sold Over List Price by Month
Percentage found when dividing the number of properties sold by properties sold over its original list price, not accounting for seller
concessions.
* % of Properties Sold Over List Price for all properties from May 2020 through April 2021. This is
not the average of the individual figures above.
Current as of May 11, 2021. All data from the San Francisco MLS. Report © 2021 ShowingTime. | 11
73.1%
55.7%
70.0%
59.8%
76.2%
45.6%
Single Family Condo/TIC/Coop
April
0.0%
20.0%
40.0%
60.0%
80.0%
100.0%
1-2005 1-2006 1-2007 1-2008 1-2009 1-2010 1-2011 1-2012 1-2013 1-2014 1-2015 1-2016 1-2017 1-2018 1-2019 1-2020 1-2021
Single Family Condo/TIC/Coop
71.7%
52.6%
72.1%
54.8%
71.0%
38.2%
Single Family Condo/TIC/Coop
Year to Date
2019 2020 2021
- 23.7%
+ 7.4%
+ 8.9%
- 4.2% + 4.2%
- 1.5%
+ 0.6% - 30.3%
2019 2020 2021 2019 2020 2021 2019 2020 2021
- 7.0% - 7.2% - 8.2%
- 16.6%
% of List Price Received
strong month for
home sales. The
busy spring market
Single
Family
Year-Over-Year
Change
Condo/TIC/
Coop
Year-Over-Year
Change
May-2020 105.8% -6.4% 100.4% -6.0%
Jun-2020 105.6% -8.2% 99.9% -6.8%
Jul-2020 106.0% -8.0% 101.0% -6.0%
Aug-2020 107.5% -6.1% 100.4% -4.7%
Sep-2020 106.8% -5.2% 100.2% -4.5%
Oct-2020 108.1% -4.8% 101.3% -4.3%
Nov-2020 106.0% -5.3% 100.2% -4.7%
Dec-2020 106.0% -3.5% 99.3% -3.6%
Jan-2021 105.3% -1.6% 98.6% -1.8%
Feb-2021 109.8% -1.6% 100.7% -4.3%
Mar-2021 112.3% -1.6% 102.4% -1.6%
Apr-2021 113.8% +4.6% 103.8% -1.4%
12-Month Avg* 108.0% -4.2% 100.9% -4.2%
Historical % of List Price Received by Month
Percentage found when dividing a property’s sales price by its most recent list price, then taking the average for all properties sold in a given
month, not accounting for seller concessions.
* % of List Price Received for all properties from May 2020 through April 2021. This is not the
average of the individual figures above.
Current as of May 11, 2021. All data from the San Francisco MLS. Report © 2021 ShowingTime. | 12
111.6%
104.9%
108.8%
105.3%
113.8%
103.8%
Single Family Condo/TIC/Coop
April
110.6%
104.0%
110.9%
103.8%
111.0%
101.8%
Single Family Condo/TIC/Coop
Year to Date
90.0%
100.0%
110.0%
120.0%
130.0%
1-2005 1-2006 1-2007 1-2008 1-2009 1-2010 1-2011 1-2012 1-2013 1-2014 1-2015 1-2016 1-2017 1-2018 1-2019 1-2020 1-2021
Single Family Condo/TIC/Coop
2019 2020 2021
- 1.4%
+ 0.4%
+ 4.6%
- 2.5%
2019 2020 2021
- 6.4% - 3.9%
2019 2020 2021
- 1.9%
- 0.2%
+ 0.1%
+ 0.3%
2019 2020 2021
- 5.3% - 2.3%
Housing Affordability Ratio
strong month for
home sales. The
busy spring market
Single
Family
Year-Over-Year
Change
Condo/TIC/
Coop
Year-Over-Year
Change
May-2020 35 +12.9% 59 +22.9%
Jun-2020 32 +10.3% 54 +20.0%
Jul-2020 35 +6.1% 53 +6.0%
Aug-2020 35 +2.9% 56 +9.8%
Sep-2020 35 0.0% 57 +18.8%
Oct-2020 36 +5.9% 59 +20.4%
Nov-2020 35 +2.9% 59 +13.5%
Dec-2020 37 -2.6% 62 +19.2%
Jan-2021 36 -2.7% 63 +14.5%
Feb-2021 33 -2.9% 53 +3.9%
Mar-2021 31 -6.1% 53 +8.2%
Apr-2021 31 -8.8% 55 +7.8%
12-Month Avg* 34 -8.2% 34 +9.9%
Historical Housing Affordability Ratio by Month
This index measures housing affordability for the region. For example, an index of 120 means the median household income is 120% of what is
necessary to qualify for the median-priced home under prevailing interest rates. A higher number means greater affordability.
* Affordability Ratio for all properties from May 2020 through April 2021. This is not the average of
the individual figures above.
Current as of May 11, 2021. All data from the San Francisco MLS. Report © 2021 ShowingTime. | 13
31
48
34
51
31
55
Single Family Condo/TIC/Coop
April
20
40
60
80
100
1-2005 1-2006 1-2007 1-2008 1-2009 1-2010 1-2011 1-2012 1-2013 1-2014 1-2015 1-2016 1-2017 1-2018 1-2019 1-2020 1-2021
Single Family Condo/TIC/Coop
2019 2020 2021
+ 7.8%
+ 6.3%
- 8.8%
+ 9.7%
2019 2020 2021
+ 3.3% + 4.3%
33
50
35
53
33
55
Single Family Condo/TIC/Coop
Year to Date
2019 2020 2021
+ 3.8%
+ 6.0%
- 5.7%
+ 6.1%
2019 2020 2021
+ 6.5% + 4.2%
Months Supply of Inventory
strong month for
home sales. The
busy spring market
Single
Family
Year-Over-Year
Change
Condo/TIC/
Coop
Year-Over-Year
Change
May-2020 3.9 +56.0% 6.7 +103.0%
Jun-2020 4.4 +69.2% 7.8 +122.9%
Jul-2020 4.7 +88.0% 9.5 +156.8%
Aug-2020 4.9 +69.0% 9.9 +153.8%
Sep-2020 4.8 +45.5% 10.6 +125.5%
Oct-2020 4.7 +46.9% 10.7 +137.8%
Nov-2020 3.8 +40.7% 9.2 +142.1%
Dec-2020 2.7 +42.1% 6.2 +106.7%
Jan-2021 2.6 +8.3% 6.3 +80.0%
Feb-2021 2.6 -10.3% 5.8 +45.0%
Mar-2021 2.3 -17.9% 5.0 +19.0%
Apr-2021 1.8 -45.5% 3.8 -22.4%
12-Month Avg* 3.6 +31.1% 7.6 +94.1%
Historical Months Supply of Inventory by Month
The inventory of homes for sale at the end of a given month, divided by the average monthly pending sales from the last 12 months.
* Months Supply for all properties from May 2020 through April 2021. This is not the average of
the individual figures above.
Current as of May 11, 2021. All data from the San Francisco MLS. Report © 2021 ShowingTime. | 14
2.5
3.4
3.3
4.9
1.8
3.8
Single Family Condo/TIC/Coop
April
0.0
2.0
4.0
6.0
8.0
10.0
12.0
1-2005 1-2006 1-2007 1-2008 1-2009 1-2010 1-2011 1-2012 1-2013 1-2014 1-2015 1-2016 1-2017 1-2018 1-2019 1-2020 1-2021
Single Family Condo/TIC/Coop
2019 2020 2021
- 22.4%
+ 44.1%
- 45.5%
+ 32.0%
2019 2020 2021
+ 8.7% + 9.7%
All Properties Activity Overview
Key metrics by report month and for year-to-date (YTD) starting from the first of the year.
Key Metrics Historical Sparkbars 4-2020 4-2021 Percent Change YTD 2020 YTD 2021 Percent Change
Current as of May 11, 2021. All data from the San Francisco MLS. Report © 2021 ShowingTime. | 15
Months Supply 4.1 3.0 - 26.8% -- -- --
Affordability Ratio 37 37 0.0%
% of List Price Received 107.1% 107.8% + 0.7% 106.8%
40
50.5% - 18.9%
- 1.4%
40 0.0%
105.3%
% of Properties Sold Over List Price 64.9% 57.7% - 11.1% 62.3%
Active Listings 1,704 1,701 - 0.2% --
Avg. Sales Price $1,770,982 $1,780,886 + 0.6% $1,655,659
Days on Market 26 34 + 30.8% 31
$1,360,000 - 1.1%
+ 1.6%
43 + 38.7%
$1,681,434
-- --
Sold Listings 242 736 + 204.1% 1,249 2,348 + 88.0%
Median Sales Price $1,380,000 $1,425,000 + 3.3% $1,375,000
+ 34.6%
Pending Sales 175 740 + 322.9% 1,207 2,585 + 114.2%
New Listings 411 583 + 41.8% 2,195 2,955
4-2018 4-2019 4-2020 4-2021
4-2018 4-2019 4-2020 4-2021
4-2018 4-2019 4-2020 4-2021
4-2018 4-2019 4-2020 4-2021
4-2018 4-2019 4-2020 4-2021
4-2018 4-2019 4-2020 4-2021
4-2018 4-2019 4-2020 4-2021
4-2018 4-2019 4-2020 4-2021
4-2018 4-2019 4-2020 4-2021
4-2018 4-2019 4-2020 4-2021
4-2018 4-2019 4-2020 4-2021
Activity by District
SF District 1: Northwest (Sea Cliff, Lake, Jordan Park / Laurel Heights, Outer Richmond, Central Ric April was
SF District 2: Central West (Outer Sunset, Central Sunset, Inner Sunset, Outer Parkside, Parkside, Inner Parkside, Golden Gate Heights)
SF District 3: Southwest (Pine Lake Park, Lake Shore, Merced Manor, Stonestown, Lakeside, Merced Heights, Ingleside, Ingleside Heights, Oceanview)
SF District 4: Twin Peaks W (Forest Hill (& Ext), W Portal, St Francis Wd, Balboa Terr, Mt Dav Manor, Ingleside Terr, Monterey Hts, Wstwd Pk & H'lnds, Shrwd Fst, Miraloma Pk, Dmnd Hts, Mdtwn Terr)
SF District 5: Central (Haight Ashbury, Cole Vly / Prnssus Hts, Clarndn Hts, Corona Hts, Twin Pks, Glen Pk, Noe Vly, Eureka Vly / Dolores Hts, Mission Dolores, Duboce Trngl, Buena Vista / Ashbury Hts)
SF District 6: Central North (Lower Pacific Heights, Anza Vista, Western Addition, North Panhandle, Alamo Square, Hayes Valley)
SF District 7: North (Marina, Cow Hollow, Presidio Heights, Pacific Heights)
SF District 8: Northeast (North Waterfront, North Beach, Russian Hill, Telegraph Hill, Nob Hill, Financial District / Barbary Coast, Downtown, Van Ness / Civic Center, Tenderloin)
SF District 9: Central East (Yerba Buena, South Beach, South of Market, Mission Bay, Inner Mission, Potrero Hill, Central Waterfront / Dogpatch, Bernal Heights)
SF District 10: Southeast (Outer Mission, Mission Terr, Excelsior, Portola, Bayview, Silver Terr, Hunters Pt, Candlestick Pt, Bayview Hts, Little Hollywood, Visitation Vly, Crocker Amazon)
4-2020 4-2021 + / – 4-2020 4-2021 + / – 4-2020 4-2021 + / – 4-2020 4-2021 + / – 4-2020 4-2021 + / –
Single Family
1 SF District 1 60 23 -61.7% 9 17 +88.9% $1,765,000 $2,482,000 +40.6% 25 20 -20.0% 3.7 1.1 -70.3%
2 SF District 2 57 44 -22.8% 18 57 +216.7% $1,415,000 $1,688,000 +19.3% 14 13 -7.1% 1.7 1.1 -35.3%
3 SF District 3 25 28 +12.0% 10 19 +90.0% $1,148,750 $1,400,000 +21.9% 24 15 -37.5% 1.9 1.7 -10.5%
4 SF District 4 59 39 -33.9% 18 39 +116.7% $1,952,500 $2,040,000 +4.5% 14 12 -14.3% 2.5 1.1 -56.0%
5 SF District 5 128 85 -33.6% 17 47 +176.5% $2,700,000 $2,535,000 -6.1% 22 24 +9.1% 4.8 2.2 -54.2%
6 SF District 6 22 13 -40.9% 3 6 +100.0% $2,155,000 $3,190,000 +48.0% 24 19 -20.8% 6.0 2.4 -60.0%
7 SF District 7 51 42 -17.6% 6 19 +216.7% $7,750,000 $5,900,000 -23.9% 48 33 -31.3% 7.2 3.9 -45.8%
8 SF District 8 21 19 -9.5% 0 3 -- $0 $2,100,000 -- 0 68 -- 8.8 7.5 -14.8%
9 SF District 9 70 67 -4.3% 9 37 +311.1% $1,699,000 $1,675,000 -1.4% 19 21 +10.5% 3.8 2.2 -42.1%
10 SF District 10 113 94 -16.8% 30 42 +40.0% $1,060,000 $1,180,000 +11.3% 19 17 -10.5% 2.8 2.0 -28.6%
Condo/TIC/Coop
1 SF District 1 48 22 -54.2% 12 22 +83.3% $1,507,500 $1,392,500 -7.6% 52 24 -53.8% 4.0 1.2 -70.0%
2 SF District 2 16 12 -25.0% 2 8 +300.0% $1,400,000 $1,150,000 -17.9% 7 14 +100.0% 3.8 2.1 -44.7%
3 SF District 3 2 5 +150.0% 0 6 -- $0 $1,359,000 -- 0 98 -- 0.5 1.5 +200.0%
4 SF District 4 12 9 -25.0% 2 5 +150.0% $855,000 $1,000,000 +17.0% 20 24 +20.0% 2.3 1.7 -26.1%
5 SF District 5 132 101 -23.5% 18 63 +250.0% $1,390,000 $1,350,000 -2.9% 15 29 +93.3% 4.0 1.9 -52.5%
6 SF District 6 80 94 +17.5% 6 41 +583.3% $1,437,500 $1,180,000 -17.9% 17 34 +100.0% 3.8 2.6 -31.6%
7 SF District 7 92 100 +8.7% 13 55 +323.1% $1,398,000 $1,595,000 +14.1% 36 38 +5.6% 4.2 2.7 -35.7%
8 SF District 8 199 231 +16.1% 19 73 +284.2% $1,200,000 $1,175,000 -2.1% 45 49 +8.9% 5.4 4.7 -13.0%
9 SF District 9 440 585 +33.0% 39 161 +312.8% $1,100,000 $1,160,000 +5.5% 32 53 +65.6% 5.9 5.8 -1.7%
10 SF District 10 44 52 +18.2% 6 7 +16.7% $753,000 $690,000 -8.4% 31 66 +112.9% 7.7 7.8 +1.3%
Key metrics by report month for the districts of San Fransisco.
Current as of May 11, 2021. All data from the San Francisco MLS. Report © 2021 ShowingTime. | 16
Active Listings Sold Listings Median Sales Price Days on Market Months Supply

More Related Content

What's hot

San Francisco Market Report December 2020
San Francisco Market Report December 2020San Francisco Market Report December 2020
San Francisco Market Report December 2020Ronny Budiutama
 
San Francisco market focus report December 2019
San Francisco market focus report December 2019San Francisco market focus report December 2019
San Francisco market focus report December 2019Ronny Budiutama
 
San Francisco Market Report January 2022
San Francisco Market Report January 2022San Francisco Market Report January 2022
San Francisco Market Report January 2022Ronny Budiutama
 
San Francisco Market Report December 2021
San Francisco Market Report December 2021San Francisco Market Report December 2021
San Francisco Market Report December 2021Ronny Budiutama
 
San Francisco Market Focus Report Jan 2020
San Francisco Market Focus Report Jan 2020San Francisco Market Focus Report Jan 2020
San Francisco Market Focus Report Jan 2020Ronny Budiutama
 
San Francisco Market Focus Report Nov 2020
San Francisco Market Focus Report Nov 2020San Francisco Market Focus Report Nov 2020
San Francisco Market Focus Report Nov 2020Ronny Budiutama
 
San Francisco Market Data October 2020
San Francisco Market Data October 2020San Francisco Market Data October 2020
San Francisco Market Data October 2020Ronny Budiutama
 
San Francisco market report September 2020
San Francisco market report September 2020San Francisco market report September 2020
San Francisco market report September 2020Ronny Budiutama
 
San Francisco Market Focus Report December 2018
San Francisco Market Focus Report December 2018San Francisco Market Focus Report December 2018
San Francisco Market Focus Report December 2018Ronny Budiutama
 
San Francisco market report August 2020
San Francisco market report August 2020San Francisco market report August 2020
San Francisco market report August 2020Ronny Budiutama
 
San Francisco Market Focus February 2014
San Francisco Market Focus February 2014San Francisco Market Focus February 2014
San Francisco Market Focus February 2014Ronny Budiutama
 
San Francisco Market Focus Report Feb 2020
San Francisco Market Focus Report Feb 2020San Francisco Market Focus Report Feb 2020
San Francisco Market Focus Report Feb 2020Ronny Budiutama
 
San Francisco Market Report for March 2020
San Francisco Market Report for March 2020San Francisco Market Report for March 2020
San Francisco Market Report for March 2020Ronny Budiutama
 
San Francisco Market Focus August 2013
San Francisco Market Focus August 2013San Francisco Market Focus August 2013
San Francisco Market Focus August 2013Ronny Budiutama
 
San Francisco Real Estate Housing Market December 2016
San Francisco Real Estate Housing Market December 2016San Francisco Real Estate Housing Market December 2016
San Francisco Real Estate Housing Market December 2016Ronny Budiutama
 
San Francisco Market Focus April 2016
San Francisco Market Focus April 2016San Francisco Market Focus April 2016
San Francisco Market Focus April 2016Ronny Budiutama
 
San Francisco Market Focus December 2013
San Francisco Market Focus December 2013San Francisco Market Focus December 2013
San Francisco Market Focus December 2013Ronny Budiutama
 
San Francisco Market Focus Report April 2019
San Francisco Market Focus Report April 2019San Francisco Market Focus Report April 2019
San Francisco Market Focus Report April 2019Ronny Budiutama
 
San Francisco market focus report June 2018
San Francisco market focus report June 2018San Francisco market focus report June 2018
San Francisco market focus report June 2018Ronny Budiutama
 

What's hot (19)

San Francisco Market Report December 2020
San Francisco Market Report December 2020San Francisco Market Report December 2020
San Francisco Market Report December 2020
 
San Francisco market focus report December 2019
San Francisco market focus report December 2019San Francisco market focus report December 2019
San Francisco market focus report December 2019
 
San Francisco Market Report January 2022
San Francisco Market Report January 2022San Francisco Market Report January 2022
San Francisco Market Report January 2022
 
San Francisco Market Report December 2021
San Francisco Market Report December 2021San Francisco Market Report December 2021
San Francisco Market Report December 2021
 
San Francisco Market Focus Report Jan 2020
San Francisco Market Focus Report Jan 2020San Francisco Market Focus Report Jan 2020
San Francisco Market Focus Report Jan 2020
 
San Francisco Market Focus Report Nov 2020
San Francisco Market Focus Report Nov 2020San Francisco Market Focus Report Nov 2020
San Francisco Market Focus Report Nov 2020
 
San Francisco Market Data October 2020
San Francisco Market Data October 2020San Francisco Market Data October 2020
San Francisco Market Data October 2020
 
San Francisco market report September 2020
San Francisco market report September 2020San Francisco market report September 2020
San Francisco market report September 2020
 
San Francisco Market Focus Report December 2018
San Francisco Market Focus Report December 2018San Francisco Market Focus Report December 2018
San Francisco Market Focus Report December 2018
 
San Francisco market report August 2020
San Francisco market report August 2020San Francisco market report August 2020
San Francisco market report August 2020
 
San Francisco Market Focus February 2014
San Francisco Market Focus February 2014San Francisco Market Focus February 2014
San Francisco Market Focus February 2014
 
San Francisco Market Focus Report Feb 2020
San Francisco Market Focus Report Feb 2020San Francisco Market Focus Report Feb 2020
San Francisco Market Focus Report Feb 2020
 
San Francisco Market Report for March 2020
San Francisco Market Report for March 2020San Francisco Market Report for March 2020
San Francisco Market Report for March 2020
 
San Francisco Market Focus August 2013
San Francisco Market Focus August 2013San Francisco Market Focus August 2013
San Francisco Market Focus August 2013
 
San Francisco Real Estate Housing Market December 2016
San Francisco Real Estate Housing Market December 2016San Francisco Real Estate Housing Market December 2016
San Francisco Real Estate Housing Market December 2016
 
San Francisco Market Focus April 2016
San Francisco Market Focus April 2016San Francisco Market Focus April 2016
San Francisco Market Focus April 2016
 
San Francisco Market Focus December 2013
San Francisco Market Focus December 2013San Francisco Market Focus December 2013
San Francisco Market Focus December 2013
 
San Francisco Market Focus Report April 2019
San Francisco Market Focus Report April 2019San Francisco Market Focus Report April 2019
San Francisco Market Focus Report April 2019
 
San Francisco market focus report June 2018
San Francisco market focus report June 2018San Francisco market focus report June 2018
San Francisco market focus report June 2018
 

Similar to San Francisco Market Report April 2021

San Francisco Market Report May 2021
San Francisco Market Report May 2021San Francisco Market Report May 2021
San Francisco Market Report May 2021Ronny Budiutama
 
San Francisco Market Report June 2021
San Francisco Market Report June 2021San Francisco Market Report June 2021
San Francisco Market Report June 2021Ronny Budiutama
 
San Francisco Market Report March 2022
San Francisco Market Report March 2022San Francisco Market Report March 2022
San Francisco Market Report March 2022Ronny Budiutama
 
San Francisco market report June 2020
San Francisco market report June 2020San Francisco market report June 2020
San Francisco market report June 2020Ronny Budiutama
 
San Francisco Market Report April 2022.pdf
San Francisco Market Report April 2022.pdfSan Francisco Market Report April 2022.pdf
San Francisco Market Report April 2022.pdfRonny Budiutama
 
San Francisco Market Focus Report Feb 2019
San Francisco Market Focus Report Feb 2019San Francisco Market Focus Report Feb 2019
San Francisco Market Focus Report Feb 2019Ronny Budiutama
 
San Francisco Market Report February 2022
San Francisco Market Report February 2022San Francisco Market Report February 2022
San Francisco Market Report February 2022Ronny Budiutama
 
San Francisco market report July 2020
San Francisco market report July 2020San Francisco market report July 2020
San Francisco market report July 2020Ronny Budiutama
 
San Francisco market report April 2020
San Francisco market report April 2020San Francisco market report April 2020
San Francisco market report April 2020Ronny Budiutama
 
San Francisco May 2023 Market Report.pdf
San Francisco May 2023 Market Report.pdfSan Francisco May 2023 Market Report.pdf
San Francisco May 2023 Market Report.pdfRonny Budiutama
 
San Francisco Market Focus Report May 2019
San Francisco Market Focus Report May 2019San Francisco Market Focus Report May 2019
San Francisco Market Focus Report May 2019Ronny Budiutama
 
San Francisco January 2024 Market Report
San Francisco January 2024 Market ReportSan Francisco January 2024 Market Report
San Francisco January 2024 Market ReportRonny Budiutama
 
San Francisco Market Focus April 2017
San Francisco Market Focus April 2017San Francisco Market Focus April 2017
San Francisco Market Focus April 2017Ronny Budiutama
 
San Francisco Market Report July 2022.pdf
San Francisco Market Report July 2022.pdfSan Francisco Market Report July 2022.pdf
San Francisco Market Report July 2022.pdfRonny Budiutama
 
San Francisco Market Focus April 2018
San Francisco Market Focus April 2018San Francisco Market Focus April 2018
San Francisco Market Focus April 2018Ronny Budiutama
 
San Francisco Market Focus April 2015
San Francisco Market Focus April 2015San Francisco Market Focus April 2015
San Francisco Market Focus April 2015Ronny Budiutama
 
San Francisco Market Report February 2023
San Francisco Market Report February 2023San Francisco Market Report February 2023
San Francisco Market Report February 2023Ronny Budiutama
 
San Francisco market report May 2020
San Francisco market report May 2020San Francisco market report May 2020
San Francisco market report May 2020Ronny Budiutama
 
San Francisco Market Report June 2022.pdf
San Francisco Market Report June 2022.pdfSan Francisco Market Report June 2022.pdf
San Francisco Market Report June 2022.pdfRonny Budiutama
 
San Francisco Market Focus Report May
San Francisco Market Focus Report MaySan Francisco Market Focus Report May
San Francisco Market Focus Report MayRonny Budiutama
 

Similar to San Francisco Market Report April 2021 (20)

San Francisco Market Report May 2021
San Francisco Market Report May 2021San Francisco Market Report May 2021
San Francisco Market Report May 2021
 
San Francisco Market Report June 2021
San Francisco Market Report June 2021San Francisco Market Report June 2021
San Francisco Market Report June 2021
 
San Francisco Market Report March 2022
San Francisco Market Report March 2022San Francisco Market Report March 2022
San Francisco Market Report March 2022
 
San Francisco market report June 2020
San Francisco market report June 2020San Francisco market report June 2020
San Francisco market report June 2020
 
San Francisco Market Report April 2022.pdf
San Francisco Market Report April 2022.pdfSan Francisco Market Report April 2022.pdf
San Francisco Market Report April 2022.pdf
 
San Francisco Market Focus Report Feb 2019
San Francisco Market Focus Report Feb 2019San Francisco Market Focus Report Feb 2019
San Francisco Market Focus Report Feb 2019
 
San Francisco Market Report February 2022
San Francisco Market Report February 2022San Francisco Market Report February 2022
San Francisco Market Report February 2022
 
San Francisco market report July 2020
San Francisco market report July 2020San Francisco market report July 2020
San Francisco market report July 2020
 
San Francisco market report April 2020
San Francisco market report April 2020San Francisco market report April 2020
San Francisco market report April 2020
 
San Francisco May 2023 Market Report.pdf
San Francisco May 2023 Market Report.pdfSan Francisco May 2023 Market Report.pdf
San Francisco May 2023 Market Report.pdf
 
San Francisco Market Focus Report May 2019
San Francisco Market Focus Report May 2019San Francisco Market Focus Report May 2019
San Francisco Market Focus Report May 2019
 
San Francisco January 2024 Market Report
San Francisco January 2024 Market ReportSan Francisco January 2024 Market Report
San Francisco January 2024 Market Report
 
San Francisco Market Focus April 2017
San Francisco Market Focus April 2017San Francisco Market Focus April 2017
San Francisco Market Focus April 2017
 
San Francisco Market Report July 2022.pdf
San Francisco Market Report July 2022.pdfSan Francisco Market Report July 2022.pdf
San Francisco Market Report July 2022.pdf
 
San Francisco Market Focus April 2018
San Francisco Market Focus April 2018San Francisco Market Focus April 2018
San Francisco Market Focus April 2018
 
San Francisco Market Focus April 2015
San Francisco Market Focus April 2015San Francisco Market Focus April 2015
San Francisco Market Focus April 2015
 
San Francisco Market Report February 2023
San Francisco Market Report February 2023San Francisco Market Report February 2023
San Francisco Market Report February 2023
 
San Francisco market report May 2020
San Francisco market report May 2020San Francisco market report May 2020
San Francisco market report May 2020
 
San Francisco Market Report June 2022.pdf
San Francisco Market Report June 2022.pdfSan Francisco Market Report June 2022.pdf
San Francisco Market Report June 2022.pdf
 
San Francisco Market Focus Report May
San Francisco Market Focus Report MaySan Francisco Market Focus Report May
San Francisco Market Focus Report May
 

More from Ronny Budiutama

San Francisco December 2023 Market Report
San Francisco December 2023 Market ReportSan Francisco December 2023 Market Report
San Francisco December 2023 Market ReportRonny Budiutama
 
San Francisco November 2023 Market Report
San Francisco November 2023 Market ReportSan Francisco November 2023 Market Report
San Francisco November 2023 Market ReportRonny Budiutama
 
2023 Annual San Francisco Housing Market
2023 Annual San Francisco Housing Market2023 Annual San Francisco Housing Market
2023 Annual San Francisco Housing MarketRonny Budiutama
 
October 2023 Report: San Francisco Real Estate Market Insights
October 2023 Report: San Francisco Real Estate Market InsightsOctober 2023 Report: San Francisco Real Estate Market Insights
October 2023 Report: San Francisco Real Estate Market InsightsRonny Budiutama
 
CA Weekly MLS Market Data Report - August 2023
CA Weekly MLS Market Data Report - August 2023CA Weekly MLS Market Data Report - August 2023
CA Weekly MLS Market Data Report - August 2023Ronny Budiutama
 
San Francisco Market Report July 2023.pdf
San Francisco Market Report July 2023.pdfSan Francisco Market Report July 2023.pdf
San Francisco Market Report July 2023.pdfRonny Budiutama
 
San Francisco June 2023 Market Report.pdf
San Francisco June 2023 Market Report.pdfSan Francisco June 2023 Market Report.pdf
San Francisco June 2023 Market Report.pdfRonny Budiutama
 
San Francisco Market Report March 2023.pdf
San Francisco Market Report March 2023.pdfSan Francisco Market Report March 2023.pdf
San Francisco Market Report March 2023.pdfRonny Budiutama
 
San Francisco Market Report January 2023.pdf
San Francisco Market Report January 2023.pdfSan Francisco Market Report January 2023.pdf
San Francisco Market Report January 2023.pdfRonny Budiutama
 
Annual Report on the San Francisco County Housing Market.pdf
Annual Report on the San Francisco County Housing Market.pdfAnnual Report on the San Francisco County Housing Market.pdf
Annual Report on the San Francisco County Housing Market.pdfRonny Budiutama
 
San Francisco Market Report December 2022.pdf
San Francisco Market Report December 2022.pdfSan Francisco Market Report December 2022.pdf
San Francisco Market Report December 2022.pdfRonny Budiutama
 
San Francisco Market Report November 2022.pdf
San Francisco Market Report November 2022.pdfSan Francisco Market Report November 2022.pdf
San Francisco Market Report November 2022.pdfRonny Budiutama
 
San Francisco Market Report October 2022.pdf
San Francisco Market Report October 2022.pdfSan Francisco Market Report October 2022.pdf
San Francisco Market Report October 2022.pdfRonny Budiutama
 
San Francisco Market Report September 2022.pdf
San Francisco Market Report September 2022.pdfSan Francisco Market Report September 2022.pdf
San Francisco Market Report September 2022.pdfRonny Budiutama
 
San Francisco Market Report August 2022.pdf
San Francisco Market Report August 2022.pdfSan Francisco Market Report August 2022.pdf
San Francisco Market Report August 2022.pdfRonny Budiutama
 
San Francisco Market Report May 2022.
San Francisco Market Report May 2022.San Francisco Market Report May 2022.
San Francisco Market Report May 2022.Ronny Budiutama
 

More from Ronny Budiutama (16)

San Francisco December 2023 Market Report
San Francisco December 2023 Market ReportSan Francisco December 2023 Market Report
San Francisco December 2023 Market Report
 
San Francisco November 2023 Market Report
San Francisco November 2023 Market ReportSan Francisco November 2023 Market Report
San Francisco November 2023 Market Report
 
2023 Annual San Francisco Housing Market
2023 Annual San Francisco Housing Market2023 Annual San Francisco Housing Market
2023 Annual San Francisco Housing Market
 
October 2023 Report: San Francisco Real Estate Market Insights
October 2023 Report: San Francisco Real Estate Market InsightsOctober 2023 Report: San Francisco Real Estate Market Insights
October 2023 Report: San Francisco Real Estate Market Insights
 
CA Weekly MLS Market Data Report - August 2023
CA Weekly MLS Market Data Report - August 2023CA Weekly MLS Market Data Report - August 2023
CA Weekly MLS Market Data Report - August 2023
 
San Francisco Market Report July 2023.pdf
San Francisco Market Report July 2023.pdfSan Francisco Market Report July 2023.pdf
San Francisco Market Report July 2023.pdf
 
San Francisco June 2023 Market Report.pdf
San Francisco June 2023 Market Report.pdfSan Francisco June 2023 Market Report.pdf
San Francisco June 2023 Market Report.pdf
 
San Francisco Market Report March 2023.pdf
San Francisco Market Report March 2023.pdfSan Francisco Market Report March 2023.pdf
San Francisco Market Report March 2023.pdf
 
San Francisco Market Report January 2023.pdf
San Francisco Market Report January 2023.pdfSan Francisco Market Report January 2023.pdf
San Francisco Market Report January 2023.pdf
 
Annual Report on the San Francisco County Housing Market.pdf
Annual Report on the San Francisco County Housing Market.pdfAnnual Report on the San Francisco County Housing Market.pdf
Annual Report on the San Francisco County Housing Market.pdf
 
San Francisco Market Report December 2022.pdf
San Francisco Market Report December 2022.pdfSan Francisco Market Report December 2022.pdf
San Francisco Market Report December 2022.pdf
 
San Francisco Market Report November 2022.pdf
San Francisco Market Report November 2022.pdfSan Francisco Market Report November 2022.pdf
San Francisco Market Report November 2022.pdf
 
San Francisco Market Report October 2022.pdf
San Francisco Market Report October 2022.pdfSan Francisco Market Report October 2022.pdf
San Francisco Market Report October 2022.pdf
 
San Francisco Market Report September 2022.pdf
San Francisco Market Report September 2022.pdfSan Francisco Market Report September 2022.pdf
San Francisco Market Report September 2022.pdf
 
San Francisco Market Report August 2022.pdf
San Francisco Market Report August 2022.pdfSan Francisco Market Report August 2022.pdf
San Francisco Market Report August 2022.pdf
 
San Francisco Market Report May 2022.
San Francisco Market Report May 2022.San Francisco Market Report May 2022.
San Francisco Market Report May 2022.
 

Recently uploaded

call girls in Shahdara (DELHI) 🔝 >༒9953330565🔝 genuine Escort Service 🔝✔️✔️
call girls in Shahdara (DELHI) 🔝 >༒9953330565🔝 genuine Escort Service 🔝✔️✔️call girls in Shahdara (DELHI) 🔝 >༒9953330565🔝 genuine Escort Service 🔝✔️✔️
call girls in Shahdara (DELHI) 🔝 >༒9953330565🔝 genuine Escort Service 🔝✔️✔️9953056974 Low Rate Call Girls In Saket, Delhi NCR
 
Nanke Area Estate commercial ( Dir. Kat Kuo)
Nanke Area Estate commercial ( Dir. Kat Kuo)Nanke Area Estate commercial ( Dir. Kat Kuo)
Nanke Area Estate commercial ( Dir. Kat Kuo)jessica288382
 
Call Girls in Kashmiri Gate Delhi 💯Call Us 🔝8264348440🔝
Call Girls in Kashmiri Gate Delhi 💯Call Us 🔝8264348440🔝Call Girls in Kashmiri Gate Delhi 💯Call Us 🔝8264348440🔝
Call Girls in Kashmiri Gate Delhi 💯Call Us 🔝8264348440🔝soniya singh
 
9990771857 Call Girls in Noida Sector 03 Noida (Call Girls) Delhi
9990771857 Call Girls in Noida Sector 03 Noida (Call Girls) Delhi9990771857 Call Girls in Noida Sector 03 Noida (Call Girls) Delhi
9990771857 Call Girls in Noida Sector 03 Noida (Call Girls) Delhidelhimodel235
 
9990771857 Call Girls in Noida Sector 34 Noida (Call Girls) Delhi
9990771857 Call Girls in Noida Sector 34 Noida (Call Girls) Delhi9990771857 Call Girls in Noida Sector 34 Noida (Call Girls) Delhi
9990771857 Call Girls in Noida Sector 34 Noida (Call Girls) Delhidelhimodel235
 
Choose Noida's Leading Architect
Choose    Noida's    Leading   ArchitectChoose    Noida's    Leading   Architect
Choose Noida's Leading ArchitectMM Design Studio
 
Omaxe Dwarka In Delhi E Brochure Pdf
Omaxe Dwarka In Delhi E Brochure     PdfOmaxe Dwarka In Delhi E Brochure     Pdf
Omaxe Dwarka In Delhi E Brochure Pdfashiyadav24
 
Call Girls in Khan Market 9654467111 ESCORTS SERVICE
Call Girls in Khan Market 9654467111 ESCORTS SERVICECall Girls in Khan Market 9654467111 ESCORTS SERVICE
Call Girls in Khan Market 9654467111 ESCORTS SERVICESapana Sha
 
Call Girls in Pitampura Delhi 💯Call Us 🔝8264348440🔝
Call Girls in Pitampura Delhi 💯Call Us 🔝8264348440🔝Call Girls in Pitampura Delhi 💯Call Us 🔝8264348440🔝
Call Girls in Pitampura Delhi 💯Call Us 🔝8264348440🔝soniya singh
 
Call Girls In The Lalit New Delhi ❤️8860477959 Good Looking Escorts In 24/7 D...
Call Girls In The Lalit New Delhi ❤️8860477959 Good Looking Escorts In 24/7 D...Call Girls In The Lalit New Delhi ❤️8860477959 Good Looking Escorts In 24/7 D...
Call Girls In The Lalit New Delhi ❤️8860477959 Good Looking Escorts In 24/7 D...lizamodels9
 
SSPL The Strand Abodes Kharadi Pune Brochure.pdf
SSPL The Strand Abodes Kharadi Pune Brochure.pdfSSPL The Strand Abodes Kharadi Pune Brochure.pdf
SSPL The Strand Abodes Kharadi Pune Brochure.pdfabbu831446
 
The Omaxe State Dwarka Delhi-broucher.pdf.pdf
The Omaxe State Dwarka Delhi-broucher.pdf.pdfThe Omaxe State Dwarka Delhi-broucher.pdf.pdf
The Omaxe State Dwarka Delhi-broucher.pdf.pdfkratirudram
 
Call Girls In Sahibabad Ghaziabad ❤️8860477959 Low Rate Escorts Service In 24...
Call Girls In Sahibabad Ghaziabad ❤️8860477959 Low Rate Escorts Service In 24...Call Girls In Sahibabad Ghaziabad ❤️8860477959 Low Rate Escorts Service In 24...
Call Girls In Sahibabad Ghaziabad ❤️8860477959 Low Rate Escorts Service In 24...lizamodels9
 
9990771857 Call Girls in Noida Sector 1 Noida (Call Girls) Delhi
9990771857 Call Girls in Noida Sector 1 Noida (Call Girls) Delhi9990771857 Call Girls in Noida Sector 1 Noida (Call Girls) Delhi
9990771857 Call Girls in Noida Sector 1 Noida (Call Girls) Delhidelhimodel235
 
Listing Turkey Sylvana Istanbul - Bahcesehir
Listing Turkey Sylvana Istanbul - BahcesehirListing Turkey Sylvana Istanbul - Bahcesehir
Listing Turkey Sylvana Istanbul - BahcesehirListing Turkey
 
Namrata 7 Plumeria Drive Pimpri Chinchwad Pune Brochure.pdf
Namrata 7 Plumeria Drive Pimpri Chinchwad Pune Brochure.pdfNamrata 7 Plumeria Drive Pimpri Chinchwad Pune Brochure.pdf
Namrata 7 Plumeria Drive Pimpri Chinchwad Pune Brochure.pdfPrachiRudram
 
9990771857 Call Girls in Noida Sector 10 Noida (Call Girls) Delhi
9990771857 Call Girls in Noida Sector 10 Noida (Call Girls) Delhi9990771857 Call Girls in Noida Sector 10 Noida (Call Girls) Delhi
9990771857 Call Girls in Noida Sector 10 Noida (Call Girls) Delhidelhimodel235
 
Call Girls In Mundka Industrial Metro@꧂8447779280 ↬Enjoy ꧂Escort Service in ...
Call Girls In Mundka Industrial Metro@꧂8447779280 ↬Enjoy ꧂Escort Service in  ...Call Girls In Mundka Industrial Metro@꧂8447779280 ↬Enjoy ꧂Escort Service in  ...
Call Girls In Mundka Industrial Metro@꧂8447779280 ↬Enjoy ꧂Escort Service in ...asmaqueen5
 

Recently uploaded (20)

call girls in Shahdara (DELHI) 🔝 >༒9953330565🔝 genuine Escort Service 🔝✔️✔️
call girls in Shahdara (DELHI) 🔝 >༒9953330565🔝 genuine Escort Service 🔝✔️✔️call girls in Shahdara (DELHI) 🔝 >༒9953330565🔝 genuine Escort Service 🔝✔️✔️
call girls in Shahdara (DELHI) 🔝 >༒9953330565🔝 genuine Escort Service 🔝✔️✔️
 
Nanke Area Estate commercial ( Dir. Kat Kuo)
Nanke Area Estate commercial ( Dir. Kat Kuo)Nanke Area Estate commercial ( Dir. Kat Kuo)
Nanke Area Estate commercial ( Dir. Kat Kuo)
 
Call Girls in Kashmiri Gate Delhi 💯Call Us 🔝8264348440🔝
Call Girls in Kashmiri Gate Delhi 💯Call Us 🔝8264348440🔝Call Girls in Kashmiri Gate Delhi 💯Call Us 🔝8264348440🔝
Call Girls in Kashmiri Gate Delhi 💯Call Us 🔝8264348440🔝
 
9990771857 Call Girls in Noida Sector 03 Noida (Call Girls) Delhi
9990771857 Call Girls in Noida Sector 03 Noida (Call Girls) Delhi9990771857 Call Girls in Noida Sector 03 Noida (Call Girls) Delhi
9990771857 Call Girls in Noida Sector 03 Noida (Call Girls) Delhi
 
9990771857 Call Girls in Noida Sector 34 Noida (Call Girls) Delhi
9990771857 Call Girls in Noida Sector 34 Noida (Call Girls) Delhi9990771857 Call Girls in Noida Sector 34 Noida (Call Girls) Delhi
9990771857 Call Girls in Noida Sector 34 Noida (Call Girls) Delhi
 
Choose Noida's Leading Architect
Choose    Noida's    Leading   ArchitectChoose    Noida's    Leading   Architect
Choose Noida's Leading Architect
 
Omaxe Dwarka In Delhi E Brochure Pdf
Omaxe Dwarka In Delhi E Brochure     PdfOmaxe Dwarka In Delhi E Brochure     Pdf
Omaxe Dwarka In Delhi E Brochure Pdf
 
young call girls in Lajpat Nagar,🔝 9953056974 🔝 escort Service
young call girls in Lajpat Nagar,🔝 9953056974 🔝 escort Serviceyoung call girls in Lajpat Nagar,🔝 9953056974 🔝 escort Service
young call girls in Lajpat Nagar,🔝 9953056974 🔝 escort Service
 
Call Girls in Khan Market 9654467111 ESCORTS SERVICE
Call Girls in Khan Market 9654467111 ESCORTS SERVICECall Girls in Khan Market 9654467111 ESCORTS SERVICE
Call Girls in Khan Market 9654467111 ESCORTS SERVICE
 
Call Girls in Pitampura Delhi 💯Call Us 🔝8264348440🔝
Call Girls in Pitampura Delhi 💯Call Us 🔝8264348440🔝Call Girls in Pitampura Delhi 💯Call Us 🔝8264348440🔝
Call Girls in Pitampura Delhi 💯Call Us 🔝8264348440🔝
 
Call Girls In The Lalit New Delhi ❤️8860477959 Good Looking Escorts In 24/7 D...
Call Girls In The Lalit New Delhi ❤️8860477959 Good Looking Escorts In 24/7 D...Call Girls In The Lalit New Delhi ❤️8860477959 Good Looking Escorts In 24/7 D...
Call Girls In The Lalit New Delhi ❤️8860477959 Good Looking Escorts In 24/7 D...
 
SSPL The Strand Abodes Kharadi Pune Brochure.pdf
SSPL The Strand Abodes Kharadi Pune Brochure.pdfSSPL The Strand Abodes Kharadi Pune Brochure.pdf
SSPL The Strand Abodes Kharadi Pune Brochure.pdf
 
The Omaxe State Dwarka Delhi-broucher.pdf.pdf
The Omaxe State Dwarka Delhi-broucher.pdf.pdfThe Omaxe State Dwarka Delhi-broucher.pdf.pdf
The Omaxe State Dwarka Delhi-broucher.pdf.pdf
 
Call Girls In Sahibabad Ghaziabad ❤️8860477959 Low Rate Escorts Service In 24...
Call Girls In Sahibabad Ghaziabad ❤️8860477959 Low Rate Escorts Service In 24...Call Girls In Sahibabad Ghaziabad ❤️8860477959 Low Rate Escorts Service In 24...
Call Girls In Sahibabad Ghaziabad ❤️8860477959 Low Rate Escorts Service In 24...
 
9990771857 Call Girls in Noida Sector 1 Noida (Call Girls) Delhi
9990771857 Call Girls in Noida Sector 1 Noida (Call Girls) Delhi9990771857 Call Girls in Noida Sector 1 Noida (Call Girls) Delhi
9990771857 Call Girls in Noida Sector 1 Noida (Call Girls) Delhi
 
Listing Turkey Sylvana Istanbul - Bahcesehir
Listing Turkey Sylvana Istanbul - BahcesehirListing Turkey Sylvana Istanbul - Bahcesehir
Listing Turkey Sylvana Istanbul - Bahcesehir
 
Namrata 7 Plumeria Drive Pimpri Chinchwad Pune Brochure.pdf
Namrata 7 Plumeria Drive Pimpri Chinchwad Pune Brochure.pdfNamrata 7 Plumeria Drive Pimpri Chinchwad Pune Brochure.pdf
Namrata 7 Plumeria Drive Pimpri Chinchwad Pune Brochure.pdf
 
9990771857 Call Girls in Noida Sector 10 Noida (Call Girls) Delhi
9990771857 Call Girls in Noida Sector 10 Noida (Call Girls) Delhi9990771857 Call Girls in Noida Sector 10 Noida (Call Girls) Delhi
9990771857 Call Girls in Noida Sector 10 Noida (Call Girls) Delhi
 
Low Rate Call Girls in Triveni Complex Delhi Call 9873940964
Low Rate Call Girls in Triveni Complex Delhi Call 9873940964Low Rate Call Girls in Triveni Complex Delhi Call 9873940964
Low Rate Call Girls in Triveni Complex Delhi Call 9873940964
 
Call Girls In Mundka Industrial Metro@꧂8447779280 ↬Enjoy ꧂Escort Service in ...
Call Girls In Mundka Industrial Metro@꧂8447779280 ↬Enjoy ꧂Escort Service in  ...Call Girls In Mundka Industrial Metro@꧂8447779280 ↬Enjoy ꧂Escort Service in  ...
Call Girls In Mundka Industrial Metro@꧂8447779280 ↬Enjoy ꧂Escort Service in ...
 

San Francisco Market Report April 2021

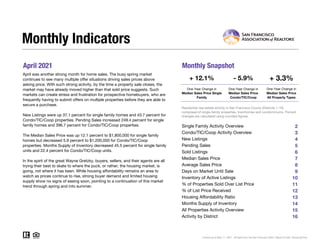
  • 1. April 2021 Monthly Snapshot One-Year Change in One-Year Change in Median Sales Price Single Family Median Sales Price Condo/TIC/Coop 2 3 4 5 6 7 8 9 10 11 12 13 14 15 16 Monthly Indicators + 12.1% - 5.9% + 3.3% One-Year Change in April was another strong month for home sales. The busy spring market continues to see many multiple offer situations driving sales prices above asking price. With such strong activity, by the time a property sale closes, the market may have already moved higher than that sold price suggests. Such markets can create stress and frustration for prospective homebuyers, who are frequently having to submit offers on multiple properties before they are able to secure a purchase. New Listings were up 37.1 percent for single family homes and 43.7 percent for Condo/TIC/Coop properties. Pending Sales increased 249.4 percent for single family homes and 396.7 percent for Condo/TIC/Coop properties. The Median Sales Price was up 12.1 percent to $1,800,000 for single family homes but decreased 5.9 percent to $1,200,000 for Condo/TIC/Coop properties. Months Supply of Inventory decreased 45.5 percent for single family units and 22.4 percent for Condo/TIC/Coop units. In the spirit of the great Wayne Gretzky, buyers, sellers, and their agents are all trying their best to skate to where the puck, or rather, the housing market, is going, not where it has been. While housing affordability remains an area to watch as prices continue to rise, strong buyer demand and limited housing supply show no signs of easing soon, pointing to a continuation of this market trend through spring and into summer. Median Sales Price All Property Types Residential real estate activity in San Francisco County (Districts 1-10) composed of single-family properties, townhomes and condominiums. Percent changes are calculated using rounded figures. Single Family Activity Overview Months Supply of Inventory Current as of May 11, 2021. All data from the San Francisco MLS. Report © 2021 ShowingTime. Condo/TIC/Coop Activity Overview Inventory of Active Listings % of Properties Sold Over List Price % of List Price Received Housing Affordability Ratio All Properties Activity Overview New Listings Pending Sales Sold Listings Median Sales Price Average Sales Price Days on Market Until Sale Activity by District
  • 2. Single Family Activity Overview Key metrics by report month and for year-to-date (YTD) starting from the first of the year. Key Metrics Historical Sparkbars 4-2020 4-2021 Percent Change YTD 2020 YTD 2021 Percent Change Current as of May 11, 2021. All data from the San Francisco MLS. Report © 2021 ShowingTime. | 2 Months Supply 3.3 1.8 - 45.5% -- -- -- Affordability Ratio 34 31 - 8.8% % of List Price Received 108.8% 113.8% + 4.6% 110.9% 35 71.0% - 1.5% + 0.1% 33 - 5.7% 111.0% % of Properties Sold Over List Price 70.0% 76.2% + 8.9% 72.1% Active Listings 606 454 - 25.1% -- Avg. Sales Price $2,183,677 $2,443,828 + 11.9% $2,053,979 Days on Market 20 19 - 5.0% 25 25 0.0% $2,253,689 -- -- Median Sales Price $1,605,000 $1,800,000 + 12.1% $1,570,000 Sold Listings 120 286 + 138.3% 539 New Listings 175 240 + 37.1% 879 Pending Sales 79 276 + 249.4% + 86.1% 517 962 + 19.7% 1,052 876 + 62.5% $1,710,000 + 8.9% + 9.7% 4-2018 4-2019 4-2020 4-2021 4-2018 4-2019 4-2020 4-2021 4-2018 4-2019 4-2020 4-2021 4-2018 4-2019 4-2020 4-2021 4-2018 4-2019 4-2020 4-2021 4-2018 4-2019 4-2020 4-2021 4-2018 4-2019 4-2020 4-2021 4-2018 4-2019 4-2020 4-2021 4-2018 4-2019 4-2020 4-2021 4-2018 4-2019 4-2020 4-2021 4-2018 4-2019 4-2020 4-2021
  • 3. Condo/TIC/Coop Activity Overview Key metrics by report month and for year-to-date (YTD) starting from the first of the year. Key Metrics Historical Sparkbars 4-2020 4-2021 Percent Change YTD 2020 YTD 2021 Percent Change Current as of May 11, 2021. All data from the San Francisco MLS. Report © 2021 ShowingTime. | 3 Months Supply 4.9 3.8 - 22.4% -- -- -- Affordability Ratio 51 55 + 7.8% % of List Price Received 105.3% 103.8% - 1.4% 103.8% 53 38.2% - 30.3% - 1.9% 55 + 3.8% 101.8% % of Properties Sold Over List Price 59.8% 45.6% - 23.7% 54.8% Active Listings 1,065 1,211 + 13.7% -- Avg. Sales Price $1,347,363 $1,352,237 + 0.4% $1,337,510 Days on Market 32 44 + 37.5% 36 $1,190,000 - 2.5% - 0.7% 53 + 47.2% $1,328,647 -- -- Sold Listings 117 441 + 276.9% 682 1,441 + 111.3% Median Sales Price $1,275,000 $1,200,000 - 5.9% $1,220,000 + 46.8% Pending Sales 92 457 + 396.7% 663 1,596 + 140.7% New Listings 229 329 + 43.7% 1,268 1,861 4-2018 4-2019 4-2020 4-2021 4-2018 4-2019 4-2020 4-2021 4-2018 4-2019 4-2020 4-2021 4-2018 4-2019 4-2020 4-2021 4-2018 4-2019 4-2020 4-2021 4-2018 4-2019 4-2020 4-2021 4-2018 4-2019 4-2020 4-2021 4-2018 4-2019 4-2020 4-2021 4-2018 4-2019 4-2020 4-2021 4-2018 4-2019 4-2020 4-2021 4-2018 4-2019 4-2020 4-2021
  • 4. New Listings strong month for home sales. The busy spring market Single Family Year-Over-Year Change Condo/TIC/ Coop Year-Over-Year Change May-2020 274 -11.3% 503 +34.5% Jun-2020 359 +34.0% 579 +89.2% Jul-2020 407 +75.4% 695 +112.5% Aug-2020 353 +29.3% 649 +96.1% Sep-2020 356 +1.7% 662 +26.8% Oct-2020 369 +33.2% 520 +44.0% Nov-2020 239 +41.4% 248 +46.7% Dec-2020 145 +52.6% 239 +82.4% Jan-2021 245 -5.0% 512 +35.1% Feb-2021 278 +2.2% 470 +16.0% Mar-2021 289 +66.1% 550 +115.7% Apr-2021 240 +37.1% 329 +43.7% 12-Month Avg 296 +24.6% 496 +57.2% Historical New Listings by Month Current as of May 11, 2021. All data from the San Francisco MLS. Report © 2021 ShowingTime. | 4 A count of the properties that have been newly listed on the market in a given month. 276 367 175 229 240 329 Single Family Condo/TIC/Coop April 0 200 400 600 800 1-2005 1-2006 1-2007 1-2008 1-2009 1-2010 1-2011 1-2012 1-2013 1-2014 1-2015 1-2016 1-2017 1-2018 1-2019 1-2020 1-2021 Single Family Condo/TIC/Coop 1,003 1,429 879 1,268 1,052 1,861 Single Family Condo/TIC/Coop Year to Date 2019 2020 2021 + 43.7% - 37.6% + 37.1% - 36.6% - 11.3% + 19.7% - 12.4% + 46.8% 2019 2020 2021 2019 2020 2021 2019 2020 2021 - 6.1% - 4.8% - 4.2% - 4.2%
  • 5. Pending Sales strong month for home sales. The busy spring market Single Family Year-Over-Year Change Condo/TIC/ Coop Year-Over-Year Change May-2020 162 -40.7% 141 -57.7% Jun-2020 227 +8.6% 234 -5.3% Jul-2020 276 +29.6% 242 +12.6% Aug-2020 235 +37.4% 322 +54.8% Sep-2020 281 +29.5% 305 +33.2% Oct-2020 311 +17.8% 333 +5.4% Nov-2020 307 +38.3% 299 +26.2% Dec-2020 209 +57.1% 306 +100.0% Jan-2021 174 +47.5% 292 +81.4% Feb-2021 224 +51.4% 377 +66.1% Mar-2021 288 +67.4% 470 +156.8% Apr-2021 276 +249.4% 457 +396.7% 12-Month Avg 248 +33.8% 315 +45.3% Historical Pending Sales by Month A count of the properties on which offers have been accepted in a given month. Current as of May 11, 2021. All data from the San Francisco MLS. Report © 2021 ShowingTime. | 5 251 307 79 92 276 457 Single Family Condo/TIC/Coop April 0 100 200 300 400 500 1-2005 1-2006 1-2007 1-2008 1-2009 1-2010 1-2011 1-2012 1-2013 1-2014 1-2015 1-2016 1-2017 1-2018 1-2019 1-2020 1-2021 Single Family Condo/TIC/Coop 743 969 517 663 962 1,596 Single Family Condo/TIC/Coop Year to Date 2019 2020 2021 + 396.7% - 70.0% + 249.4% - 68.5% - 31.6% + 86.1% - 30.4% + 140.7% 2019 2020 2021 2019 2020 2021 2019 2020 2021 + 6.8% - 1.3% - 6.7% + 5.5%
  • 6. Sold Listings strong month for home sales. The busy spring market Single Family Year-Over-Year Change Condo/TIC/ Coop Year-Over-Year Change May-2020 114 -57.9% 114 -65.8% Jun-2020 181 -12.6% 177 -32.2% Jul-2020 238 -0.4% 266 +6.8% Aug-2020 243 +24.6% 240 +12.1% Sep-2020 257 +77.2% 323 +75.5% Oct-2020 305 +10.9% 292 +8.6% Nov-2020 284 +26.8% 341 +25.8% Dec-2020 301 +43.3% 353 +54.1% Jan-2021 161 +47.7% 268 +77.5% Feb-2021 162 +23.7% 278 +56.2% Mar-2021 267 +49.2% 454 +92.4% Apr-2021 286 +138.3% 441 +276.9% 12-Month Avg 233 +21.4% 296 +31.8% Historical Sold Listings by Month A count of the actual sales that closed in a given month. Current as of May 11, 2021. All data from the San Francisco MLS. Report © 2021 ShowingTime. | 6 249 325 120 117 286 441 Single Family Condo/TIC/Coop April 0 100 200 300 400 500 1-2005 1-2006 1-2007 1-2008 1-2009 1-2010 1-2011 1-2012 1-2013 1-2014 1-2015 1-2016 1-2017 1-2018 1-2019 1-2020 1-2021 Single Family Condo/TIC/Coop 675 879 539 682 876 1,441 Single Family Condo/TIC/Coop Year to Date 2019 2020 2021 + 276.9% - 64.0% + 138.3% - 51.8% - 22.4% + 62.5% - 20.1% + 111.3% 2019 2020 2021 2019 2020 2021 2019 2020 2021 + 15.8% + 0.7% - 7.6% + 8.0%
  • 7. Median Sales Price strong month for home sales. The busy spring market Single Family Year-Over-Year Change Condo/TIC/ Coop Year-Over-Year Change May-2020 $1,587,500 -2.0% $1,087,500 -11.2% Jun-2020 $1,730,000 -1.1% $1,225,000 -5.4% Jul-2020 $1,604,000 +3.5% $1,260,700 +5.1% Aug-2020 $1,625,000 +1.6% $1,210,000 -2.1% Sep-2020 $1,650,000 +8.2% $1,175,000 -9.6% Oct-2020 $1,605,000 +0.3% $1,152,500 -11.4% Nov-2020 $1,637,500 +7.2% $1,172,125 +0.2% Dec-2020 $1,550,000 +11.7% $1,100,000 -7.2% Jan-2021 $1,575,000 +7.9% $1,072,500 -7.2% Feb-2021 $1,655,000 +2.8% $1,196,500 -5.0% Mar-2021 $1,730,000 +9.8% $1,220,000 -2.4% Apr-2021 $1,800,000 +12.1% $1,200,000 -5.9% 12-Month Avg* $1,650,000 +5.1% $1,180,000 -3.7% Historical Median Sales Price by Month Point at which half of the sales sold for more and half sold for less, not accounting for seller concessions, in a given month. * Median Sales Price for all properties from May 2020 through April 2021. This is not the average of the individual figures above. Current as of May 11, 2021. All data from the San Francisco MLS. Report © 2021 ShowingTime. | 7 $1,600,000 $1,225,000 $1,605,000 $1,275,000 $1,800,000 $1,200,000 Single Family Condo/TIC/Coop April $500,000 $750,000 $1,000,000 $1,250,000 $1,500,000 $1,750,000 $2,000,000 1-2005 1-2006 1-2007 1-2008 1-2009 1-2010 1-2011 1-2012 1-2013 1-2014 1-2015 1-2016 1-2017 1-2018 1-2019 1-2020 1-2021 Single Family Condo/TIC/Coop $1,540,000 $1,175,000 $1,570,000 $1,220,000 $1,710,000 $1,190,000 Single Family Condo/TIC/Coop Year to Date 2019 2020 2021 - 5.9% + 4.1% + 12.1% + 0.3% + 3.8% + 8.9% + 1.9% - 2.5% 2019 2020 2021 2019 2020 2021 2019 2020 2021 0.0% - 2.5% + 0.8% + 0.4%
  • 8. Average Sales Price strong month for home sales. The busy spring market Single Family Year-Over-Year Change Condo/TIC/ Coop Year-Over-Year Change May-2020 $1,877,767 -9.1% $1,251,342 -4.7% Jun-2020 $2,200,915 +3.2% $1,415,327 -0.6% Jul-2020 $2,013,417 +5.5% $1,397,387 +8.7% Aug-2020 $1,987,092 +8.7% $1,326,561 -2.7% Sep-2020 $1,896,046 -4.6% $1,306,022 -9.2% Oct-2020 $1,907,545 +1.7% $1,252,476 -12.2% Nov-2020 $2,035,750 +6.6% $1,270,960 -3.1% Dec-2020 $2,014,010 +9.1% $1,281,834 +2.7% Jan-2021 $1,951,746 -8.2% $1,209,875 -4.6% Feb-2021 $2,266,482 +18.6% $1,344,643 -0.5% Mar-2021 $2,224,329 +9.6% $1,366,049 -0.0% Apr-2021 $2,443,828 +11.9% $1,352,237 +0.4% 12-Month Avg* $2,072,946 +5.2% $1,316,966 -2.1% Historical Average Sales Price by Month Average sales price for all closed sales, not accounting for seller concessions, in a given month. * Avg. Sales Price for all properties from May 2020 through April 2021. This is not the average of the individual figures above. Current as of May 11, 2021. All data from the San Francisco MLS. Report © 2021 ShowingTime. | 8 $2,181,450 $1,350,269 $2,183,677 $1,347,363 $2,443,828 $1,352,237 Single Family Condo/TIC/Coop April $500,000 $1,000,000 $1,500,000 $2,000,000 $2,500,000 $3,000,000 1-2005 1-2006 1-2007 1-2008 1-2009 1-2010 1-2011 1-2012 1-2013 1-2014 1-2015 1-2016 1-2017 1-2018 1-2019 1-2020 1-2021 Single Family Condo/TIC/Coop $1,975,984 $1,318,201 $2,053,979 $1,337,510 $2,253,689 $1,328,647 Single Family Condo/TIC/Coop Year to Date 2019 2020 2021 + 0.4% - 0.2% + 11.9% + 0.1% + 1.5% + 9.7% + 3.9% - 0.7% 2019 2020 2021 2019 2020 2021 2019 2020 2021 + 3.9% + 0.8% + 1.1% + 3.1%
  • 9. Days on Market Until Sale strong month for home sales. The busy spring market Single Family Year-Over-Year Change Condo/TIC/ Coop Year-Over-Year Change May-2020 24 +9.1% 40 +33.3% Jun-2020 26 +18.2% 34 +6.3% Jul-2020 25 +8.7% 38 +15.2% Aug-2020 24 -7.7% 40 +17.6% Sep-2020 25 -7.4% 45 +32.4% Oct-2020 27 +22.7% 41 +41.4% Nov-2020 33 +37.5% 50 +51.5% Dec-2020 35 +16.7% 62 +29.2% Jan-2021 37 +2.8% 70 +14.8% Feb-2021 30 +20.0% 62 +121.4% Mar-2021 23 +9.5% 45 +66.7% Apr-2021 19 -5.0% 44 +37.5% 12-Month Avg* 27 +11.3% 48 +40.6% Historical Days on Market Until Sale by Month Average number of days between when a property is listed and when an offer is accepted in a given month. * Days on Market for all properties from May 2020 through April 2021. This is not the average of the individual figures above. Current as of May 11, 2021. All data from the San Francisco MLS. Report © 2021 ShowingTime. | 9 27 38 20 32 19 44 Single Family Condo/TIC/Coop April 0 20 40 60 80 100 120 1-2005 1-2006 1-2007 1-2008 1-2009 1-2010 1-2011 1-2012 1-2013 1-2014 1-2015 1-2016 1-2017 1-2018 1-2019 1-2020 1-2021 Single Family Condo/TIC/Coop 29 40 25 36 25 53 Single Family Condo/TIC/Coop Year to Date 2019 2020 2021 + 37.5% - 15.8% - 5.0% - 25.9% - 10.0% 0.0% - 13.8% + 47.2% 2019 2020 2021 2019 2020 2021 2019 2020 2021 + 50.0% + 31.8% + 21.2% + 46.2%
  • 10. Inventory of Active Listings strong month for home sales. The busy spring market Single Family Year-Over-Year Change Condo/TIC/ Coop Year-Over-Year Change May-2020 685 +32.2% 1,336 +61.0% Jun-2020 780 +45.5% 1,561 +84.7% Jul-2020 857 +65.1% 1,920 +117.7% Aug-2020 920 +55.9% 2,096 +124.4% Sep-2020 926 +36.2% 2,305 +103.1% Oct-2020 921 +43.0% 2,337 +114.0% Nov-2020 783 +42.4% 2,070 +122.6% Dec-2020 572 +45.5% 1,473 +106.0% Jan-2021 564 +15.3% 1,550 +79.0% Feb-2021 571 -2.1% 1,511 +53.4% Mar-2021 522 -5.1% 1,436 +44.8% Apr-2021 454 -25.1% 1,211 +13.7% 12-Month Avg* 713 +28.5% 1,734 +84.6% Historical Inventory of Active Listings by Month The number of properties available for sale in active status at the end of a given month. * Active Listings for all properties from May 2020 through April 2021. This is not the average of the individual figures above. Current as of May 11, 2021. All data from the San Francisco MLS. Report © 2021 ShowingTime. | 10 512 838 606 1,065 454 1,211 Single Family Condo/TIC/Coop April 0 500 1,000 1,500 2,000 2,500 1-2005 1-2006 1-2007 1-2008 1-2009 1-2010 1-2011 1-2012 1-2013 1-2014 1-2015 1-2016 1-2017 1-2018 1-2019 1-2020 1-2021 Single Family Condo/TIC/Coop 2019 2020 2021 + 13.7% + 27.1% - 25.1% + 18.4% 2019 2020 2021 + 6.2% + 6.9%
  • 11. % of Properties Sold Over List Price strong month for home sales. The busy spring market Single Family Year-Over-Year Change Condo/TIC/ Coop Year-Over-Year Change May-2020 63.2% -21.4% 42.1% -33.6% Jun-2020 55.2% -31.6% 31.1% -51.4% Jul-2020 64.7% -21.1% 44.4% -36.5% Aug-2020 65.8% -20.3% 34.2% -40.5% Sep-2020 65.0% -12.8% 34.4% -41.4% Oct-2020 67.5% -16.0% 42.8% -33.8% Nov-2020 61.6% -20.2% 32.8% -49.2% Dec-2020 63.1% -7.6% 28.6% -38.8% Jan-2021 58.4% -6.7% 21.6% -33.5% Feb-2021 68.5% -6.5% 35.3% -44.4% Mar-2021 74.5% -4.7% 42.5% -29.4% Apr-2021 76.2% +8.9% 45.6% -23.7% 12-Month Avg 66.0% -14.4% 36.7% -38.7% Historical % of Properties Sold Over List Price by Month Percentage found when dividing the number of properties sold by properties sold over its original list price, not accounting for seller concessions. * % of Properties Sold Over List Price for all properties from May 2020 through April 2021. This is not the average of the individual figures above. Current as of May 11, 2021. All data from the San Francisco MLS. Report © 2021 ShowingTime. | 11 73.1% 55.7% 70.0% 59.8% 76.2% 45.6% Single Family Condo/TIC/Coop April 0.0% 20.0% 40.0% 60.0% 80.0% 100.0% 1-2005 1-2006 1-2007 1-2008 1-2009 1-2010 1-2011 1-2012 1-2013 1-2014 1-2015 1-2016 1-2017 1-2018 1-2019 1-2020 1-2021 Single Family Condo/TIC/Coop 71.7% 52.6% 72.1% 54.8% 71.0% 38.2% Single Family Condo/TIC/Coop Year to Date 2019 2020 2021 - 23.7% + 7.4% + 8.9% - 4.2% + 4.2% - 1.5% + 0.6% - 30.3% 2019 2020 2021 2019 2020 2021 2019 2020 2021 - 7.0% - 7.2% - 8.2% - 16.6%
  • 12. % of List Price Received strong month for home sales. The busy spring market Single Family Year-Over-Year Change Condo/TIC/ Coop Year-Over-Year Change May-2020 105.8% -6.4% 100.4% -6.0% Jun-2020 105.6% -8.2% 99.9% -6.8% Jul-2020 106.0% -8.0% 101.0% -6.0% Aug-2020 107.5% -6.1% 100.4% -4.7% Sep-2020 106.8% -5.2% 100.2% -4.5% Oct-2020 108.1% -4.8% 101.3% -4.3% Nov-2020 106.0% -5.3% 100.2% -4.7% Dec-2020 106.0% -3.5% 99.3% -3.6% Jan-2021 105.3% -1.6% 98.6% -1.8% Feb-2021 109.8% -1.6% 100.7% -4.3% Mar-2021 112.3% -1.6% 102.4% -1.6% Apr-2021 113.8% +4.6% 103.8% -1.4% 12-Month Avg* 108.0% -4.2% 100.9% -4.2% Historical % of List Price Received by Month Percentage found when dividing a property’s sales price by its most recent list price, then taking the average for all properties sold in a given month, not accounting for seller concessions. * % of List Price Received for all properties from May 2020 through April 2021. This is not the average of the individual figures above. Current as of May 11, 2021. All data from the San Francisco MLS. Report © 2021 ShowingTime. | 12 111.6% 104.9% 108.8% 105.3% 113.8% 103.8% Single Family Condo/TIC/Coop April 110.6% 104.0% 110.9% 103.8% 111.0% 101.8% Single Family Condo/TIC/Coop Year to Date 90.0% 100.0% 110.0% 120.0% 130.0% 1-2005 1-2006 1-2007 1-2008 1-2009 1-2010 1-2011 1-2012 1-2013 1-2014 1-2015 1-2016 1-2017 1-2018 1-2019 1-2020 1-2021 Single Family Condo/TIC/Coop 2019 2020 2021 - 1.4% + 0.4% + 4.6% - 2.5% 2019 2020 2021 - 6.4% - 3.9% 2019 2020 2021 - 1.9% - 0.2% + 0.1% + 0.3% 2019 2020 2021 - 5.3% - 2.3%
  • 13. Housing Affordability Ratio strong month for home sales. The busy spring market Single Family Year-Over-Year Change Condo/TIC/ Coop Year-Over-Year Change May-2020 35 +12.9% 59 +22.9% Jun-2020 32 +10.3% 54 +20.0% Jul-2020 35 +6.1% 53 +6.0% Aug-2020 35 +2.9% 56 +9.8% Sep-2020 35 0.0% 57 +18.8% Oct-2020 36 +5.9% 59 +20.4% Nov-2020 35 +2.9% 59 +13.5% Dec-2020 37 -2.6% 62 +19.2% Jan-2021 36 -2.7% 63 +14.5% Feb-2021 33 -2.9% 53 +3.9% Mar-2021 31 -6.1% 53 +8.2% Apr-2021 31 -8.8% 55 +7.8% 12-Month Avg* 34 -8.2% 34 +9.9% Historical Housing Affordability Ratio by Month This index measures housing affordability for the region. For example, an index of 120 means the median household income is 120% of what is necessary to qualify for the median-priced home under prevailing interest rates. A higher number means greater affordability. * Affordability Ratio for all properties from May 2020 through April 2021. This is not the average of the individual figures above. Current as of May 11, 2021. All data from the San Francisco MLS. Report © 2021 ShowingTime. | 13 31 48 34 51 31 55 Single Family Condo/TIC/Coop April 20 40 60 80 100 1-2005 1-2006 1-2007 1-2008 1-2009 1-2010 1-2011 1-2012 1-2013 1-2014 1-2015 1-2016 1-2017 1-2018 1-2019 1-2020 1-2021 Single Family Condo/TIC/Coop 2019 2020 2021 + 7.8% + 6.3% - 8.8% + 9.7% 2019 2020 2021 + 3.3% + 4.3% 33 50 35 53 33 55 Single Family Condo/TIC/Coop Year to Date 2019 2020 2021 + 3.8% + 6.0% - 5.7% + 6.1% 2019 2020 2021 + 6.5% + 4.2%
  • 14. Months Supply of Inventory strong month for home sales. The busy spring market Single Family Year-Over-Year Change Condo/TIC/ Coop Year-Over-Year Change May-2020 3.9 +56.0% 6.7 +103.0% Jun-2020 4.4 +69.2% 7.8 +122.9% Jul-2020 4.7 +88.0% 9.5 +156.8% Aug-2020 4.9 +69.0% 9.9 +153.8% Sep-2020 4.8 +45.5% 10.6 +125.5% Oct-2020 4.7 +46.9% 10.7 +137.8% Nov-2020 3.8 +40.7% 9.2 +142.1% Dec-2020 2.7 +42.1% 6.2 +106.7% Jan-2021 2.6 +8.3% 6.3 +80.0% Feb-2021 2.6 -10.3% 5.8 +45.0% Mar-2021 2.3 -17.9% 5.0 +19.0% Apr-2021 1.8 -45.5% 3.8 -22.4% 12-Month Avg* 3.6 +31.1% 7.6 +94.1% Historical Months Supply of Inventory by Month The inventory of homes for sale at the end of a given month, divided by the average monthly pending sales from the last 12 months. * Months Supply for all properties from May 2020 through April 2021. This is not the average of the individual figures above. Current as of May 11, 2021. All data from the San Francisco MLS. Report © 2021 ShowingTime. | 14 2.5 3.4 3.3 4.9 1.8 3.8 Single Family Condo/TIC/Coop April 0.0 2.0 4.0 6.0 8.0 10.0 12.0 1-2005 1-2006 1-2007 1-2008 1-2009 1-2010 1-2011 1-2012 1-2013 1-2014 1-2015 1-2016 1-2017 1-2018 1-2019 1-2020 1-2021 Single Family Condo/TIC/Coop 2019 2020 2021 - 22.4% + 44.1% - 45.5% + 32.0% 2019 2020 2021 + 8.7% + 9.7%
  • 15. All Properties Activity Overview Key metrics by report month and for year-to-date (YTD) starting from the first of the year. Key Metrics Historical Sparkbars 4-2020 4-2021 Percent Change YTD 2020 YTD 2021 Percent Change Current as of May 11, 2021. All data from the San Francisco MLS. Report © 2021 ShowingTime. | 15 Months Supply 4.1 3.0 - 26.8% -- -- -- Affordability Ratio 37 37 0.0% % of List Price Received 107.1% 107.8% + 0.7% 106.8% 40 50.5% - 18.9% - 1.4% 40 0.0% 105.3% % of Properties Sold Over List Price 64.9% 57.7% - 11.1% 62.3% Active Listings 1,704 1,701 - 0.2% -- Avg. Sales Price $1,770,982 $1,780,886 + 0.6% $1,655,659 Days on Market 26 34 + 30.8% 31 $1,360,000 - 1.1% + 1.6% 43 + 38.7% $1,681,434 -- -- Sold Listings 242 736 + 204.1% 1,249 2,348 + 88.0% Median Sales Price $1,380,000 $1,425,000 + 3.3% $1,375,000 + 34.6% Pending Sales 175 740 + 322.9% 1,207 2,585 + 114.2% New Listings 411 583 + 41.8% 2,195 2,955 4-2018 4-2019 4-2020 4-2021 4-2018 4-2019 4-2020 4-2021 4-2018 4-2019 4-2020 4-2021 4-2018 4-2019 4-2020 4-2021 4-2018 4-2019 4-2020 4-2021 4-2018 4-2019 4-2020 4-2021 4-2018 4-2019 4-2020 4-2021 4-2018 4-2019 4-2020 4-2021 4-2018 4-2019 4-2020 4-2021 4-2018 4-2019 4-2020 4-2021 4-2018 4-2019 4-2020 4-2021
  • 16. Activity by District SF District 1: Northwest (Sea Cliff, Lake, Jordan Park / Laurel Heights, Outer Richmond, Central Ric April was SF District 2: Central West (Outer Sunset, Central Sunset, Inner Sunset, Outer Parkside, Parkside, Inner Parkside, Golden Gate Heights) SF District 3: Southwest (Pine Lake Park, Lake Shore, Merced Manor, Stonestown, Lakeside, Merced Heights, Ingleside, Ingleside Heights, Oceanview) SF District 4: Twin Peaks W (Forest Hill (& Ext), W Portal, St Francis Wd, Balboa Terr, Mt Dav Manor, Ingleside Terr, Monterey Hts, Wstwd Pk & H'lnds, Shrwd Fst, Miraloma Pk, Dmnd Hts, Mdtwn Terr) SF District 5: Central (Haight Ashbury, Cole Vly / Prnssus Hts, Clarndn Hts, Corona Hts, Twin Pks, Glen Pk, Noe Vly, Eureka Vly / Dolores Hts, Mission Dolores, Duboce Trngl, Buena Vista / Ashbury Hts) SF District 6: Central North (Lower Pacific Heights, Anza Vista, Western Addition, North Panhandle, Alamo Square, Hayes Valley) SF District 7: North (Marina, Cow Hollow, Presidio Heights, Pacific Heights) SF District 8: Northeast (North Waterfront, North Beach, Russian Hill, Telegraph Hill, Nob Hill, Financial District / Barbary Coast, Downtown, Van Ness / Civic Center, Tenderloin) SF District 9: Central East (Yerba Buena, South Beach, South of Market, Mission Bay, Inner Mission, Potrero Hill, Central Waterfront / Dogpatch, Bernal Heights) SF District 10: Southeast (Outer Mission, Mission Terr, Excelsior, Portola, Bayview, Silver Terr, Hunters Pt, Candlestick Pt, Bayview Hts, Little Hollywood, Visitation Vly, Crocker Amazon) 4-2020 4-2021 + / – 4-2020 4-2021 + / – 4-2020 4-2021 + / – 4-2020 4-2021 + / – 4-2020 4-2021 + / – Single Family 1 SF District 1 60 23 -61.7% 9 17 +88.9% $1,765,000 $2,482,000 +40.6% 25 20 -20.0% 3.7 1.1 -70.3% 2 SF District 2 57 44 -22.8% 18 57 +216.7% $1,415,000 $1,688,000 +19.3% 14 13 -7.1% 1.7 1.1 -35.3% 3 SF District 3 25 28 +12.0% 10 19 +90.0% $1,148,750 $1,400,000 +21.9% 24 15 -37.5% 1.9 1.7 -10.5% 4 SF District 4 59 39 -33.9% 18 39 +116.7% $1,952,500 $2,040,000 +4.5% 14 12 -14.3% 2.5 1.1 -56.0% 5 SF District 5 128 85 -33.6% 17 47 +176.5% $2,700,000 $2,535,000 -6.1% 22 24 +9.1% 4.8 2.2 -54.2% 6 SF District 6 22 13 -40.9% 3 6 +100.0% $2,155,000 $3,190,000 +48.0% 24 19 -20.8% 6.0 2.4 -60.0% 7 SF District 7 51 42 -17.6% 6 19 +216.7% $7,750,000 $5,900,000 -23.9% 48 33 -31.3% 7.2 3.9 -45.8% 8 SF District 8 21 19 -9.5% 0 3 -- $0 $2,100,000 -- 0 68 -- 8.8 7.5 -14.8% 9 SF District 9 70 67 -4.3% 9 37 +311.1% $1,699,000 $1,675,000 -1.4% 19 21 +10.5% 3.8 2.2 -42.1% 10 SF District 10 113 94 -16.8% 30 42 +40.0% $1,060,000 $1,180,000 +11.3% 19 17 -10.5% 2.8 2.0 -28.6% Condo/TIC/Coop 1 SF District 1 48 22 -54.2% 12 22 +83.3% $1,507,500 $1,392,500 -7.6% 52 24 -53.8% 4.0 1.2 -70.0% 2 SF District 2 16 12 -25.0% 2 8 +300.0% $1,400,000 $1,150,000 -17.9% 7 14 +100.0% 3.8 2.1 -44.7% 3 SF District 3 2 5 +150.0% 0 6 -- $0 $1,359,000 -- 0 98 -- 0.5 1.5 +200.0% 4 SF District 4 12 9 -25.0% 2 5 +150.0% $855,000 $1,000,000 +17.0% 20 24 +20.0% 2.3 1.7 -26.1% 5 SF District 5 132 101 -23.5% 18 63 +250.0% $1,390,000 $1,350,000 -2.9% 15 29 +93.3% 4.0 1.9 -52.5% 6 SF District 6 80 94 +17.5% 6 41 +583.3% $1,437,500 $1,180,000 -17.9% 17 34 +100.0% 3.8 2.6 -31.6% 7 SF District 7 92 100 +8.7% 13 55 +323.1% $1,398,000 $1,595,000 +14.1% 36 38 +5.6% 4.2 2.7 -35.7% 8 SF District 8 199 231 +16.1% 19 73 +284.2% $1,200,000 $1,175,000 -2.1% 45 49 +8.9% 5.4 4.7 -13.0% 9 SF District 9 440 585 +33.0% 39 161 +312.8% $1,100,000 $1,160,000 +5.5% 32 53 +65.6% 5.9 5.8 -1.7% 10 SF District 10 44 52 +18.2% 6 7 +16.7% $753,000 $690,000 -8.4% 31 66 +112.9% 7.7 7.8 +1.3% Key metrics by report month for the districts of San Fransisco. Current as of May 11, 2021. All data from the San Francisco MLS. Report © 2021 ShowingTime. | 16 Active Listings Sold Listings Median Sales Price Days on Market Months Supply