Measurement of performance at Organisational Level.pptx
•Download as PPTX, PDF•
0 likes•21 views

Kerala university MBA Performance management

Recommended
More Related Content
Similar to Measurement of performance at Organisational Level.pptx
Similar to Measurement of performance at Organisational Level.pptx (20)
More from POOJA UDAYAN
More from POOJA UDAYAN (20)
Recently uploaded
Recently uploaded (20)
Measurement of performance at Organisational Level.pptx
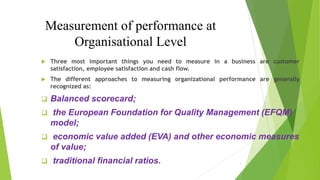
- 1. Measurement of performance at Organisational Level Three most important things you need to measure in a business are customer satisfaction, employee satisfaction and cash flow. The different approaches to measuring organizational performance are generally recognized as: Balanced scorecard; the European Foundation for Quality Management (EFQM) model; economic value added (EVA) and other economic measures of value; traditional financial ratios. 1
- 2. The balanced scorecard Originally developed by Kaplan and Norton (1992) They take the view that what you measure is what you get , and they emphasize that no single measure can provide a clear performance target or focus attention on the critical areas of the business. Managers want a balanced presentation of both financial and operational measures . It is a set of measures that gives top managers a fast but comprehensive view of their business. The scorecard requires managers to answer four basic questions, which means looking at the business from four related perspectives: 1. How do customers see us? (customer perspective); 2. What must we excel at? (internal perspective); 3. Can we continue to improve and create value? (innovation and learning perspective) 2
- 3. 3
- 4. 4
- 5. 5
- 6. 6
- 7. 7
- 8. 8
- 9. 9
- 10. 10
- 11. 11
- 12. 12
- 13. 13
- 14. The European Foundation for Quality Management (EFQM) The EFQM model indicates that customer satisfaction, people (employee) satisfaction and impact in society are achieved through leadership. This drives the policy and strategy ,people management, resources and processes, leading to excellence in business results. 14
- 15. The nine elements in the model are defined as follows: 1 Leadership how the behaviour and actions of the executive team and all other leaders inspire, support and promote a culture of total quality management. 2 Policy and strategy how the organization formulates, deploys and reviews its policy and strategy and turns it into plans and actions. 3 People management how the organization realizes the full potential of its people. 4 Resources how the organization manages resources effectively and efficiently. 5 Processes how the organization identifies, manages, reviews and improves its processes. 6 Customer satisfaction what the organization is achieving in relation to the satisfaction of its external customers. 7 People satisfaction what the organization is achieving in relation to the satisfaction of its people. 8 Impact on society What the organization is achieving in satisfying the needs and the expectations of the local, national and international community at large. 9 Business results what the organization is achieving in relation to its planned business objectives and in satisfying the needs and expectations of everyone with a financial interest or stake in the organization. 15
- 16. EFQM model can help performance management by: developing a fuller understanding of how business results are achieved and processes continually improved; offering mechanisms for tackling systems problems in the workplace; promoting performance management as a two-way dialogue; providing a positive and universal framework for the description of jobs and roles; helping to align individual and business objectives; pointing the way to identifying, defining and building the capabilities that the organization needs its people to demonstrate. 16
- 17. Economic value added (EVA) Economic Value Added (EVA) is an accounting measure of the value a company creates. EVA = (Return on Capital - Cost of Capital) x (Capital Invested) The economic value added (EVA) measure represents the difference between a companys post-tax operating profit and the cost of the capital invested in the business. The theory of EVA is that it is not good enough for a company simply to make a profit. It has to justify the cost of its capital, equity included. If it is not covering that, it will not make good returns for investors. Traditional financial ratios The traditional financial measures include: return on equity, return on capital employed, earnings per share, price/earnings ratio, return on sales, asset turnover, overall overheads/sales ratio, profit or sales or added value per employer, and output per employee (productivity). 17
- 18. Performance Dash Board A dashboard is a visual display of the most important information needed to achieve one or more objectives; consolidated and arranged on a single screen so the information can be monitored at a glance. Performance dashboards are common management tools used to gauge performance and enable business people to measure, monitor, and manage the key activities and processes needed to achieve business goals. They can be designed and developed to direct a wide range of objectives, from monitoring the usability of a global organization’s business strategy to keeping a check on a department’s ability to achieve targets. three main sets of functionality: • Monitor critical business processes and activities using business performance metrics that alert users to potential problems. • Analyze the root cause of problems by digging into relevant and timely information. • Manage people and processes in order to improve decisions and optimize business performance. 18
- 19. Key Characteristics of Great Dashboards • They communicate information quickly. • They display information clearly and efficiently. • They show trends and changes in data over time. • They are easily customizable. • The most important widgets and data components are effectively presented in a limited space. There are 4 general subtypes of dashboards: 1. Strategic - focused on long-term strategies and high-level metrics 2. Operational - shows shorter time frames and operational processes. 3. Analytical - contains vast amounts of data created by analysts. 4. Tactical - used by mid-management to track performance. 19