Visible light assisted photocatalytic reduction of CO2 using a graphene oxide supported heteroleptic ruthenium complex
•
0 likes•62 views

A new heteroleptic ruthenium complex containing 2-thiophenyl benzimidazole ligands was synthesized using a microwave technique and was immobilized to graphene oxide via covalent attachment. The synthesized catalyst was used for the photoreduction of carbon dioxide under visible light irradiation without using a sacrificial agent, which gave 2050 μmol g−1 cat methanol after 24 h of irradiation

Recommended
Recommended
More Related Content
What's hot
What's hot (18)
Similar to Visible light assisted photocatalytic reduction of CO2 using a graphene oxide supported heteroleptic ruthenium complex
Similar to Visible light assisted photocatalytic reduction of CO2 using a graphene oxide supported heteroleptic ruthenium complex (20)
More from Pawan Kumar
More from Pawan Kumar (20)
Recently uploaded
Recently uploaded (20)
Visible light assisted photocatalytic reduction of CO2 using a graphene oxide supported heteroleptic ruthenium complex
- 1. Supporting Information Visible light assisted photocatalytic reduction of CO2 using graphene oxide supported heteroleptic ruthenium complex Pawan Kumar,a Amit Bansiwal,b Nitin Labhsetwarb and Suman L. Jaina* aChemical Sciences Division CSIR-Indian Institute of Petroleum, Dehradun-248005 (India) *Email: Suman@iip.res.in bCSIR-National Environmental Engineering Research Institute (CSIR-NEERI), Nehru Marg, Nagpur-440020, India 1. Experimental 1.1 Materials o-phenylenediamine (99.5%), thiophene 2-carboxaldehyde (98%), cadmium chloride (99.9%), ruthenium(III) chloride trihydrate, 2,2’ bipyridine(bpy, ≥99%), graphite flakes, triethylamine(99%) were purchased from Sigma Aldrich. Dichloromethane, potassium permanganate (99.0%), sodium nitrate (99%), concentrated sulphuric acid, hydrogen peroxide (30%), hydrochloric acid (35%), chloroacetic acid (≥99%), NaOH, thionyl chloride (≥99%), acetonitrile, ethylene glycol, sodium sulphate and HPLC grade water were purchased from MERCK India. All the chemicals and solvents were of analytical grade and used as received. 1.2 Synthesis of 2-thiophenyl-benzimidazole ligand1 o-phenylenediamine (1.08g, 10 mmol), thiophene 2-carboxaldehyde (1.12 g, 10 mmol) were taken into a round bottomed flask and then cadmium chloride (91.5 mg, 10 mol%) was added as a catalyst. The resulting mixture was refluxed in acetonitrile (25 mL) at 80-85 ᵒC for 4 hours. TLC was used for monitoring progress of reaction. After completion of reaction confirmed by TLC, solvent was removed with the help of rotary evaporator. The residue was dissolved in ethyl acetate and washed with water and brine solution. Compound containing ethyl acetate layer was Electronic Supplementary Material (ESI) for Green Chemistry. This journal is © The Royal Society of Chemistry 2014
- 2. dried over sodium sulfate. After removing ethyl acetate, crude product was obtained. Further purification was achieved through column chromatography by using ethyl acetate/hexane (3/7) as mobile phase. The final product (yield 84%) was identified with 1H NMR (Fig S1), δH (500 MHz, DMSO-d6) 7.83-7.84(1H, d), 7.73-7.74 (1H, d), 7.23-7.25 (1H, dd), 7.45-7.65 (2H, d), 7.21 (2H, s), 3.32 (NH, 1H, s). 1.3 Synthesis of heteroleptic ruthenium complex with Sulfur ligand2 Ru(bpy)2Cl2.2H2O (0.838 g, 2.0 mmol) synthesized by Sullivan at. el. method and benzimidazole based sufur ligand(0.4g, 2 mmol) was taken in a round bottom flask. Ethylene glycol(20 mL) and triethylamine(1 mL) was added to it and the resulting mixture was reacted in a microwave reactor (Milestone SRL microwave reactor for synthesis ) operating at 400W and 125 ᵒC for 1 hour. After cooling at room temperature, reaction mixture was poured to 250 mL aqueous solution of NH4PF6 for precipitating the complex. The resulting suspension was stirred for 12 hour and obtained precipitate was collected by vacuum filtration. Compound was purified by dissolving the precipitate in DCM and washing with brine. Organic layer was dried over Na2SO4 and concentrated using a rotary evaporator. The solid film was triturated with hexane and collected with vacuum filtration. Yield- 66%, Melting Point – 263.7 ᵒC, ICP-AES; Ru-10.8%, calculated-11.18%, elemental analysis; C-45.615%, H-2.98%, N-8.86%, S-3.76% calculated- C- 41.17%, H-2.66%, N-9.29%, S-3.54%, Sulfur content by X-ray fluorescence(XRF); - 3.48%, UV-Vis; λmax- 241, 297, 372, 555(MLCT) nm and ESI-HRMS(M+-S benzimidazole+6H+- 709.07, M+-2PF6- 613.07, M+-bpy- PF6-F--H+-581.00, M+-2bpy-PF6+2H+-449.01) Fig. S4-Fig. S7. Further 1H NMR, 13C NMR was used for identification of complex Fig. S2 and Fig. S3. 1H NMR (500 MHz, DMSO-d6) 8.63-7.16 (m, Ar-H), 6.2-6.7 (d, 1H, proton has a very short
- 3. distance to an adjacent bipy ligand), 3.1 (s, NH); 13C NMR δ (500 MHz, DMSO-d6, 124.93, 128.35, 138.39, 151.66, 156.98). 1.4 Synthesis of graphene oxide3 Graphene oxide (GO) was synthesized by Modified Hummer’s method. In briefly, graphite flakes (2 g) was taken in a round bottom flask and this flask was immersed in an ice bath. Then H2SO4 (68 mL) sodium nitrate (1.50 g) was added simultaneously and stirred for 5 minutes. After that KMnO4 (9.0 g) was added slowly to this mixture and stirred for 5 days. 100 mL diluted H2SO4 (5 wt %) was added to this and heated at 90 °C for 2 hours with continuous stirring. After that 30 wt % H2O2 solution (approximately 5.4 mL) was added and stirred for 2 hour at room temperature. GO was collected by centrifugation (6000 rpm) of mixture and washed with H2SO4 (3 wt%), H2O2 (0.5 wt%) and HCl (3 wt%). Finally washing was done with distilled water until pH of washing became neutral. 1.5 Synthesis of carboxylated graphene oxide4 A suspension was made by dispersing graphene oxide (0.4 g) in distilled water (200 mL) with the help of ultrasonication. To this suspension, NaOH (2.4 g), chloroacetic acid (2.0 g) was added and further sonicated for 3 h for converting hydroxyl (-OH) and epoxy groups of GO to carboxylic groups (-COOH). The pH of suspension containing GO-COOH was adjusted to neutral by adding dilute HCl. GO-COOH was collected by centrifugation, washed 3 times with distilled water and dried. 1.6 Immobilization of Ru complex 1 to GO support5 Before immobilization step, carboxylic (–COOH) groups of GO-COOH was converted to carbonyl chloride(-COCl) by treatment with thionyl chloride at refluxing temperature. Unreacted thionyl chloride was removed with vaccum distillation. Obtained GO-COCl was washed with
- 4. dry THF three times and dried under vacuum. For immobilization, GO-COCl(200 mg), ruthenium complex 1(50 mg) and DMF(30 mL) was taken in a round bottom flask and sonicated for making a suspension. The resulting suspension was refluxed in the presence of triethyl amine(2 mL) under nitrogen atmosphere for 24 h. After cooling to room temperature GO-Ru catalyst 2 was separated by centrifugation and washed with ethanol until washing became colorless for removing unreacted complex. Ruthenium content in the synthesized heterogeneous catalyst as determined by ICP-AES analysis was found to be 5.15 wt % (0.51 mmol/g cat). 2.0 Techniques used X-Ray diffraction pattern of ruthenium complex, GO and photocatalyst was recorded on Bruker D8 Advance diffractometer at 40 kV and 40 mA with Cu Kα radiation (λ= 0.15418 nm) and sample for XRD was prepared on glass slide by adding well dispersed catalyst in slot and drying properly. Fourier Transform Infrared Spectra was recorded on Perkin–Elmer spectrum RX-1 IR spectrophotometer using Potassium bromide window. Scanning electron microscopic (SEM) images of synthesized GO and GO-Ru catalyst 2 for determining surface morphology was executed using FE-SEM (Jeol Model JSM-6340F). High Resolution Transmission Electron Microscopy was used for determining fine structure of GO and catalyst by using FEI-TecnaiG2 Twin TEM operating at an acceleration voltage of 200 kV. Samples for HR-TEM analysis was made by dispersing catalyst in water and depositing on carbon coated copper grid. UV-Visible absorption Spectra of Ruthenium complex in DCM and solid GO and GO-Ru catalyst was collected on Perkin Elmer lambda-19 UV-VIS-NIR spectrophotometer using a 10 mm quartz cell, using BaSO4 as reference. Brunauer-Emmet-Teller (BET) surface area, Barret-Joiner- Halenda (BJH) porosity, Pore Volume etc. surface properties of GO and GO-Ru catalyst were examined by N2 adsorption-desorption isotherm at 77 K by using VP; Micromeritics ASAP2010.
- 5. For calculating thermal stability of Ruthenium complex, GO, GO-Ru catalyst thermo gravimetric analyses (TGA) was carried out using a thermal analyzer TA-SDT Q-600. Analysis was carried out in the temperature range of 40 to 800 °C under nitrogen flow with heating rate 10 °C/min. 1H-NMR and 13C NMR spectra of Sulfur based imidazole ligand, and ruthenium catalyst was collected by using Bruker Avance-II 500 MHz instrument working at 500 MHz frquency. Inductively coupled plasma-atomic emission spectroscopy(ICP-AES) was used for determining ruthenium content with the help of Inductively Coupled Plasma Atomic Emission Spectrometer (ICP-AES, DRE, PS-3000UV, Leeman Labs Inc, USA). For ICP-AES 0.05 g catalyst was leached out using 1 mL conc. HNO3 with heating and final volume was made up to10 mL by adding distilled water. ESI-High Resolution Mass spectra of Ruthenium complex for identification was performed on (Thermo Exactive Orbitrap system in HESI mode). Elemental analysis (CHNS) was done for confirming ruthenium complex synthesis and also to check for any possible metal leaching during incorporation on graphene oxide. Sulfur content of ruthenium complex was also calculated with X-ray fluorescence (XRF model No. OXFORD-LAB- X3500SCl). Electrochemical analysis of ruthenium complex 1 was performed by using a Electrochemical Workstation (Bioanalytical Systems (BASi) Epsilon potentiostat and three- electrode, single chamber cell. Solutions were made in 0.1 M tetra-n-butylammonium hexafluorophosphate (Bu4NPF6) in spectrophotometric grade acetonitrile (Himedia). The working electrode was a Pt disk, the auxiliary electrode was a glassy carbon Pt wire and potentials were measured against either a Ag/AgCl (3M NaCl) reference electrode or Ag wire quasi-reference electrode (QRE), each calibrated against a FeCp2 0/+ internal standard (0.46 V vs Ag/AgCl). The scan rate was 100 Mv/s and the initial concentration of analyte was changed 50 mg to 200mg for getting better response.
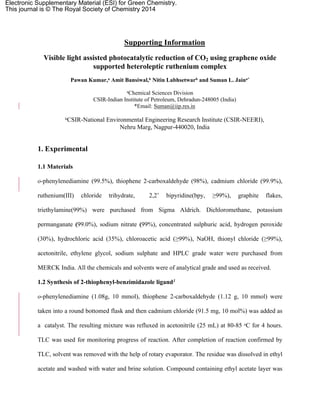
- 6. Fig. S1: 1H NMR of sulphur containing ligand in DMSO d6
- 7. Fig. S2: 1H NMR of Ruthenium heteroleptic complex 1 in DMSO d6 Fig. S3: 13C NMR of ruthenium heteroleptic complex 1 in DMSO d6
- 8. Fig. S4: ESI-HRMS of ruthenium complex 1
- 9. Fig. S5: ESI-HRMS of ruthenium heteroleptic complex1 (expanded 770-1000 m/z)
- 10. Fig. S6: ESI-HRMS of ruthenium heteroleptic complex1 (expanded 594-624 m/z)
- 11. Fig. S7: ESI-HRMS of ruthenium heteroleptic complex1 (expanded 400-590 m/z)
- 12. 3.0 Characterization of the GO immobilized ruthenium catalyst Surface properties of GO and GO-Ru 2 was determined by N2 adsorption–desorption isotherms (Fig. S8). Isotherm of GO was of type IV that was in well conformity with mesoporous nature of GO while for GO-Ru catalyst 2 isotherm was of type (II).6 The BET surface area (SBET) of GO was found to be 82.21 m2.g-1 that was decreased remarkably to 32.40 m2.g-1 after the attachment of ruthenium complex 1 to GO. Further pore volume (Vp) and mean pore diameter (Rp) for GO was found to be 0.11 cm3.g-1 and 5.56 nm respectively while for catalyst 2 these values were found to be 0.48 cm3.g-1 and 28.67 nm respectively as shown in Fig. S9. This reduction in surface area and enhancement in pore diameter were attributed to the intercalation of ruthenium complex 1 between GO sheets.7 Fig. S8: Adsorption desorption isotherm of a) GO and b) GO-Ru catalyst 2
- 13. Fig. S9: Pore diameter of a) GO b) GO-Ru catalyst 2 XRD Fig. S10 shows the XRD pattern of the synthesized materials. As shown in Fig. S10a, the peaks at 2θ=31.8ᵒ, 45.4ᵒ, 56.5ᵒ, 66.2ᵒ and 75.2ᵒ were corresponding to the homogeneous complex 1. However, in the XRD pattern of GO, the characteristics peak at 2θ=10.8o was observed due to the 001 plane (Fig. S10b).8 However, in XRD pattern of catalyst 2 (Fig. S10c), this peak was disappeared and a broad diffraction of graphite (002) at 2θ value ~ 26o was appeared.9 It is most likely due to the insertion of complex 1 moieties in between the GO sheets, which resulted in increase of interlayer distance between of GO sheets (Fig. S10c). Further the XRD pattern clearly indicated that material was amorphous in nature.
- 14. Fig. S10: XRD Pattern: a) Ruthenium complex 1; b) GO and c) GO-Ru catalyst 2 SEM The surface morphology of GO and GO-Ru catalyst 2 was explored by scanning electron microscopy (SEM). From FE-SEM images of GO (Fig. S11a), it was clear that GO sheets were randomly aggregated, thin, crumpled and closely associated with each other to form a disordered solid. The SEM image of GO-Ru 2 (Fig. S11b) clearly indicated that the sheets were separated and the material became fluffy probably due to the intercalation of complex moieties in between the GO sheets. Elemental composition of 2 as determined by EDX analysis clearly indicated the presence of ruthenium in the synthesized material (Fig. S11c).
- 15. Fig. S11: SEM images of a) GO b) GO-Ru catalyst 2 and c) EDX pattern of 2 TEM The fine structure of GO and GO-Ru catalyst 2 was evaluated by TEM (Fig. S12a,b). As shown in Fig. S12a, the TEM image of GO showed twisted and crumpled nanosheets. After attachment of 1 to GO sheets, agglomerated structures were achieved. This is probably due to the intercalation of complex moieties between the GO sheets and therefore, interaction between π system of complex and GO was increased. Selected area electron diffraction (SAED) pattern of the catalyst showed that the material was amorphous in nature (Fig. S12c).
- 16. Fig. S12: TEM images of a) GO; b) GO-Ru catalyst 2 and c) SAED pattern of of GO-Ru catalyst 2 FTIR The FT-IR spectra of complex 1 (Fig. S13b) reveals the characteristic peaks at 1461, 1160 and 842 cm-1 due to the presence of imidazole ligand. Vibrational spectra of the GO Fig. S13c exhibited bands at 3400, 1743, 1621, 1228, and 1025 cm−1 due to the stretching vibration of O–H, C=O, C=C, C–O and bending vibration of C–O–C respectively.10 After attachment of Ru complex to GO, shifting of peak at 1743 cm-1 to 1720 cm-1 and emergence of some peaks of Ru complex at 1392 cm-1 and 1116 cm-1 was in well conformity to the successful attachment of complex 1 to GO (Fig. S13d). Further increase in intensity of peak at 1577 was assigned due to the amide group (-CO-NH-) formation.11
- 17. Fig. S13: FTIR spectra of a) S-benzimidazole ligand b) Ruthenium complex1 c) GO and d) GO-Ru catalyst 2 UV-Vis As shown in Fig. S14. UV-Vis absorption spectra of ruthenium complex 1 shows two strong peaks at 241 nm and 297 nm due to the inter ligand π→π* transitions. Another relatively less intense peak at 372 nm was assumed to be related to the ligand S0-S1 transitions. A shoulder at 555 nm (MLCT) was observed due to the overlapping of ruthenium d(π) and ligands π* orbitals.12 GO shows characteristics absorption band at 230 nm due to π→π* transition of aromatic ring electrons and a small shoulder at 300 nm due to n→π* of carbonyl groups.13 After attachment of complex 1 to GO, red shift of absorption band of GO from 230 nm to 304 nm revealed that most of the epoxide bonds were used for bond formation. Further increase in the area of graph in visible region was due to the successful immobilization of ruthenium complex to GO. For comparing the effect of ligands on the UV-Visible absorbance, we have taken UV-Vis spectrum of a mixture containing ruthenium trichloride
- 18. (5 wt%) and GO (Fig. S14c). It shows an absorption band near 300 nm specific to GO and no any sharp absorption band was observed in the visible region. This clearly indicated that attachment of ligands in complex 1 and subsequently covalent attachment to GO, which significantly enhanced the absorption pattern of GO-Ru 2 in the visible region. Fig. S14: UV/Vis absorption spectra of a) Ru complex 1 b) GO c) 5% RuCl3/GO and d) GO-Ru catalyst 2 TGA To determine the thermal degradation pattern of synthesized materials, TGA analysis was performed (Fig. 6). Thermogram of complex 1 exhibited a sharp weight loss in the region between 250°C-400°C probably due to the degradation of ligand molecules (Fig. S15a). The TGA of GO (Fig. S15b), revealed two major weight losses, the first weight loss (approx. 15%) at 100 °C was due to the loss of water present between interlayer of GO sheets and second weight loss between 150 °C to 250 °C (approx 30%) was probably due to the loss of
- 19. oxygen containing functional groups such as –COOH, -OH etc. After that a constant weight loss was observed, which was assumed due to the degradation of carbonaceous material (Fig. S15b). The TGA graph of catalyst 2 (Fig. S15c) showed a constant weight loss in the region between 100-800 oC, suggesting that the oxygen functional groups of the GO were utilized in the chemical attachment of ruthenium complex to GO.14 Fig. S15: TGA of a) Ru-complex 1 b) GO c) GO-Ru catalyst 2 4.0 Photocatalytic CO2 reduction experiment For the photocatalytic CO2 reduction experiment, in a cyclinderical vessel (5cm dia.) 10 mL HPLC grade water and 40 mL DMF was taken and purged 15 minutes with nitrogen for removing any dissolved gas. After that CO2 was puged through solution for saturating the solution. Finally the vessel was loaded with 100 mg catalyst, sealed with rubber septum and illuminated with 20 watt white cold LED flood light (Model No.-HP-FL-20W-F-Hope LED Opto-Electric Co. Ltd) Fig. S16. The vessel was kept about 3 cm away from the light source and the intensity of the light at the vessel was 85 W/m2 as measured by intensity meter. After various intervals, samples was collected with the help of long needle having a syringe filter (2 nm PTFE,
- 20. 13 mm diameter) for removing catalyst. Methanol yield calculation was done with response of time was by gas chromatography (GC-FID) equipped with 30 m long Stabilwax® w/Integra- Guard® column at the flow rate 0.5 mL/min, injector temp 250 °C and FID detector temperature 275 °C. A calibration curve was plotted for dtermining the linear response of GC-FID at various concentrations and quantification of methanol. Fig. S17. For quantitative determination of methanol produced, 1.0 µL sample was withdrawn and injected in GC. The obtained peak area was correlated with calibration curve that was directly proportional to concentration of methanol. The well resolved peak of methanol in GC chromatogram of reaction mixture and absence of peak of any other possible products was in well confirmity of higher activity and selectivity of methanol (Fig. S18). For confirming that obtained methanol was photoreduction product of CO2 three blank reactions was also performed, in the first, all the conditions were same(same illumination, time, solvent system and purging with CO2), except no catalyst was added (catalyst blank). In the second set photocatalyst was added but reaction was not illuminated (illumination blank), while for the third blank, in place of CO2 nitrogen gas was purged and reaction was illuminated in visible light (CO2 blank). In all the above three experiments, there was no organic product found, which confirms that produced methanol was photoreduction product of CO2. GC-Mass analysis of photoreduction product by using 13CO2 in place of 12CO2 gave 13CH3OH as major reaction product, further confirms that the obtained methanol was originated due to photoreduction of CO2 Fig. S19. Further the gaseous phase analysis did not show any of possible by-product. For gas phase analysis: Gaseous products were analyzed using GC-TCD and GC-FID (Agilent 7890A GC system) using capillary column RGA, refinery gas analyzer) at the flow rate (H2: 35 mL/min, air: 350
- 21. mL/min, makeup flow: 27 mL/min, for TCD reference flow: 45 mL/min, Helium flow: 2 mL/min), injector temperature: 220°C, TCD detector temperature and FID detector temperature: 220°C. Fig. S17: Reaction irradiation condition
- 22. Fig. S17: Calibration curve for quantification of methanol
- 23. Fig. S18: GC chromatogram of photoreaction product Fig. S19: GC-Mass spectra of photoreaction product a) using 12CO2 B) using 13CO2
- 24. Table. S1: Anodic, cathodic, and half wave peak potentials (All potentials referenced vs. Ag/AgCl) References 1. B Sammaiah, D Sumalatha, GS Reddy, M Rajeswari and LN Sharada, Int. J. Ind. Chem., 2012, 3, 11-15. 2. T. Lundrigan, C. L. M. Jackson, Md. Imam Uddin, L. A. Tucker, Adeeb Al-Sheikh Ali, A. Linden, T. S. Cameron and A. Thompson, Can. J. Chem., 2012, 90, 693-700. 3. W. S. Hummers and R. E. Offeman, J. Am. Chem. Soc., 1958, 80, 1339. 4. X. Sun, Z. Liu, K.Welsher, J. T. Robinson, A. Goodwin, S. Zaric, and H. Dai, Nano Res. 2008, 1, 203-212. 5. R. Yamuna, S. Ramakrishnan, K. Dhara, R. Devi, N. K, Kothurkar, E. Kirubha, P. K. Palanisamy; J Nanopart Res, 2013, 15, 1399-1408. 6. IUPAC Recommendations; Pure Appl.Chem. 1994, 66, 1739. 7. J. Su, M. Cao, L. Ren, and C. Hu, J. Phys. Chem. C, 2011, 115, 14469–14477. 8. a) T. Nakajima, A. Mabuchi and R. Hagiwara, Carbon, 1988, 26, 357.; b) S. Stankovich, D. A. Dikin, R. D. Piner, K. A. Kohlhaas, A. Kleinhammes, Y. Jia, Y. Wu, S. T. Nguyen, and R. S. Ruoff, Carbon, 2007, 45, 1558–1565.
- 25. 9. a) H. Fujimoto, Carbon, 2003, 41, 1585–1592.; b) L. H. Tang, Y. Wang, Y. M. Li, H. B. Feng, J. Lu and J. H. Li, Adv. Funct. Mater., 2009, 19, 2782–2789. 10. G. I. Titelman, V. Gelman, S. Bron, R. L. Khalfin, Y. Cohen, and H. Bianco-Peled , Carbon, 2005, 43, 641-649. 11. X. Zhang, Y. Feng, P. Lv, Y. Shen, and W. Feng, Langmuir, 2010, 26, 18508–18511. 12. a) A. Basu, T. G. Kasar, and N.Y. Sapre, Inorg. Chem. 1988, 27, 4539-4542.; b) B. P. Sullivan, D. J. Salmon, and T. J. Meyer, Inorg. Chem., 1978, 17, 3334-3341.; c) C. Anderson, D. Salmon,T.J. Meyer and R. Young, J. Am. Chem. Soc. 1977, 99, 1980. 13. a) Y. D. Lei, Z. H. Tang, R. J. Liao and B. C. Guo, Green Chem., 2011, 13, 1655-1658.; b) L. Q. Xu, W. J. Yang, K.-G. Neoh, E.-T. Kang and G. D. Fu, Macromol., 2010, 43, 8336- 8339. 14. a) A. Lerf, H. He, M. Forster, and J. Klinowski, J. Phys. Chem. B. 1998, 102, 4477-4482.; b) X. Z. Tang, W. Li, Z. Z. Yu, M. A. Rafiee, J. Rafiee, F. Yavari, N. Koratkar, Carbon, 2011, 49, 1258-1265.