SlideShare a Scribd company logo
1 of 15
Download to read offline
ISSN 2349-7807
International Journal of Recent Research in Commerce Economics and Management (IJRRCEM)
Vol. 3, Issue 3, pp: (70-84), Month: July - September 2016, Available at: www.paperpublications.org
Page | 70
Paper Publications
EFFECTS OF SUPPLIER EFFECTIVENESS
ON ORGANIZATION PERFORMANCE AT
KENYA SEED COMPANY KITALE, KENYA
Jared Rodrick Nyaundi1
, Dr. Mike A. Iravo2
1
Jomo Kenyatta University of Agriculture & Technology (Msc. Procurement & Logistics)
2
Jomo Kenyatta University of Agriculture & Technology (Ph.D)
Abstract: Achieving competitive advantage in this competitive business environment is a challenge many managers
face. Most organizations are faced with the delays in product delivery, ability of suppliers to concert their
operating environment to create value. The supplier ineffectiveness, which affects organizational performance,
which is as a result of reluctance to develop suppliers, build relations, and establish quality management and
failure to use strategies which make suppliers a competitive advantage tool is a challenge. Even the process of
developing suppliers, selection and retention has not helped either. The study was carried out to establish the effect
of supplier effectiveness on organizational performance at Kenya Seed Company, Kitale. The main objectives
which guided the research included: to establish the effects of Supplier agility on organizational performance; to
investigate the process visibility on organizational performance; to find out the effect of supplier willingness on
organizational performance and to determine effect of supplier capabilities on organizational performance. To
explore these, a cross sectional study design was used. The target population was 360 from which 190 sample size
was deduced for the study. Data was collected using focused group discussions and small groups discussions self-
administered questionnaires, interview guides and content analysis to investigate the effect of supplier effectiveness
on organizational performance. Findings showed that supplier effectiveness has significant positive and negative
effects on performance. It was found that all the four components of supplier effectiveness influence the three
dimensions of performance. The study also found out that where supplier effectiveness is high, the performance on
organization is also higher, especially in areas that are affected by suppliers even though they may be internal to
the buyer organization. It was therefore concluded that supplier effectiveness is an essential strategic tool for
performance improvement. Hence organizations need to build relations that enhance supplier effectiveness so that
performance of both the suppliers and buyer organizations can realize the benefits of this relationship in the
supply chain network.
Keywords: Organization Performance, Process Visibility, Supplier Agility, Supplier Capabilities, Supplier effective
-ness & Supplier Willingness.
1. INTRODUCTION
Globally, modern competitive climate drives organizations demand to focus on their core competencies and outsource
non-core activities to external clients. Organizations want to increase if not improve, all aspects of their operations. These
organizations focus on operations that promise genuine success. Innovative strategies are required to create a competitive
advantage that allows for streamlining costs to boost profitability, revenue enhancements, product design and
organizational improvements to match customer demands, vendor organizational, delivery metrics, price effectiveness,
inventory flow, positive, image drive, good internal and external networks and flexibility when dealing with financial
uncertainties. These are operational activity outcomes that are hard to achieve alone (Irungu & Wanjau, 2011). The
ISSN 2349-7807
International Journal of Recent Research in Commerce Economics and Management (IJRRCEM)
Vol. 3, Issue 3, pp: (70-84), Month: July - September 2016, Available at: www.paperpublications.org
Page | 71
Paper Publications
concerned organisation must seek strategic approaches towards realization of success that can boost operational,
transformational and relational performances. In understanding this competitive organizational climate, emphasis is no
longer put on competition between single firms, but rather on the competition between entire supply chains (Wagner,
2006).
Improving operational performance has taken center stage for business transformational initiatives. Innovative tools,
approaches and technologies are enabling companies to better perform with greater agility, flexibility and precision.
Acceptable level performance is no longer achievable through owning abundance of time, resources and money.
Managers face significant challenges in managing operations (Gustafsson & Karlsson, 2012). Customers expect
consistent, personalized relationships, yet they have multiple points of contact that often are distributed geographically
and organizationally. They demand that products and services be delivered in days if not hours, yet hundreds if not
thousands of individuals must successfully coordinate their delivery. The breadth and complexity of organisational
operations now demand progressive approaches to assure operational success. Organistions operate in an environment
characterized by constant change, shorter product lifecycles, and increased demand uncertainty. This drives organisations
towards initiatives that enhance sustainable source of competitive advantage. These can be forces emerging as dominant
competitive vehicle for organizations operating in uncertain and ever-changing business environment (Aberdeen Group,
2009).
Although the modern competitive organisational climate drives organisations towards focusing on their core competencies
mainly and outsources non-core products or services to external suppliers, this approach has not been a common practice.
Companies are becoming increasingly depending on external suppliers for resources and complementary capabilities. It is
only a common practice in Europe, and United States of America where outsourcing contracts are procured to Asian
industries (Holter, Grant, Ritchie, & Shaw, 2008). It means that the supply chain strength in these countries is quite
stronger than that in Africa where the practice is minimal (Krauth, Moonen, Popova, & Schut, 2005). While some
organizations are succeeding in some critical operational, transformational and relational areas of focus, most of them are
not effectively managing these areas at all. Industry analysis suggests operational, transformational and relational
performance gaps begin at the strategic level and carry through to a specific process breakdown. In addition, operations,
transformational and relational functions often lack continuous improvement efforts targeting these inefficiencies and
failure modes.
But these have to satisfy minimum overall performance standards. Yet organizations need a mechanism to track supplier
progress towards meeting organizational goals, and gives feedback to the supplier base on their individual performance.
Good supplier performance is a key ingredient in enabling firms to achieve business performance excellence. But how can
firms manage or even influence the performance of outside suppliers? Supplier effectiveness (SE) is being widely adopted
as a method to understand and improve the performance of the extended enterprise (Gordon, 2010). It is built through
effective communication, and clearly defined objectives. It includes critical processes to define measure and analyze
supplier performance to meet business goals.
The individual supplier effectiveness is also essential to support MNCs on the holistic supply chain management.
Although the significance of the buyer-supplier relationship has long been focused on literature of business and
management, little has been studied for its mediating role in supplier engagement, supplier infrastructure, supplier
Organisational and supplier commitment each on supplier performance in an organisation (van Veele, 2005). This study
tries to address this gap in the literature by examining the impacts of buyer-supplier relationship in its mediating role to
supplier performance instead of firm performance in manufacturing industries. A conceptual research model has been
developed to investigate the relationship of these variables and hypotheses are tested for predictive inference. The
findings reveal that supplier Organisational and supplier commitment could influence supplier performance with a help
from the mediating role of buyer-supplier relationship (van Weele, 2010).
Supplier effectiveness (SE) is a key enabler for transforming into a mature purchasing organization. Measuring supplier
performance is critical to ensure service level agreements, minimize risk, develop suppliers and reduce cost. The main
objective of SE is to improve performance of both the supplier and the buying organization. By establishing supplier
performance metrics a company can ensure that suppliers deliver according to contract agreements and market
ISSN 2349-7807
International Journal of Recent Research in Commerce Economics and Management (IJRRCEM)
Vol. 3, Issue 3, pp: (70-84), Month: July - September 2016, Available at: www.paperpublications.org
Page | 72
Paper Publications
norms. However, it is important not to think of SE only as establishing supplier scorecards but also as establishing
effective business processes. There are five main areas that need to be considered when establishing effective SE. These
include supplier-buyer relationship, leanness agility, willingness and capabilities (Parkash, & Kaushik, 2011).
2. RESEARCH OBJECTIVES
This study explored the following specific objectives:
i. To establish the effects of Supplier agility on organizational performance
ii. To investigate the process visibility on organizational performance
iii. To find out the effect of supplier willingness on organizational performance
iv. To determine effect of supplier capabilities on organizational performance
3. LITERATURE REVIEW
3.1 Theoretical Framework
Transaction Cost Theory
Ronald Coase, Chester Barnard, and Herbert Simon are among the early authors who describe the contributions of
transaction cost theory to the existence of firms (Scott, 2003; Williamson, 2005). These aspects of transaction cost
theory are supporting evidences for the role of supply chain management in organizations. Whether supply chain is
viewed as a network or as an integrated process, the transaction cost theory explains the vertical connection and
integration of various elements of organizational supply chain, from second tier and first tier suppliers to first tier and
second tier customers.
Efforts to build and maintain the relationship with suppliers; cost of monitoring the performance of suppliers; resolving
the problems that arise in the business relationships and engagement of suppliers in an opportunistic behaviour are
common. However, transaction cost theory is primarily concerned with the direct economic factors in organizations and
hence fails to address some important aspects of the operation of organizational supply chain, including personal and
human relations among actors in the supply chain. Transaction cost theory is a valuable framework for describing the
vertical integration in supply chain management studies. However, this theory mostly carries a neoclassical view of
organizations as black boxes of operation.
Agency Theory
The agency theory was promoted with the seminal works of Max Weber (Beckert, and Zafirovski, 2006). The classic view
of agency theory as develop by the works of Max Weber and others was mostly concerned with the conflict of interest
between the political master and state officials. This view was built on the foundation of the neoclassical view of
organization that views organizations as black boxes of operations, where the relationship between performance and
incentives was overlooked (Beckert, and Zafirovski, 2006). New institutionalism view of organizations opened the black
box of organizational operations and paved the way for the contemporary view of agency theory. In the old
institutionalism view, opportunistic behaviour based on the rational system view was dominant. However, the new
institutionalism view of the organizations, promotes the delegation of responsibilities and operation, through an open
system view towards the environment.
3.2 Conceptual Framework
The independent variables for Supplier effectiveness (SE) include: supplier agility, supplier willingness, supplier
capabilities and process visibility. These variables were investigated to determine their influence on organisational
performance in public institutions in Kenya.
ISSN 2349-7807
International Journal of Recent Research in Commerce Economics and Management (IJRRCEM)
Vol. 3, Issue 3, pp: (70-84), Month: July - September 2016, Available at: www.paperpublications.org
Page | 73
Paper Publications
Independent Variable (IV) Dependent Variable (DV)
Figure 3.1 : Conceptual Framework
Supplier agility provides the basis of preparedness towards being alert, accessible, decisive, swift, and flexible (Gligor,
2015). These dimensions are form of resources and capabilities that companies must develop to achieve the desired level
of agility. The companies can further improve their supplier agility by using a self-evaluation questionnaire based on
these five dimensions to determine where they fall on the agility spectrum, whether corrective actions are needed, and
where to make those corrections.
The current business environment is characterized by irregular customer demands, constant change, shorter product
lifecycles, and increased demand uncertainty (Sheppard, Young, Doyle, Sheppard & Newton, 2006). As these conditions
have become the norm, companies must have the ability to quickly detect changes, opportunities, and threats; the ability
to quickly access relevant data; the ability to make decisions resolutely using the available information; the ability to
implement decisions quickly and the ability to modify its range of tactics and operations to the extent needed to
implement its strategy. This domain has emerged as the dominant competitive vehicle for organizations operating in such
an uncertain and ever-changing business environment. An organisation that lacks ability to quickly detect changes,
opportunities, and threats (alertness); quickly access relevant data (accessibility); make resolute decisions about how to
act (decisiveness); quickly implement those decisions (swiftness); and modify its range of supply chain tactics and
operations to the extent needed to implement its strategy (flexibility) cannot be able to achieve its competitive advantage
in the modern business environment (Gligor, 2015). These five dimensions are useful in determining what supplier agility
is and the level of organisational agility with suppliers.
4. RESEARCH METHODOLOGY
Research Design
This study adopted an exploratory study design. The exploratory design is appropriate for assessing whether the case
organizations have experienced supplier effectiveness. This was necessary as it enabled the formulation of a precise
problem for investigation and developing the study hypothesis. It enabled the study to present information regarding the
immediate conditions, presentations of crucial issues, study of the unknown fields, theoretical base, and presentation of
uncertain problem for study in research. This was crucial since this issue of supplier effectiveness and the three
dimensions of performance pursued in this study were not clearly defined currently. Hence this design allowed the
researcher to be acquainted with the problem and concept researched, and enabling the production of hypotheses tested.
This way, it enabled questionnaires to be discussed in the focus groups including small group discussions. This enabled
the generation of better understanding of the issues needed to be filled in the questionnaire. It enabled the collection of the
new information about supplier effectiveness and organizational performance. Finally, this design helped to fulfill the
researcher’s curiosity and need for greater understanding, to test the feasibility of starting a more in depth study, and also
to develop the methods to be used in any following research projects. The design provided a representative sample from a
target population of all other Kenya seed branches in the country.
Other Influencing Factors
 Political
 Economical
Supplier Effectiveness
 Supplier Agility
 Process Visibility
 Supplier Willingness
 Supplier Capabilities
Organizational Performance
 Operational
 Relational
 Transformational
ISSN 2349-7807
International Journal of Recent Research in Commerce Economics and Management (IJRRCEM)
Vol. 3, Issue 3, pp: (70-84), Month: July - September 2016, Available at: www.paperpublications.org
Page | 74
Paper Publications
Population of the Study
According to Ngechu, (2004) a population is a well-defined set of people, services, elements, things or households under
investigation. Kothari, (2004) defines population as all items in a field of enquiry. The target population of this study was
360 employees of Kenya Seed Company in Kitale. The respondents were drawn from all the departments within the
company since the effectiveness of the suppliers can be experienced within the entire organisations (See Table 3.1).
Sample Size and Sampling Procedure
According to Kothari, (2004), the sample size should be optimum in order to fulfill the requirements of Technical,
representation, reliability and flexibility. While deciding sample size, the researcher determines the desired precision as
also an acceptable confidence level of the estimate (Kothari, 2004). Mugenda and Mugenda, (2004) recommends 10% of
accessible population is adequate. At least 10% sample of the population is considered a generally acceptable method of
selecting samples in such a study (Stanley & Gregory, 2001). Kerlinger (2009) states that a 10% sample allows for
reliable data analysis and provides desired levels of accuracy for testing significance of differences between estimates.
Empirical study by Roscoe (1975), suggests that sample size should be larger than 30 and less than 500.
The sample size of this study was 190 respondents, which were picked through simple random sampling. Using
confidence level of 95%; level off error of 5% and the target population of 360, the simple random calculator generated a
population of 186. This was confirmed by the calculation of the formula given below that generated 189 and some
decimal numbers this was rounded up to whole number generating 190. The participants were asked to voluntarily
participate in the study by answering a questionnaire and the interview questions. This sample size produced adequate
data for analysis and in making conclusive generation. Simple random sampling method was used to select respondents
from various strata. Gay (2002) identifies random sampling as the best form of sampling as it allows all members of
population to have an equal and unbiased chance of appearing in the sample.
This subsection covers the sample size and sampling technique. A sampling frame according to Cooper and Schindler is a
list of elements from which the sample is actually drawn and is closely related to the population. A sample size was
determined based on these registrants. A formula propounded by Cochran (1963) will be used to determine the size as
follows;
Where; n – is the sample size
N – is the population size
℮ – is the level of precision (95%; e = 0.05)
Given that N=360 (see Table 3.1); ℮2
=0.052
Therefore n= 360÷ (1+ (360*0.052
)= 189.47368 approximately 190, hence
from the above a sample of 190 respondents that were selected for the study. The Institute of Economic Affairs (2009)
defines a sample size as a function of logistics and homogeneity or heterogeneity of the population.
According to Sekaran (2006) adequacy, means the sample should be big enough to enable reasonable estimates of
variables to be obtained, capture variability of responses and facilitate comparative analysis. Kothari (2004) recommends
any large sample to be at least 10% of the target population. The sample of 190, which is 52.8% of target population, was
therefore adequate to address the objectives of the study. The sub-sample in each stratum was calculated by multiplying
the stratum population with the sample proportion as shown in Table 3.1.
Table 1: Sample Size and Sampling Procedure
Category of Population Determination Sample Size
1. Top Level management 20 (20/360)*190 11
2. Middle Level 80 (80/360)*190 42
3. Operational Level 260 (260/360)*190 137
Total 360 190
ISSN 2349-7807
International Journal of Recent Research in Commerce Economics and Management (IJRRCEM)
Vol. 3, Issue 3, pp: (70-84), Month: July - September 2016, Available at: www.paperpublications.org
Page | 75
Paper Publications
Data Collection Procedure
Data was collected through an administration of questionnaire distributed to the sample group of 200 participants and to
an extend interview was applied where there was need for further clarification. The respondents were asked to answer
questions without regard to gender, age, or qualifications. The questionnaire is preferred due to its ability to collect data
from a large group within a short time.
Data Collection Instruments
The instruments that were used are the questionnaires and interview schedule. The questions covered areas of objectives
of the project and the conceptual framework. Both primary and secondary data were used to obtain information for the
success of this research. Primary data were obtained through self- administration of questionnaires and observations.
These two methods were identified because of their advantages and ability to compliment the other. The respondents were
required to fill the designed questionnaire so as to assist the researcher with the data that were needed in the study. The
questionnaire was the main tool used in the research. The questionnaire consisted of questions and statements. Secondary
data were obtained from research journals and the company reports and documents.
Pilot Study
A pilot study was conducted in a similar environment with 30 respondents drawn from Panar Seed Company. The process
was repeated again using the same respondents after an interval of one week for reliability. Mugenda and Mugenda
(2006), defines reliability as a measure of the degree to which a research instrument yields consistent results or data after
repeated trials. A re-test method assessing reliability of data involves administering the same instrument twice to the same
subjects.
Content validity of the instruments was determined through piloting, where the responses of the subjects were checked,
against the research objectives. Mugenda and Mugenda (2006), defines validity as the accuracy and meaningfulness of
inferences, which are based on the research results. For a research instrument to be considered valid, the content selected
and included in the questionnaires must be relevant to the variable being investigated, (Neuman 2000).
Validity of the Questionnaire
Determining validity of the instrument was one indispensable characteristics of measurement that must be considered in
establishing the appropriateness and usefulness of instruments of measurements. Although this instrument was valid, face
and content validity of the instruments were established again by a panel of expert. Researchers generally determine
validity by asking a series of questions, and often look for the answers in the research of others (Orodho, 2008). A pilot
study was carried out to determine the validity of the questionnaire; a pilot study was conducted in a similar environment
prior to the actual research. The participants in the pilot study were not included in the actual research.
Therefore validity of the instrument was realized after the researchers had examined the content of the instruments,
through judgment of experts and the supervisors’ validations, which guided the researchers. The study applied different
techniques to assess the Cronbach’s (1951) reliability coefficient alpha and to assess face and construct validity. In order
to ascertain face validity, an initial questionnaire was passed through the routine editing after it was given to the panel of
experts. They were asked to respond to the questionnaire. Very few comments were received and some minor changes
were done to enhance the clarity.
Reliability of the Questionnaire
A reliability of the measuring instrument addresses the question of whether the results of the measuring processes are
consistent on occasions when they should be consistent (Trochim, 2006). It is a statistical concept that is related to
consistency and dependability, that is, consistency in obtaining the same relative answer when measuring phenomena that
have not changed (Burns and Bush, 2010). Questionnaires have a very limited purpose as they are often one-time data
gathering methods with a very short life, administered to a limited population (Norval, 2006). The following are important
parts of reliability: test-retest reliability (coefficient correlation of stability). Consistency is estimated by comparing two
or more repeated questions of the measuring instruments. This gives an indication of the dependability of the result on one
occasion which may then be compared with the results obtained on another occasion and internal consistency reliability.
This indicates how well the test items measure the same thing (Blumberg, et al., 2005). In this study reliability of the
ISSN 2349-7807
International Journal of Recent Research in Commerce Economics and Management (IJRRCEM)
Vol. 3, Issue 3, pp: (70-84), Month: July - September 2016, Available at: www.paperpublications.org
Page | 76
Paper Publications
questionnaire was determined using a sample of respondents. The items were measured by a 5-point Likert-scale, which
ranged from strongly disagree (1) to strongly agree (5). Reliability analysis was subsequently done using Cronbach’s
Alpha which measures the internal consistency to establish if certain items within a scale measure the same construct.
Cronbach Alpha was established for every variable.
Table 2: Reliability & Validity Analysis
Constructs
No. of
Items
No. of items (.60 &
above) retained
Alpha
Value Mean
Std
Dev.
Variance
Explained
Organization Performance 15 12 0.7839 4.03 0.48 0.57
Supplier Agility 10 7 0.8102 3.87 0.441 0.52
Process Visibility 15 8 0.9195 3.79 0.609 0.63
Supplier Willingness 10 6 0.8761 4 0.452 0.58
Supplier Capabilities 10 6 0.7969 3.45 0.779 0.74
Total 60 39 3.82 0.6
(Number of items retained that has corrected-item total >.40
The results in Table 3.3 indicate that Supplier Willingness had the highest reliability (α= 0.9195), followed by Supplier
Agility (α=0.8102), Process Visibility (α=0.7969) and Organizational Performance (α=0.7839). This is an illustration that
all the four variables were reliable as their reliability values exceeded the prescribed threshold of 0.7. This concurs with
Gliem & Gliem (2003) who established the Alpha value threshold at 0.7.
Data Analysis and Presentation
This study adopted both qualitative and quantitative analysis in order to achieve the objectives of the study. Descriptive
methods were employed. The data was organized in tabular form and represented in frequency distribution tables and
percentage distribution of the respondents. Quantitative techniques (frequency tables and charts) were used for the
presentation of quantifiable data that were presented textually using descriptive and inferential statistics.
The questionnaires were collected and counted to ensure that all respondents had answered and completed the questions.
The returned questionnaires were coded and captured on the computer. De Vos, et al. (2007) describes data analyses as
the process of bringing order, structure and meaning to the mass of collected data. Questionnaires received from
respondents, content analysis and interview schedules were checked for completeness with repeat calls being made for
incomplete questionnaires to maintain the number of respondents. Categorization and coding was then done and data
entered into SPSS for windows version 20 for analysis. Both descriptive and inferential tests were used in the analysis.
Data was described or summarized using descriptive statistics such as mean and frequencies, which helped in
meaningfully describing the distribution of responses. Various inferential statistics was used to infer population
characteristics from the sample. Pearson’s correlation coefficient was used to establish relationships between variables.
A multiple linear regression model was used to predict organization performance using the four independent variables in
the study: Supplier Agility, Process Visibility, Supplier Willingness and Supplier Capabilities. In addition, the β
coefficients for each independent variable generated from the model was subjected to a z–test, in order to test each of the
hypotheses under study. The regression model used to test is shown below:
Y = α + β1X1 + β2X2 +β3X3 + β4X4 +Ɛ
Where; Y – Organizational Performance (OP)
α - Constant
β1, β2, β3 and β4 - Coefficient indicating rate of change of organizational performance as Supplier Effectiveness measured
by its four dimensions of Supplier Agility, Process Visibility, Supplier Willingness and Supplier Capabilities changes.
X1 – Supplier Agility (SA)
X2 – Process Visibility (PV)
X3 – Supplier Willingness (SW)
ISSN 2349-7807
International Journal of Recent Research in Commerce Economics and Management (IJRRCEM)
Vol. 3, Issue 3, pp: (70-84), Month: July - September 2016, Available at: www.paperpublications.org
Page | 77
Paper Publications
X4 – Supplier Capabilities (SC)
Ɛ - Error term
All the above statistical tests were analyzed using the Statistical Package for Social Sciences (SPSS), version 20. All tests
were two-tailed. Significant levels were measured at 95% confidence level with significant differences recorded at p <
0.05.
5. DATA ANALYSIS AND PRESENTATION
Response Rate
The response rate of the respondents is critical to this study because it reflects the in-depth of the data gathered.
Questionnaire forms were used to collect data required for the study and a total of 190 questionnaire forms were
distributed to the sampled participants. Out of the 190 questionnaires distributed, 150 (78.95%) were appropriately filled
and returned, this were marked complete. The rest 40 (21.05%) were either not returned or were partially filled, and were
marked incomplete and so were discarded during analysis. A response rate of 50% and above is acceptable (Mugenda,
2003). Therefore a return of 150 (78.95%) of the questionnaires was considered a success and acceptable for this research.
The results are as shown in figure 5.1.
Figure 1: Response Rate of Respondents
As shown in figure 1 respond by the top level employees and mid level employees was lowest, this was attributed to the
fact that mid level employees are the people who mainly undertake the affairs of the firms on a daily basis including
administrative duties outside their firms barring them from getting ample time to participate in this survey. Although the
participants were asked in advance to create time to participate in the survey and even scheduled specific days for this
exercise, in this case it might have been that most of departmental heads (mid level employees) did not abide by this
requirement or were not able to return their dully filled questionnaires to the researcher. The lower level employees had
the highest response rate (80.0%). The higher response by lower level employees could be attributed to the fact that the
researcher had a personal contact with them during administering the questionnaires. At the same time, this could be to
the fact that they were able to create some time off their schedules to participate in this study. This is an indication of their
involvement of matters relating to their firms.
Multiple Liner Regression Analysis
The result of regression analysis for both linear and multiple regression analysis provides the functions of the equation
that represents the best prediction of a dependent variable from several independent variables. This method is used when
the independent variables are correlated with one another and with the dependent variable. The following regression
equation is estimated as follow:
CE = α0 + β1SA + β2PV + β3SW +β4SC + ε………………………………………………2
Where: OP: Organisational Performance
α0: Constant SA: Supplier Agility
0 20 40 60 80 100 120
Top level
Mid Level Employees
Lower level Employees
10
36
104
1
6
33
Not Returned
Returned
ISSN 2349-7807
International Journal of Recent Research in Commerce Economics and Management (IJRRCEM)
Vol. 3, Issue 3, pp: (70-84), Month: July - September 2016, Available at: www.paperpublications.org
Page | 78
Paper Publications
PV: Process Visibility
SW: Supplier Willingness
CE: Supplier Capabilities
ε: Error term.
Table 5: Summery of the Regression Model
Model Summary
Model R
R
Square
Adjusted
R
Square
Std.
Error of
the
Estimate
Change Statistics
R
Square
Change
F
Change df1 df2
Sig. F
Change
1 .877a
.769 .045 13.32000 2.393 4.000 95 0 .000
a. Predictors: (Constant), SA, PV, SW, SC
b. Dependent Variable: OP
Table 5. Shows multiple regressions which is related to OP as dependent variable. The Table shows the influence of
independent variable SA, PV, SW and SC on dependent variable OP. The Table indicates that the independent variables
determine 76.9% of the OP variance. This means that the other factors influence OP by 23.1%.
Multiple Regression Analysis
A Multifactor linear regression model was used to predict organizational performance in the study. The prediction was
carried out basing on the effect of the four independent factors: Supplier Agility, Process Visibility, Supplier Willingness
and Supplier Capabilities. In addition, the b coefficients for each independent variable generated from the model was
subjected to a t-test. The multiple regression analysis was evaluated to determine any effects of the independent variables
on the dependent variable. This was important since it was necessitating the test of hypotheses on individual Supplier
Effectiveness dimensions that included Supplier Agility (SA), Process Visibility (PV), Supplier Willingness (SW) and
Supplier Capabilities (SC). The results are as shown in Table 6.
Table 6: The Coefficients of Multiple Regression Analysis
Coefficients
Model
Unstandardized Coefficients
Standardized
Coefficients
t Sig.B Std. Error Beta
1 (Constant) 12.102 8.907 1.359 .177
SA 1.493 2.056 -.074 -.726 .469
PV 1.194 4.501 .026 .265 .791
SW .678 .758 .093 0.894 .374
S -14.768 5.950 -.249 -2.482 .015
a
. Dependant Variable OP
CE = α0 + β1SA + β2PV + β3SW +β4SC + ε
12.103+1.493SA+1.194PV+0.678SW-14.768SC+ε
Table 6 shows the relationship between independent variables namely SA, PV, SW, SC on dependent variable OP.
Statically, there is significant relationship between four dimensions of the ET mechanisms used in this study; LA, PV, SW
and SC, on the Organisational Performance (OP). It is clear that the increasing in the percentage of Supplier Effectiveness
ISSN 2349-7807
International Journal of Recent Research in Commerce Economics and Management (IJRRCEM)
Vol. 3, Issue 3, pp: (70-84), Month: July - September 2016, Available at: www.paperpublications.org
Page | 79
Paper Publications
dimensions, OP will increase although some components have decreasing effects. If the Process Visibility increases by 1,
the OP will decrease by about -14.8. If Supplier Effectiveness components SA, PV, SW and SC are equal to zero, OP will
be 12.103 units of level of performance.
6. SUMMARY, CONCLUSIONS AND RECOMMENDATIONS
Summary of the Findings
Taken at face value, the results of this project suggest that supplier effectiveness is critical to the organisational
performance. To evaluate what this means about the influence of supplier effectiveness dimensional competencies, it is
important to recognize that there are different goals associated with such competencies and that some organisations may
be interested in only one of them. If, for example, the aim is to give buyers upper chance of providing better services and
product qualities to their clients, then suppliers become effective in the supply chain but this does not imply that suppliers
who are not effective are merely retained in the supply chain of a buying organisation, this is why there are supplier
development, selection and segmentation activities; this project does not address this. If the rationale behind supplier
effectiveness goes a step further and intends for agility, visibility, willingness and capabilities to provide networks that is
reliable, relevant, and responsive to the desires of the buyers and the customers of the buyers for higher quality
performance, then there is evidence that supplier effectiveness is critical in the supply chain network.
This is because implementing retention of suppliers who are non-performing are not spared hence those who earn
effectiveness are only those who have shown improved performance to both the supply chain and the organisation.
Based on the findings, the study found out that majority of participants are male accounting with a proportion of over 67%
of the total respondents, which means that there are more male suppliers owned organisations than female owned
organisation suppliers and that male dominancy is a factor in supplier effectives in the supply chain. They command the
entire networks with little representation of female participation respondents during the time of answering the
questionnaire. The findings also affirmed that there were more married respondents, which may determine the decisions to
frequently hope from job to job. The results also attested that majority of respondents had bachelors degree affirming that
there were moderate levels of literacy among the respondents, a level of education that qualifies one to rank higher in
performance since it enables one to acquire more knowledge, and skills for competency in productivity.
This implies that the modal age bracket was 25-44. The findings also affirmed that respondents have been in their work
station or affirmed that majority of the participants have been with their current employer as from less than 10 years to 40
years confirming the organisational and supplier length of experience in this field that can be useful for development of
effectiveness. It was also found out that majority of participants were at the lower level of management.
The findings on the level of organisational performance showed that there was performance that meets the expectations.
Majority 70.0% (105) of the sampled respondents approved the performance of this level of performance. The historical
data also coincides with these findings where in the annual reports growth performance surpassed 100%. That means the
actual results were more than budgeted expected performance. This is an indication that the level of financial outcome is
significantly stable. The other variable of performance measure in this study was relational. This is also confirmed by the
findings as majority of respondents approved the relational level of performance as also meeting the expectations,
especially exceptional 46% (92) that accounted for close to a half of the sampled population and in total, 76.0% (152) of
respondents approved the relational performance of the firm as meeting the expectations. The performance based on
transformational show that majority of respondents approved the level rating as exceptionally higher. This is also related
to the level of education; desire to stay longer in the organization, training and development, various incentives that
employees are able to access in this organization.
In general findings of organisational performance, of all the items of performance measures, it showed that
Transformational scored the highest 79% (158), relational 76% (152), then operational at 72% (144) and finally relational
which accounted for 70% (140). This may be attributed to the fact that these attributes are important in performance as
they may be the drivers of Operational.
The findings of descriptive statistics showed that the mean scores of employee skills on performance is moderately stable
at highest score of mean 3.9060 and standard deviation of 1.38329 with the least mean score of 3.0016 and standard
ISSN 2349-7807
International Journal of Recent Research in Commerce Economics and Management (IJRRCEM)
Vol. 3, Issue 3, pp: (70-84), Month: July - September 2016, Available at: www.paperpublications.org
Page | 80
Paper Publications
deviation of 1.04037. This is an indication that generally the level of performance as influenced by supplier effectiveness
is stable and higher. At the same time, mean scores for each indicator ranged from 2.0015(SD = .00145) to 2.23457 (SD =
.10897). Relational had the highest mean scores, while organizational performance had the lowest mean and standard
deviation scores. Overall, the item mean for organizational performance was 2.0015 (SD = .00145), which was within the
lowest average level. This is an indication that the performance level is compliant with the individual items of measure
hence a rating of healthy performance.
The study found out that majority of participants approved the statement that the supplier effectiveness enables
accumulation of considerable knowledge base of the company’s culture and its products and services. In relations to
employee having experienced many changes within the workplace, and consequently understand what works and what
doesn’t, results show that strongly agree accounted for 52.7% (106), agree 35.3% (71), disagree accounted for 07.3% (15),
and strongly disagree 02.7%(06). This is an indication that majority of the participants agreed that supplier effectiveness
enable them experience many changes within the workplace, and consequently understand what works and what doesn’t.
At the same time, these results show that that strongly agree accounted for 51.3% (103), agree 34.0% (68), disagree
accounted for 09.3% (19), and strongly disagree 05.3% (11). This is an indication that majority of the participants also
agreed that tenure has enabled them develop quality standard and accuracy technique minimizing mistakes and resource
wastage.
Moreover, from the findings one realizes that strongly agree accounted for 50.7% (102), agree 32.7% (66), none 02.0%
(04), disagree accounted for 09.3% (19), and strongly disagree 05.3% (11). This implies that majority of participants
approved the statement that supplier effectiveness has made buyers possess a keen understanding of procedures and
techniques for increased financial management or revenue administration. Also participants with opinion of strongly agree
accounted for 50.7% (102), agree 32.7% (66), disagree accounted for 10.0% (20), and strongly disagree 06.7% (14). This
implies that majority of participants agreed with the statement that supplier effectiveness necessitates creation of routine
success in service delivery.
Again these results reveal that strongly agree accounted for 49.3% (74), agree 34.7% (70), disagree 10.0% (20), and
strongly disagree 06.0% (12). This implies that majority of participants agreed with the statement that the tenure
necessitates cooperative work relations in groups and teams. In relation to measure that Ability to complete objectives and
goals under pressure without supervision, the findings show that strongly agree accounted for 48.7% (98), agree 32.7%
(66),none 02.7% (06), disagree 10.0% (20), and strongly disagree 06.0% (12). This implies that majority of participants
accepted the statement that tenure enhances ability to complete objectives and goals under pressure without supervision.
The objective one stated the effect of supplier agility on organisational performance. The findings showed that reported
that supplier agility is an essential component of their effectiveness. Supplier agility has enabled them to acquire
considerable knowledge base of the company’s culture and its products and services, have experienced many changes
within the workplace, and consequently understand what works and what doesn’t, developed quality standard and
accuracy technique minimizing mistakes and resource wastage, possess a keen understanding of procedures and
techniques for increased benefits of the supply chain, creation of routine success in service delivery, necessitates
cooperative work relations in groups and teams and ability to complete objectives and goals under pressure without
supervision. All elements that are performance based for improved productivity and in generally Supplier agility was
(mean=2.68314). This means that higher level of supplier agility have an effect on the performance of this organsiation.
The objective two was to find out the effects of process visibility on organisational performance. The findings revealed
that there was a strong positive correlation meaning that process visibility has a significant effect on the performance level
of an organsiation. This means that higher process visibility will increase organizational performance.
The third objective of the project was to determine the effects of Supplier willingness on organisational performance. The
findings showed a strong negative relationship between the two implying that weaker work environment means poor or
lower level of performance.
The fourth objective was to examine the effect of supplier capabilities on organisational performance. The findings
indicated that there is a significant positive relationship between them. This implies that where there are resources the
ability to connect and convert these resources into products is possible, hence where there is poor level of performance
ISSN 2349-7807
International Journal of Recent Research in Commerce Economics and Management (IJRRCEM)
Vol. 3, Issue 3, pp: (70-84), Month: July - September 2016, Available at: www.paperpublications.org
Page | 81
Paper Publications
that requires improvements. The findings therefore showed that there are negative and positive effects of the four
components of supplier effectiveness on organisational performance.
Hypotheses Testing
There were also four hypotheses that were tested by this project . Hypothesis 1 tested therelationship between supplier
agility and organisational performance. The test findings showed that there was significantly positive relationship between
supplier agility and organisational performance, supplier agility was negatively correlated to organisational performance
(coefficient estimate (β1 = 0.681, p value =0.000). There is moderately high degree of supplier agility has been found to
influence the competitiveness of the organisation in terms of poor supplier productivity as they may intend to perform
simpler activities in order to avoid this situation.
Hypothesis 2 tested the statement that there is no relationship between process visibility and organisational
performance. The findings revealed that there is no agreement with this statement, (coefficient estimates (β2 = 0.311, p
value =0.000). This showed that a high level of employee skill support system contributes immensely to organisational
performance.
Hypothesis 3 stated that Supplier willingness has no significant effect on organisational performance. The findings
showed that there is no agreement with this statement since Supplier willingness has coefficient estimate (β3 = 0.238, p
value =0.018), hence hypothesis 3 does not hold. It means that higher level Supplier willingness improves performance
as employees are dedicated to their assigned duties without fear
Hypothesis 4 states that supplier capabilities have no significant effect on organisational performance. The statistical tests
findings showed that there is inconsistency with the hypothesis ; hence Supplier capabilities was correlated to
organisational performance, (coefficient estimates (β4 = -0.186, p value =0.000). This means that when organization
attains level of being cost effective, there is an increased level of performance.
7. CONCLUSIONS
These findings provided an environment that proves the supplier agility has an effect on organisational performance as it
contributes to the improvement or decrease in performance, and an indication of its magnitude effect. From the study
findings there is enough proof to conclude that supplier agility is related to performance level that meets the expectation,
exceptional and that exceeds expectations.
There is also a proof that process visibility has an important role in improving organisational performance. Specifically,
for supplier effectiveness with ability to disseminate these skills to the new recruits, performance likely to improve since
there will always be a match in employee competency level.
There were also findings that Supplier willingness has a significant effect on organisational performance. This implied
that stable work place support employee skill and knowledge development enhancing experience as there is no fear that
the next move is sacking of an employee. The last conclusion made was that supplier capabilities have a significant effect
on organisational performance. It is therefore prudent for the firms to ensure that there is supplier capabilities level in the
system so that resources wastages are not encountered.
Finally the general conclusion is that supplier effectiveness has significant effects on organisational performance. The
findings above provide evidence of proof that the components of supplier effectiveness are related to organisational
performance either positively or negatively.
8. RECOMMENDATIONS
From the findings and conclusions above, the project makes the following comments: that it is not an offense for an
employee whose desire is to find an organisation where he/she can work for longer period of time. At the same time, an
employer who reaps talent and competency from employees owing to their long tenure has no reason to merely retrench
or sack such employees only because they have overstayed. What is important is productivity and improvement in the
work place. No organisation engages on introducing incentives that are expected to improve employee competency yet
ISSN 2349-7807
International Journal of Recent Research in Commerce Economics and Management (IJRRCEM)
Vol. 3, Issue 3, pp: (70-84), Month: July - September 2016, Available at: www.paperpublications.org
Page | 82
Paper Publications
after obtaining such incentives such employee is intended to leave next minute. That will be a poor management strategy.
The findings have proved that there are indeed effects of supplier effectiveness on organisational performance.
The findings of this project deduced that supplier agility has a profound effect on organisational performance. This
suggested that organisations with employees whose longevity is higher contribute to performance. Therefore, the
organisations should strive to ensure that their effective suppliers keep improving on their efficiencies so as to be retained
and work on a relational value creation network in the supply chain. The study finds strong support for the argument that
process visibility has effects on performance, thus there should be an environment that encourages suppliers to obtain
relevant information, consistency, competency reliability and trackability to enhance improved performance. This way,
new and even ineffective suppliers will have a support base to improve and pursue competency.
The findings also indicated that Supplier willingness has a significant effect on performance. Thus the supplier
effectiveness must maintain the environment that is stable to keep current and new ones without fear of being the next on
axe line. The supplier willingness enables accumulation and acquisition of talents that are essential to performance
improvement. Finally, supplier capabilities was also found to have a significant effect on organisational performance,
therefore the organisations need to ensure that they work toward achieving this status to reduce unnecessary wastages of
resources.
Suggestions for Further Studies
This study was done only in a sub-region, it is important for future studies to be done on a larger study area, such as the
entire country. The other case was that this study did not look at the cause effects so it is important to carry out a
longitudinal study of at least five years to determine the cause effects of supplier effectiveness on organisational
performance. There is also the need to study the effects of short term and long term employment on performance.
REFERENCES
[1] Aberdeen Group, (2009). Executive dashboards the key to unlocking double digit profit growth: Aberdeen Group.
[2] Benson Kuira Irungu, B. K., & Wanjau, K. L., (2011). Effectiveness of vendor managed inventory systems in retail
supermarkets in Kenya. International Journal of Business and Public Management (ISSN: 2223-6244) Vol. 1(1): 85-
89
[3] Borgström, B. (2005, September). Exploring efficiency and effectiveness in the supply chain: A conceptual analysis.
In Proceedings from the 21st IMP Conference.
[4] Charron, K., 2006. Why KPIs belong in supply chain contracts. Supply Chain Management Review, 10(2), pp. 22-
28.
[5] Christopher, M., 2005. Logistics and supply chain management: creating value-added networks. 3rd ed. Harlow:
Pearson Education Limited.
[6] Early, J., (2015). The 3 Dimensions of Supplier Performance Management
[7] Fleischer, D., & Christie, C. (2009). Evaluation use: Results from a survey of U.S. American Evaluation Association
members. American Journal of Evaluation, 30(2), 158–175.
[8] Forker, L.B., & Hershauer, J. C. (2000). Some determinants of satisfaction and quality performance in the electronic
components industry. Production and Inventory Management Journal 41(2),14–20.
[9] Gadde, L.-E., Håkansson, H. & Persson, G., 2010. Supply Network Strategies. 1st ed. Wiltshire: John Wiley & Sons.
[10] Gligor, D. M., (2015). The Five Dimensions of Supply Chain Agility. CSCMP's Supply Chain Quarterly. Supply
Chain Media LLC Publication.
[11] Gonzalez, M. E., & Quesada, G. (2004). Determining the Importance of the Supplier Selection Process in
Manufacturing: A Case Study. International Journal of Physical Distribution & Logistics Management, 34(6),
492-504
[12] Goodpasture, J. C. (2004). Quantitative Methods in Project Management. J. Ross Publishing.
ISSN 2349-7807
International Journal of Recent Research in Commerce Economics and Management (IJRRCEM)
Vol. 3, Issue 3, pp: (70-84), Month: July - September 2016, Available at: www.paperpublications.org
Page | 83
Paper Publications
[13] Gordon, S., 2005. Seven Steps to Measure Supplier Performance. Quality Progress, 38(8), pp. 20-25.
[14] Gordon, S., 2008. Supplier Evaluation and Performance Excellence: A Guide to Meaningful Metrics and Successful
Results. Florida: J. Ross Publishing.
[15] Gunasekaran, A., Patel, C. & McGaughey, R. E., 2004. A framework for supply chain performance measurement.
International Journal of Production Economics, 87(3), pp. 333-347.
[16] Gustafsson J., & Karlsson E., (2012). Supplier performance dashboard at Volvo Logistics. Department of
Technology Management and Economics. Division of Logistics and Transportation Chalmers University of
Technology. Report No. E2012:025
[17] Handfield, R., Walton, S. V., Sroufe, R. & Melnyk, S. A., 2002. Applying environmentalcriteria to supplier
assessment: A study in the application of the Analytical Hierarchy Process. Journal of Operations Management,
Issue 141, pp. 70-87.
[18] Harrrison, A. & Hoek, R. V., (2011). Logistics Management and Strategy, 4th edn, Pearson
[19] Holter, A. R., Grant, D. B., Ritchie, J. & Shaw, N., 2008. A framework for purchasing logistics services in
small and medium size enterprises. International Journal of Physical Distribution & Logistics Management, 38(1),
pp. 21-38.
[20] Kothari, C. R. (2004). Research Methodology: Methods and Techniques (2nd Ed.). New Delhi:New Age
International limited.
[21] Krause, D. R., Scannell, T. V. & Calantone, R. J., (2007). A Structural Analysis of the Effectiveness of Buying
Firms' Strategies to Improve Supplier Performance. Decision Sciences 31(1):33 - 55
[22] Krause, D.R., Handfield, R.B. & Tyler, B.B. (2007).The relationships between supplier development, commitment,
social capital accumulation and performance improvement, Journal of Operations Management, 25(2), 528-545.
[23] Krause, D.R., Handfield, R.B., & Tyler, B.B. (2007). The relationships between supplier development, commitment,
social capital accumulation and performance improvement. Journal of Operations Management, 25, 528-545
[24] Krause, D.R., Scannell, T. V., & Calantone, R. J. (2000). A Structural Analysis of the Effectiveness of Buying
Firms' Strategies to Improve Supplier Performance. Decision Sciences, 31(1), 33-55
[25] Krause, D.R., Scannell, T.V. & Calantone, R.J. (2000). A structural analysis of the effectiveness of buying firms’
strategies to improve supplier performance. Decision Sciences, 31, 33‐55.
[26] Krause, D.R. & Scannell, T. (2002). Supplier development practices: product and servicebased industrycompa-
risons. Journal of Supply Chain Management, 38(2), 13-21.
[27] Krauth, E., Moonen, H., Popova, V. & Schut, M., (2005). Performance measurement and control in logistics service
providing. In: C. S. Chen, J. Filipe, I. Seruca & J. Cordeiro, eds. Proceedings of Seventh international conference
on enterprise information systems. s.l.:ICEIS, pp. 239-247.
[28] Kumar, S., & Bragg, R. (2003).Managing Supplier Relationships. Quality Progress,36(9), 24-30.
[29] Mugenda, O. M & Mugenda, A.G. (2003). Research method: Qualitative and Quantitative approaches. Nairobi
African centre for technology studies
[30] Niraj, R., Gupta, M., & Narasimham, C. (2001).Customer profitability in a supply chain. Journal of marketing
65(3),1–16.
[31] Orodho A. J. (2004). Techniques of writing Research proposals and report in Education and Social Science. Nairobi:
Masola publishers, Reata Prince.
[32] Parkash, S. & Kaushik, V. K., (2011). Simple, Cost Effective & Result Oriented Framework for Supplier
Performance Measurement in Sports Goods Manufacturing Industry. Scientific Journal of Logistics. ISSN 1734-
459X. Vol. 7 Issue 3 No 2
ISSN 2349-7807
International Journal of Recent Research in Commerce Economics and Management (IJRRCEM)
Vol. 3, Issue 3, pp: (70-84), Month: July - September 2016, Available at: www.paperpublications.org
Page | 84
Paper Publications
[33] Petersen, K.J., Handfield, R. & Ragatz, G. (2005). Supplier Integration into New Product Development:
Coordinating Product, Process and Supply Chain Design. Journal of Operations Management, 23(3-4), 371-388.
[34] Sanderson, J., Lonsdale, C., Mannion, R., and Matharu, T., (2015). Towards a framework for enhancing
procurement and supply chain management practice in the NHS: lessons for managers and clinicians from a
synproject of the theoretical and empirical literature. National Institute for Health Services and Delivery Research.
Volume 3 Issue 18 April 2015; ISSN 2050-4349
[35] Sarkar, A. & Mohapatra, P. K., (2006). Evaluation of supplier capability and performance: A method for supply base
reduction. Journal of Purchasing & Supply Management, Volume 12, pp. 148-163.
[36] Schmitz, J. & Platts, K. W., (2004). Supplier logistics performance measurement: Indications from a study in the
automotive industry. International Journal of Production Economics, 89(2), pp. 231-243.
[37] Sheppard, J.M., Young, W.B., Doyle, T.L., Sheppard, T.A., and Newton, R.U., (2006). An evaluation of a new test
of reactive agility and its relationship to sprint speed and change of direction speed, Journal of Science and Medicine
in Sport 9, no. 4: 342-9.
[38] Simpson, P. M., Siguaw, J. A. & White, S. C., (2002) Measuring the Performance of Suppliers: An Analysis of
Evaluation Processes. The Journal of Supply Chain Management, 38(1), pp. 29-41.
[39] Skjøtt-Larsen, T., Schary, P. B., Mikkola, J. H. & Kotzab, H., 2007. Managing the global supply chain. 3rd ed.
Gylling: Copenhagen Business School Press.
[40] Talluri, S. & Sarkis, J., 2002. A model for performance monitoring of supplier.International Journal of Production
Research, 40(16), pp. 4257-4269.
[41] Van der Valk, W. & Rozemeijer, F., (2009) Buying business services: towards a structured service purchasing
process. Journal of Services Marketing, 23(1), pp. 3-10.
[42] Van Laarhoven, P., Berglund, M. & Peters, M., (2000) Third-party logistics in Europe. International Journal of
Physical Distribution & Logistics Management, 30(5), pp. 425-442.
[43] Van Veele , A. J., (2005) Purchasing & Supply Chain Management: Analysis, Planning, Strategy and Practice. 4th
ed. Croatia: Thomson Learning.
[44] Van Weele, A. J., (2010) Purchasing and Supply Chain Management. 5th ed. Hampshire: Cengage Learning EMEA.
[45] Wagner, S. M. (2006). Supplier development practices: an exploratory study, European journal of marketing,40(5),
554-571.
[46] Yen, Yu-Xiang, Wang E. Shih-Tse & Horng Der-Juinn (2011). Suppliers’ Willingness of Customization, Effective
Communication, and Trust: A Study of Switching Cost Antecedents. Journal of Business & Industrial Marketing.
Emerald Group Publishing Limited 250–259 [ISSN 0885-8624]

More Related Content

What's hot

2012.scmr.monczka.petersen
2012.scmr.monczka.petersen2012.scmr.monczka.petersen
2012.scmr.monczka.petersenDr Lendy Spires
 
Determinants of Supply Chain Performance of Indian Manufacturing Organizations
Determinants of Supply Chain Performance of Indian Manufacturing OrganizationsDeterminants of Supply Chain Performance of Indian Manufacturing Organizations
Determinants of Supply Chain Performance of Indian Manufacturing OrganizationsWaqas Tariq
 
Bba473 week 1 new edition
Bba473 week 1 new editionBba473 week 1 new edition
Bba473 week 1 new editionnajmun_nipa
 
Effects of Supplier Relationship Management on the Performance of Organizatio...
Effects of Supplier Relationship Management on the Performance of Organizatio...Effects of Supplier Relationship Management on the Performance of Organizatio...
Effects of Supplier Relationship Management on the Performance of Organizatio...iosrjce
 
Benchmarking | Arrelic Insights
Benchmarking | Arrelic InsightsBenchmarking | Arrelic Insights
Benchmarking | Arrelic InsightsArrelic
 
Bip assessment-of-excellence-in-procurement-2014
Bip assessment-of-excellence-in-procurement-2014Bip assessment-of-excellence-in-procurement-2014
Bip assessment-of-excellence-in-procurement-2014Semalytix
 
JOSCM - Journal of Operations and Supply Chain Management - n. 02 | Jul/Dec 2015
JOSCM - Journal of Operations and Supply Chain Management - n. 02 | Jul/Dec 2015JOSCM - Journal of Operations and Supply Chain Management - n. 02 | Jul/Dec 2015
JOSCM - Journal of Operations and Supply Chain Management - n. 02 | Jul/Dec 2015FGV | Fundação Getulio Vargas
 
which supply chain strategies can guarantee higher manufacturer’s operational...
which supply chain strategies can guarantee higher manufacturer’s operational...which supply chain strategies can guarantee higher manufacturer’s operational...
which supply chain strategies can guarantee higher manufacturer’s operational...INFOGAIN PUBLICATION
 
Organizational Excellence Framework-Suppliers & Partners
Organizational Excellence Framework-Suppliers & PartnersOrganizational Excellence Framework-Suppliers & Partners
Organizational Excellence Framework-Suppliers & PartnersFlevy.com Best Practices
 
Vendor performance Management CPPC conference
Vendor performance Management CPPC conferenceVendor performance Management CPPC conference
Vendor performance Management CPPC conferenceGerald Ford
 
Zeithaml96 behavconsequ
Zeithaml96 behavconsequZeithaml96 behavconsequ
Zeithaml96 behavconsequRCD969
 
Managing-Supplier-Performance-Key-Competitive-Advantage
Managing-Supplier-Performance-Key-Competitive-AdvantageManaging-Supplier-Performance-Key-Competitive-Advantage
Managing-Supplier-Performance-Key-Competitive-Advantageddodd
 

What's hot (20)

Vendor rating system
Vendor rating systemVendor rating system
Vendor rating system
 
2012.scmr.monczka.petersen
2012.scmr.monczka.petersen2012.scmr.monczka.petersen
2012.scmr.monczka.petersen
 
Determinants of Supply Chain Performance of Indian Manufacturing Organizations
Determinants of Supply Chain Performance of Indian Manufacturing OrganizationsDeterminants of Supply Chain Performance of Indian Manufacturing Organizations
Determinants of Supply Chain Performance of Indian Manufacturing Organizations
 
Bba473 week 1 new edition
Bba473 week 1 new editionBba473 week 1 new edition
Bba473 week 1 new edition
 
Effects of Supplier Relationship Management on the Performance of Organizatio...
Effects of Supplier Relationship Management on the Performance of Organizatio...Effects of Supplier Relationship Management on the Performance of Organizatio...
Effects of Supplier Relationship Management on the Performance of Organizatio...
 
Benchmarking
BenchmarkingBenchmarking
Benchmarking
 
Benchmarking
Benchmarking Benchmarking
Benchmarking
 
Benchmarking | Arrelic Insights
Benchmarking | Arrelic InsightsBenchmarking | Arrelic Insights
Benchmarking | Arrelic Insights
 
Benchmarking
BenchmarkingBenchmarking
Benchmarking
 
Bip assessment-of-excellence-in-procurement-2014
Bip assessment-of-excellence-in-procurement-2014Bip assessment-of-excellence-in-procurement-2014
Bip assessment-of-excellence-in-procurement-2014
 
Benchmarking
BenchmarkingBenchmarking
Benchmarking
 
JOSCM - Journal of Operations and Supply Chain Management - n. 02 | Jul/Dec 2015
JOSCM - Journal of Operations and Supply Chain Management - n. 02 | Jul/Dec 2015JOSCM - Journal of Operations and Supply Chain Management - n. 02 | Jul/Dec 2015
JOSCM - Journal of Operations and Supply Chain Management - n. 02 | Jul/Dec 2015
 
which supply chain strategies can guarantee higher manufacturer’s operational...
which supply chain strategies can guarantee higher manufacturer’s operational...which supply chain strategies can guarantee higher manufacturer’s operational...
which supply chain strategies can guarantee higher manufacturer’s operational...
 
Supplier evaluation
Supplier evaluationSupplier evaluation
Supplier evaluation
 
Benchmarking
BenchmarkingBenchmarking
Benchmarking
 
Organizational Excellence Framework-Suppliers & Partners
Organizational Excellence Framework-Suppliers & PartnersOrganizational Excellence Framework-Suppliers & Partners
Organizational Excellence Framework-Suppliers & Partners
 
Vendor performance Management CPPC conference
Vendor performance Management CPPC conferenceVendor performance Management CPPC conference
Vendor performance Management CPPC conference
 
Zeithaml96 behavconsequ
Zeithaml96 behavconsequZeithaml96 behavconsequ
Zeithaml96 behavconsequ
 
Developing a Supplier Scorecard - Term Paper
Developing a Supplier Scorecard - Term PaperDeveloping a Supplier Scorecard - Term Paper
Developing a Supplier Scorecard - Term Paper
 
Managing-Supplier-Performance-Key-Competitive-Advantage
Managing-Supplier-Performance-Key-Competitive-AdvantageManaging-Supplier-Performance-Key-Competitive-Advantage
Managing-Supplier-Performance-Key-Competitive-Advantage
 

Viewers also liked

CLIMATE CHANGE AND its IMPACT ON INDIA
CLIMATE CHANGE AND its IMPACT ON INDIACLIMATE CHANGE AND its IMPACT ON INDIA
CLIMATE CHANGE AND its IMPACT ON INDIApaperpublications3
 
Economic Environment and Performance of Food and Beverage Sub-Sector of a Dev...
Economic Environment and Performance of Food and Beverage Sub-Sector of a Dev...Economic Environment and Performance of Food and Beverage Sub-Sector of a Dev...
Economic Environment and Performance of Food and Beverage Sub-Sector of a Dev...paperpublications3
 
Evaluation of the Factors Affecting Community Policing Project in Teso South ...
Evaluation of the Factors Affecting Community Policing Project in Teso South ...Evaluation of the Factors Affecting Community Policing Project in Teso South ...
Evaluation of the Factors Affecting Community Policing Project in Teso South ...paperpublications3
 
EMPLOYEES VIEW ON PERFORMANCE APPRAISAL PROCESS AND ITS EFFECT ON WORK ATTITU...
EMPLOYEES VIEW ON PERFORMANCE APPRAISAL PROCESS AND ITS EFFECT ON WORK ATTITU...EMPLOYEES VIEW ON PERFORMANCE APPRAISAL PROCESS AND ITS EFFECT ON WORK ATTITU...
EMPLOYEES VIEW ON PERFORMANCE APPRAISAL PROCESS AND ITS EFFECT ON WORK ATTITU...paperpublications3
 
An Analysis of Efficiency Performance of Private life Insurance
An Analysis of Efficiency Performance of Private life InsuranceAn Analysis of Efficiency Performance of Private life Insurance
An Analysis of Efficiency Performance of Private life Insurancepaperpublications3
 
Motivational Factors and Motivating Level of College Teachers under Self-Fina...
Motivational Factors and Motivating Level of College Teachers under Self-Fina...Motivational Factors and Motivating Level of College Teachers under Self-Fina...
Motivational Factors and Motivating Level of College Teachers under Self-Fina...paperpublications3
 

Viewers also liked (6)

CLIMATE CHANGE AND its IMPACT ON INDIA
CLIMATE CHANGE AND its IMPACT ON INDIACLIMATE CHANGE AND its IMPACT ON INDIA
CLIMATE CHANGE AND its IMPACT ON INDIA
 
Economic Environment and Performance of Food and Beverage Sub-Sector of a Dev...
Economic Environment and Performance of Food and Beverage Sub-Sector of a Dev...Economic Environment and Performance of Food and Beverage Sub-Sector of a Dev...
Economic Environment and Performance of Food and Beverage Sub-Sector of a Dev...
 
Evaluation of the Factors Affecting Community Policing Project in Teso South ...
Evaluation of the Factors Affecting Community Policing Project in Teso South ...Evaluation of the Factors Affecting Community Policing Project in Teso South ...
Evaluation of the Factors Affecting Community Policing Project in Teso South ...
 
EMPLOYEES VIEW ON PERFORMANCE APPRAISAL PROCESS AND ITS EFFECT ON WORK ATTITU...
EMPLOYEES VIEW ON PERFORMANCE APPRAISAL PROCESS AND ITS EFFECT ON WORK ATTITU...EMPLOYEES VIEW ON PERFORMANCE APPRAISAL PROCESS AND ITS EFFECT ON WORK ATTITU...
EMPLOYEES VIEW ON PERFORMANCE APPRAISAL PROCESS AND ITS EFFECT ON WORK ATTITU...
 
An Analysis of Efficiency Performance of Private life Insurance
An Analysis of Efficiency Performance of Private life InsuranceAn Analysis of Efficiency Performance of Private life Insurance
An Analysis of Efficiency Performance of Private life Insurance
 
Motivational Factors and Motivating Level of College Teachers under Self-Fina...
Motivational Factors and Motivating Level of College Teachers under Self-Fina...Motivational Factors and Motivating Level of College Teachers under Self-Fina...
Motivational Factors and Motivating Level of College Teachers under Self-Fina...
 

Similar to EFFECTS OF SUPPLIER EFFECTIVENESS ON ORGANIZATION PERFORMANCE AT KENYA SEED COMPANY KITALE, KENYA

Influence of Strategic-2386.pdf
Influence of Strategic-2386.pdfInfluence of Strategic-2386.pdf
Influence of Strategic-2386.pdfTHEGAMER97
 
5262020 Innovation Process Design Scoring Guidehttpsc.docx
5262020 Innovation Process Design Scoring Guidehttpsc.docx5262020 Innovation Process Design Scoring Guidehttpsc.docx
5262020 Innovation Process Design Scoring Guidehttpsc.docxpriestmanmable
 
5262020 Innovation Process Design Scoring Guidehttpsc.docx
5262020 Innovation Process Design Scoring Guidehttpsc.docx5262020 Innovation Process Design Scoring Guidehttpsc.docx
5262020 Innovation Process Design Scoring Guidehttpsc.docxfredharris32
 
Effect of Supply Chain Management Practices on Organizational Performance of ...
Effect of Supply Chain Management Practices on Organizational Performance of ...Effect of Supply Chain Management Practices on Organizational Performance of ...
Effect of Supply Chain Management Practices on Organizational Performance of ...AJHSSR Journal
 
Conquering the Supply Chain Effective Frontier - 27 NOV 2017 - Report
Conquering the Supply Chain Effective Frontier - 27 NOV 2017 - ReportConquering the Supply Chain Effective Frontier - 27 NOV 2017 - Report
Conquering the Supply Chain Effective Frontier - 27 NOV 2017 - ReportLora Cecere
 
6 Strategic Alliance Success Factors.pdf
6 Strategic Alliance Success Factors.pdf6 Strategic Alliance Success Factors.pdf
6 Strategic Alliance Success Factors.pdfShivamYadav8517
 
6 Strategic Alliance Success Factors.pdf
6 Strategic Alliance Success Factors.pdf6 Strategic Alliance Success Factors.pdf
6 Strategic Alliance Success Factors.pdfShivamYadav8517
 
The Hazards of Sole Sourcing RelationshipsChallenges, Pract.docx
The Hazards of Sole Sourcing RelationshipsChallenges, Pract.docxThe Hazards of Sole Sourcing RelationshipsChallenges, Pract.docx
The Hazards of Sole Sourcing RelationshipsChallenges, Pract.docxarnoldmeredith47041
 
The Influence of Supply Chain Integration on the Intrapreneurship in Supply C...
The Influence of Supply Chain Integration on the Intrapreneurship in Supply C...The Influence of Supply Chain Integration on the Intrapreneurship in Supply C...
The Influence of Supply Chain Integration on the Intrapreneurship in Supply C...IJERA Editor
 
Sustained Performance
Sustained PerformanceSustained Performance
Sustained PerformancePeter Murray
 
Draft Due Week 5 and worth 50 pointsHave you ever needed just th.docx
Draft Due Week 5 and worth 50 pointsHave you ever needed just th.docxDraft Due Week 5 and worth 50 pointsHave you ever needed just th.docx
Draft Due Week 5 and worth 50 pointsHave you ever needed just th.docxkanepbyrne80830
 
Supply Chain Metrics That Matter: A Focus on the High-Tech Industry - 2016
Supply Chain Metrics That Matter: A Focus on the High-Tech Industry - 2016Supply Chain Metrics That Matter: A Focus on the High-Tech Industry - 2016
Supply Chain Metrics That Matter: A Focus on the High-Tech Industry - 2016Lora Cecere
 
Determinants of Strategic Supply Chain Management in Enhancing Organization P...
Determinants of Strategic Supply Chain Management in Enhancing Organization P...Determinants of Strategic Supply Chain Management in Enhancing Organization P...
Determinants of Strategic Supply Chain Management in Enhancing Organization P...paperpublications3
 
Whitepaper-Maximizing-the-Success-of-Your-CRO-Partnerships
Whitepaper-Maximizing-the-Success-of-Your-CRO-PartnershipsWhitepaper-Maximizing-the-Success-of-Your-CRO-Partnerships
Whitepaper-Maximizing-the-Success-of-Your-CRO-PartnershipsTim Calvert
 
Determinantsof Strategic Supply Chain Management in Enhancing Organization Pe...
Determinantsof Strategic Supply Chain Management in Enhancing Organization Pe...Determinantsof Strategic Supply Chain Management in Enhancing Organization Pe...
Determinantsof Strategic Supply Chain Management in Enhancing Organization Pe...paperpublications3
 
Supply Chains to Admire - 2015
Supply Chains to Admire - 2015 Supply Chains to Admire - 2015
Supply Chains to Admire - 2015 Lora Cecere
 
M M Bagali, PhD, Research paper, MBA Faculty, HRM, HR, HRD, PhD in HR and Man...
M M Bagali, PhD, Research paper, MBA Faculty, HRM, HR, HRD, PhD in HR and Man...M M Bagali, PhD, Research paper, MBA Faculty, HRM, HR, HRD, PhD in HR and Man...
M M Bagali, PhD, Research paper, MBA Faculty, HRM, HR, HRD, PhD in HR and Man...dr m m bagali, phd in hr
 

Similar to EFFECTS OF SUPPLIER EFFECTIVENESS ON ORGANIZATION PERFORMANCE AT KENYA SEED COMPANY KITALE, KENYA (20)

Influence of Strategic-2386.pdf
Influence of Strategic-2386.pdfInfluence of Strategic-2386.pdf
Influence of Strategic-2386.pdf
 
Effects of Supply Chain Management Practices on Organizational Performance: A...
Effects of Supply Chain Management Practices on Organizational Performance: A...Effects of Supply Chain Management Practices on Organizational Performance: A...
Effects of Supply Chain Management Practices on Organizational Performance: A...
 
5262020 Innovation Process Design Scoring Guidehttpsc.docx
5262020 Innovation Process Design Scoring Guidehttpsc.docx5262020 Innovation Process Design Scoring Guidehttpsc.docx
5262020 Innovation Process Design Scoring Guidehttpsc.docx
 
5262020 Innovation Process Design Scoring Guidehttpsc.docx
5262020 Innovation Process Design Scoring Guidehttpsc.docx5262020 Innovation Process Design Scoring Guidehttpsc.docx
5262020 Innovation Process Design Scoring Guidehttpsc.docx
 
Effect of Supply Chain Management Practices on Organizational Performance of ...
Effect of Supply Chain Management Practices on Organizational Performance of ...Effect of Supply Chain Management Practices on Organizational Performance of ...
Effect of Supply Chain Management Practices on Organizational Performance of ...
 
E0353042048
E0353042048E0353042048
E0353042048
 
Conquering the Supply Chain Effective Frontier - 27 NOV 2017 - Report
Conquering the Supply Chain Effective Frontier - 27 NOV 2017 - ReportConquering the Supply Chain Effective Frontier - 27 NOV 2017 - Report
Conquering the Supply Chain Effective Frontier - 27 NOV 2017 - Report
 
6 Strategic Alliance Success Factors.pdf
6 Strategic Alliance Success Factors.pdf6 Strategic Alliance Success Factors.pdf
6 Strategic Alliance Success Factors.pdf
 
6 Strategic Alliance Success Factors.pdf
6 Strategic Alliance Success Factors.pdf6 Strategic Alliance Success Factors.pdf
6 Strategic Alliance Success Factors.pdf
 
The Hazards of Sole Sourcing RelationshipsChallenges, Pract.docx
The Hazards of Sole Sourcing RelationshipsChallenges, Pract.docxThe Hazards of Sole Sourcing RelationshipsChallenges, Pract.docx
The Hazards of Sole Sourcing RelationshipsChallenges, Pract.docx
 
The Influence of Supply Chain Integration on the Intrapreneurship in Supply C...
The Influence of Supply Chain Integration on the Intrapreneurship in Supply C...The Influence of Supply Chain Integration on the Intrapreneurship in Supply C...
The Influence of Supply Chain Integration on the Intrapreneurship in Supply C...
 
Sustained Performance
Sustained PerformanceSustained Performance
Sustained Performance
 
Draft Due Week 5 and worth 50 pointsHave you ever needed just th.docx
Draft Due Week 5 and worth 50 pointsHave you ever needed just th.docxDraft Due Week 5 and worth 50 pointsHave you ever needed just th.docx
Draft Due Week 5 and worth 50 pointsHave you ever needed just th.docx
 
Supply Chain Metrics That Matter: A Focus on the High-Tech Industry - 2016
Supply Chain Metrics That Matter: A Focus on the High-Tech Industry - 2016Supply Chain Metrics That Matter: A Focus on the High-Tech Industry - 2016
Supply Chain Metrics That Matter: A Focus on the High-Tech Industry - 2016
 
Determinants of Strategic Supply Chain Management in Enhancing Organization P...
Determinants of Strategic Supply Chain Management in Enhancing Organization P...Determinants of Strategic Supply Chain Management in Enhancing Organization P...
Determinants of Strategic Supply Chain Management in Enhancing Organization P...
 
Whitepaper-Maximizing-the-Success-of-Your-CRO-Partnerships
Whitepaper-Maximizing-the-Success-of-Your-CRO-PartnershipsWhitepaper-Maximizing-the-Success-of-Your-CRO-Partnerships
Whitepaper-Maximizing-the-Success-of-Your-CRO-Partnerships
 
Determinantsof Strategic Supply Chain Management in Enhancing Organization Pe...
Determinantsof Strategic Supply Chain Management in Enhancing Organization Pe...Determinantsof Strategic Supply Chain Management in Enhancing Organization Pe...
Determinantsof Strategic Supply Chain Management in Enhancing Organization Pe...
 
Literature Review on Performance Management System
Literature Review on Performance Management SystemLiterature Review on Performance Management System
Literature Review on Performance Management System
 
Supply Chains to Admire - 2015
Supply Chains to Admire - 2015 Supply Chains to Admire - 2015
Supply Chains to Admire - 2015
 
M M Bagali, PhD, Research paper, MBA Faculty, HRM, HR, HRD, PhD in HR and Man...
M M Bagali, PhD, Research paper, MBA Faculty, HRM, HR, HRD, PhD in HR and Man...M M Bagali, PhD, Research paper, MBA Faculty, HRM, HR, HRD, PhD in HR and Man...
M M Bagali, PhD, Research paper, MBA Faculty, HRM, HR, HRD, PhD in HR and Man...
 

Recently uploaded

Historical philosophical, theoretical, and legal foundations of special and i...
Historical philosophical, theoretical, and legal foundations of special and i...Historical philosophical, theoretical, and legal foundations of special and i...
Historical philosophical, theoretical, and legal foundations of special and i...jaredbarbolino94
 
Organic Name Reactions for the students and aspirants of Chemistry12th.pptx
Organic Name Reactions  for the students and aspirants of Chemistry12th.pptxOrganic Name Reactions  for the students and aspirants of Chemistry12th.pptx
Organic Name Reactions for the students and aspirants of Chemistry12th.pptxVS Mahajan Coaching Centre
 
Pharmacognosy Flower 3. Compositae 2023.pdf
Pharmacognosy Flower 3. Compositae 2023.pdfPharmacognosy Flower 3. Compositae 2023.pdf
Pharmacognosy Flower 3. Compositae 2023.pdfMahmoud M. Sallam
 
Employee wellbeing at the workplace.pptx
Employee wellbeing at the workplace.pptxEmployee wellbeing at the workplace.pptx
Employee wellbeing at the workplace.pptxNirmalaLoungPoorunde1
 
Presiding Officer Training module 2024 lok sabha elections
Presiding Officer Training module 2024 lok sabha electionsPresiding Officer Training module 2024 lok sabha elections
Presiding Officer Training module 2024 lok sabha electionsanshu789521
 
Crayon Activity Handout For the Crayon A
Crayon Activity Handout For the Crayon ACrayon Activity Handout For the Crayon A
Crayon Activity Handout For the Crayon AUnboundStockton
 
POINT- BIOCHEMISTRY SEM 2 ENZYMES UNIT 5.pptx
POINT- BIOCHEMISTRY SEM 2 ENZYMES UNIT 5.pptxPOINT- BIOCHEMISTRY SEM 2 ENZYMES UNIT 5.pptx
POINT- BIOCHEMISTRY SEM 2 ENZYMES UNIT 5.pptxSayali Powar
 
“Oh GOSH! Reflecting on Hackteria's Collaborative Practices in a Global Do-It...
“Oh GOSH! Reflecting on Hackteria's Collaborative Practices in a Global Do-It...“Oh GOSH! Reflecting on Hackteria's Collaborative Practices in a Global Do-It...
“Oh GOSH! Reflecting on Hackteria's Collaborative Practices in a Global Do-It...Marc Dusseiller Dusjagr
 
Painted Grey Ware.pptx, PGW Culture of India
Painted Grey Ware.pptx, PGW Culture of IndiaPainted Grey Ware.pptx, PGW Culture of India
Painted Grey Ware.pptx, PGW Culture of IndiaVirag Sontakke
 
Earth Day Presentation wow hello nice great
Earth Day Presentation wow hello nice greatEarth Day Presentation wow hello nice great
Earth Day Presentation wow hello nice greatYousafMalik24
 
ENGLISH 7_Q4_LESSON 2_ Employing a Variety of Strategies for Effective Interp...
ENGLISH 7_Q4_LESSON 2_ Employing a Variety of Strategies for Effective Interp...ENGLISH 7_Q4_LESSON 2_ Employing a Variety of Strategies for Effective Interp...
ENGLISH 7_Q4_LESSON 2_ Employing a Variety of Strategies for Effective Interp...JhezDiaz1
 
Meghan Sutherland In Media Res Media Component
Meghan Sutherland In Media Res Media ComponentMeghan Sutherland In Media Res Media Component
Meghan Sutherland In Media Res Media ComponentInMediaRes1
 
Roles & Responsibilities in Pharmacovigilance
Roles & Responsibilities in PharmacovigilanceRoles & Responsibilities in Pharmacovigilance
Roles & Responsibilities in PharmacovigilanceSamikshaHamane
 
How to Make a Pirate ship Primary Education.pptx
How to Make a Pirate ship Primary Education.pptxHow to Make a Pirate ship Primary Education.pptx
How to Make a Pirate ship Primary Education.pptxmanuelaromero2013
 
EPANDING THE CONTENT OF AN OUTLINE using notes.pptx
EPANDING THE CONTENT OF AN OUTLINE using notes.pptxEPANDING THE CONTENT OF AN OUTLINE using notes.pptx
EPANDING THE CONTENT OF AN OUTLINE using notes.pptxRaymartEstabillo3
 
Proudly South Africa powerpoint Thorisha.pptx
Proudly South Africa powerpoint Thorisha.pptxProudly South Africa powerpoint Thorisha.pptx
Proudly South Africa powerpoint Thorisha.pptxthorishapillay1
 
Full Stack Web Development Course for Beginners
Full Stack Web Development Course  for BeginnersFull Stack Web Development Course  for Beginners
Full Stack Web Development Course for BeginnersSabitha Banu
 
DATA STRUCTURE AND ALGORITHM for beginners
DATA STRUCTURE AND ALGORITHM for beginnersDATA STRUCTURE AND ALGORITHM for beginners
DATA STRUCTURE AND ALGORITHM for beginnersSabitha Banu
 
Difference Between Search & Browse Methods in Odoo 17
Difference Between Search & Browse Methods in Odoo 17Difference Between Search & Browse Methods in Odoo 17
Difference Between Search & Browse Methods in Odoo 17Celine George
 

Recently uploaded (20)

Historical philosophical, theoretical, and legal foundations of special and i...
Historical philosophical, theoretical, and legal foundations of special and i...Historical philosophical, theoretical, and legal foundations of special and i...
Historical philosophical, theoretical, and legal foundations of special and i...
 
Organic Name Reactions for the students and aspirants of Chemistry12th.pptx
Organic Name Reactions  for the students and aspirants of Chemistry12th.pptxOrganic Name Reactions  for the students and aspirants of Chemistry12th.pptx
Organic Name Reactions for the students and aspirants of Chemistry12th.pptx
 
Pharmacognosy Flower 3. Compositae 2023.pdf
Pharmacognosy Flower 3. Compositae 2023.pdfPharmacognosy Flower 3. Compositae 2023.pdf
Pharmacognosy Flower 3. Compositae 2023.pdf
 
Model Call Girl in Tilak Nagar Delhi reach out to us at 🔝9953056974🔝
Model Call Girl in Tilak Nagar Delhi reach out to us at 🔝9953056974🔝Model Call Girl in Tilak Nagar Delhi reach out to us at 🔝9953056974🔝
Model Call Girl in Tilak Nagar Delhi reach out to us at 🔝9953056974🔝
 
Employee wellbeing at the workplace.pptx
Employee wellbeing at the workplace.pptxEmployee wellbeing at the workplace.pptx
Employee wellbeing at the workplace.pptx
 
Presiding Officer Training module 2024 lok sabha elections
Presiding Officer Training module 2024 lok sabha electionsPresiding Officer Training module 2024 lok sabha elections
Presiding Officer Training module 2024 lok sabha elections
 
Crayon Activity Handout For the Crayon A
Crayon Activity Handout For the Crayon ACrayon Activity Handout For the Crayon A
Crayon Activity Handout For the Crayon A
 
POINT- BIOCHEMISTRY SEM 2 ENZYMES UNIT 5.pptx
POINT- BIOCHEMISTRY SEM 2 ENZYMES UNIT 5.pptxPOINT- BIOCHEMISTRY SEM 2 ENZYMES UNIT 5.pptx
POINT- BIOCHEMISTRY SEM 2 ENZYMES UNIT 5.pptx
 
“Oh GOSH! Reflecting on Hackteria's Collaborative Practices in a Global Do-It...
“Oh GOSH! Reflecting on Hackteria's Collaborative Practices in a Global Do-It...“Oh GOSH! Reflecting on Hackteria's Collaborative Practices in a Global Do-It...
“Oh GOSH! Reflecting on Hackteria's Collaborative Practices in a Global Do-It...
 
Painted Grey Ware.pptx, PGW Culture of India
Painted Grey Ware.pptx, PGW Culture of IndiaPainted Grey Ware.pptx, PGW Culture of India
Painted Grey Ware.pptx, PGW Culture of India
 
Earth Day Presentation wow hello nice great
Earth Day Presentation wow hello nice greatEarth Day Presentation wow hello nice great
Earth Day Presentation wow hello nice great
 
ENGLISH 7_Q4_LESSON 2_ Employing a Variety of Strategies for Effective Interp...
ENGLISH 7_Q4_LESSON 2_ Employing a Variety of Strategies for Effective Interp...ENGLISH 7_Q4_LESSON 2_ Employing a Variety of Strategies for Effective Interp...
ENGLISH 7_Q4_LESSON 2_ Employing a Variety of Strategies for Effective Interp...
 
Meghan Sutherland In Media Res Media Component
Meghan Sutherland In Media Res Media ComponentMeghan Sutherland In Media Res Media Component
Meghan Sutherland In Media Res Media Component
 
Roles & Responsibilities in Pharmacovigilance
Roles & Responsibilities in PharmacovigilanceRoles & Responsibilities in Pharmacovigilance
Roles & Responsibilities in Pharmacovigilance
 
How to Make a Pirate ship Primary Education.pptx
How to Make a Pirate ship Primary Education.pptxHow to Make a Pirate ship Primary Education.pptx
How to Make a Pirate ship Primary Education.pptx
 
EPANDING THE CONTENT OF AN OUTLINE using notes.pptx
EPANDING THE CONTENT OF AN OUTLINE using notes.pptxEPANDING THE CONTENT OF AN OUTLINE using notes.pptx
EPANDING THE CONTENT OF AN OUTLINE using notes.pptx
 
Proudly South Africa powerpoint Thorisha.pptx
Proudly South Africa powerpoint Thorisha.pptxProudly South Africa powerpoint Thorisha.pptx
Proudly South Africa powerpoint Thorisha.pptx
 
Full Stack Web Development Course for Beginners
Full Stack Web Development Course  for BeginnersFull Stack Web Development Course  for Beginners
Full Stack Web Development Course for Beginners
 
DATA STRUCTURE AND ALGORITHM for beginners
DATA STRUCTURE AND ALGORITHM for beginnersDATA STRUCTURE AND ALGORITHM for beginners
DATA STRUCTURE AND ALGORITHM for beginners
 
Difference Between Search & Browse Methods in Odoo 17
Difference Between Search & Browse Methods in Odoo 17Difference Between Search & Browse Methods in Odoo 17
Difference Between Search & Browse Methods in Odoo 17
 

EFFECTS OF SUPPLIER EFFECTIVENESS ON ORGANIZATION PERFORMANCE AT KENYA SEED COMPANY KITALE, KENYA

  • 1. ISSN 2349-7807 International Journal of Recent Research in Commerce Economics and Management (IJRRCEM) Vol. 3, Issue 3, pp: (70-84), Month: July - September 2016, Available at: www.paperpublications.org Page | 70 Paper Publications EFFECTS OF SUPPLIER EFFECTIVENESS ON ORGANIZATION PERFORMANCE AT KENYA SEED COMPANY KITALE, KENYA Jared Rodrick Nyaundi1 , Dr. Mike A. Iravo2 1 Jomo Kenyatta University of Agriculture & Technology (Msc. Procurement & Logistics) 2 Jomo Kenyatta University of Agriculture & Technology (Ph.D) Abstract: Achieving competitive advantage in this competitive business environment is a challenge many managers face. Most organizations are faced with the delays in product delivery, ability of suppliers to concert their operating environment to create value. The supplier ineffectiveness, which affects organizational performance, which is as a result of reluctance to develop suppliers, build relations, and establish quality management and failure to use strategies which make suppliers a competitive advantage tool is a challenge. Even the process of developing suppliers, selection and retention has not helped either. The study was carried out to establish the effect of supplier effectiveness on organizational performance at Kenya Seed Company, Kitale. The main objectives which guided the research included: to establish the effects of Supplier agility on organizational performance; to investigate the process visibility on organizational performance; to find out the effect of supplier willingness on organizational performance and to determine effect of supplier capabilities on organizational performance. To explore these, a cross sectional study design was used. The target population was 360 from which 190 sample size was deduced for the study. Data was collected using focused group discussions and small groups discussions self- administered questionnaires, interview guides and content analysis to investigate the effect of supplier effectiveness on organizational performance. Findings showed that supplier effectiveness has significant positive and negative effects on performance. It was found that all the four components of supplier effectiveness influence the three dimensions of performance. The study also found out that where supplier effectiveness is high, the performance on organization is also higher, especially in areas that are affected by suppliers even though they may be internal to the buyer organization. It was therefore concluded that supplier effectiveness is an essential strategic tool for performance improvement. Hence organizations need to build relations that enhance supplier effectiveness so that performance of both the suppliers and buyer organizations can realize the benefits of this relationship in the supply chain network. Keywords: Organization Performance, Process Visibility, Supplier Agility, Supplier Capabilities, Supplier effective -ness & Supplier Willingness. 1. INTRODUCTION Globally, modern competitive climate drives organizations demand to focus on their core competencies and outsource non-core activities to external clients. Organizations want to increase if not improve, all aspects of their operations. These organizations focus on operations that promise genuine success. Innovative strategies are required to create a competitive advantage that allows for streamlining costs to boost profitability, revenue enhancements, product design and organizational improvements to match customer demands, vendor organizational, delivery metrics, price effectiveness, inventory flow, positive, image drive, good internal and external networks and flexibility when dealing with financial uncertainties. These are operational activity outcomes that are hard to achieve alone (Irungu & Wanjau, 2011). The
  • 2. ISSN 2349-7807 International Journal of Recent Research in Commerce Economics and Management (IJRRCEM) Vol. 3, Issue 3, pp: (70-84), Month: July - September 2016, Available at: www.paperpublications.org Page | 71 Paper Publications concerned organisation must seek strategic approaches towards realization of success that can boost operational, transformational and relational performances. In understanding this competitive organizational climate, emphasis is no longer put on competition between single firms, but rather on the competition between entire supply chains (Wagner, 2006). Improving operational performance has taken center stage for business transformational initiatives. Innovative tools, approaches and technologies are enabling companies to better perform with greater agility, flexibility and precision. Acceptable level performance is no longer achievable through owning abundance of time, resources and money. Managers face significant challenges in managing operations (Gustafsson & Karlsson, 2012). Customers expect consistent, personalized relationships, yet they have multiple points of contact that often are distributed geographically and organizationally. They demand that products and services be delivered in days if not hours, yet hundreds if not thousands of individuals must successfully coordinate their delivery. The breadth and complexity of organisational operations now demand progressive approaches to assure operational success. Organistions operate in an environment characterized by constant change, shorter product lifecycles, and increased demand uncertainty. This drives organisations towards initiatives that enhance sustainable source of competitive advantage. These can be forces emerging as dominant competitive vehicle for organizations operating in uncertain and ever-changing business environment (Aberdeen Group, 2009). Although the modern competitive organisational climate drives organisations towards focusing on their core competencies mainly and outsources non-core products or services to external suppliers, this approach has not been a common practice. Companies are becoming increasingly depending on external suppliers for resources and complementary capabilities. It is only a common practice in Europe, and United States of America where outsourcing contracts are procured to Asian industries (Holter, Grant, Ritchie, & Shaw, 2008). It means that the supply chain strength in these countries is quite stronger than that in Africa where the practice is minimal (Krauth, Moonen, Popova, & Schut, 2005). While some organizations are succeeding in some critical operational, transformational and relational areas of focus, most of them are not effectively managing these areas at all. Industry analysis suggests operational, transformational and relational performance gaps begin at the strategic level and carry through to a specific process breakdown. In addition, operations, transformational and relational functions often lack continuous improvement efforts targeting these inefficiencies and failure modes. But these have to satisfy minimum overall performance standards. Yet organizations need a mechanism to track supplier progress towards meeting organizational goals, and gives feedback to the supplier base on their individual performance. Good supplier performance is a key ingredient in enabling firms to achieve business performance excellence. But how can firms manage or even influence the performance of outside suppliers? Supplier effectiveness (SE) is being widely adopted as a method to understand and improve the performance of the extended enterprise (Gordon, 2010). It is built through effective communication, and clearly defined objectives. It includes critical processes to define measure and analyze supplier performance to meet business goals. The individual supplier effectiveness is also essential to support MNCs on the holistic supply chain management. Although the significance of the buyer-supplier relationship has long been focused on literature of business and management, little has been studied for its mediating role in supplier engagement, supplier infrastructure, supplier Organisational and supplier commitment each on supplier performance in an organisation (van Veele, 2005). This study tries to address this gap in the literature by examining the impacts of buyer-supplier relationship in its mediating role to supplier performance instead of firm performance in manufacturing industries. A conceptual research model has been developed to investigate the relationship of these variables and hypotheses are tested for predictive inference. The findings reveal that supplier Organisational and supplier commitment could influence supplier performance with a help from the mediating role of buyer-supplier relationship (van Weele, 2010). Supplier effectiveness (SE) is a key enabler for transforming into a mature purchasing organization. Measuring supplier performance is critical to ensure service level agreements, minimize risk, develop suppliers and reduce cost. The main objective of SE is to improve performance of both the supplier and the buying organization. By establishing supplier performance metrics a company can ensure that suppliers deliver according to contract agreements and market
  • 3. ISSN 2349-7807 International Journal of Recent Research in Commerce Economics and Management (IJRRCEM) Vol. 3, Issue 3, pp: (70-84), Month: July - September 2016, Available at: www.paperpublications.org Page | 72 Paper Publications norms. However, it is important not to think of SE only as establishing supplier scorecards but also as establishing effective business processes. There are five main areas that need to be considered when establishing effective SE. These include supplier-buyer relationship, leanness agility, willingness and capabilities (Parkash, & Kaushik, 2011). 2. RESEARCH OBJECTIVES This study explored the following specific objectives: i. To establish the effects of Supplier agility on organizational performance ii. To investigate the process visibility on organizational performance iii. To find out the effect of supplier willingness on organizational performance iv. To determine effect of supplier capabilities on organizational performance 3. LITERATURE REVIEW 3.1 Theoretical Framework Transaction Cost Theory Ronald Coase, Chester Barnard, and Herbert Simon are among the early authors who describe the contributions of transaction cost theory to the existence of firms (Scott, 2003; Williamson, 2005). These aspects of transaction cost theory are supporting evidences for the role of supply chain management in organizations. Whether supply chain is viewed as a network or as an integrated process, the transaction cost theory explains the vertical connection and integration of various elements of organizational supply chain, from second tier and first tier suppliers to first tier and second tier customers. Efforts to build and maintain the relationship with suppliers; cost of monitoring the performance of suppliers; resolving the problems that arise in the business relationships and engagement of suppliers in an opportunistic behaviour are common. However, transaction cost theory is primarily concerned with the direct economic factors in organizations and hence fails to address some important aspects of the operation of organizational supply chain, including personal and human relations among actors in the supply chain. Transaction cost theory is a valuable framework for describing the vertical integration in supply chain management studies. However, this theory mostly carries a neoclassical view of organizations as black boxes of operation. Agency Theory The agency theory was promoted with the seminal works of Max Weber (Beckert, and Zafirovski, 2006). The classic view of agency theory as develop by the works of Max Weber and others was mostly concerned with the conflict of interest between the political master and state officials. This view was built on the foundation of the neoclassical view of organization that views organizations as black boxes of operations, where the relationship between performance and incentives was overlooked (Beckert, and Zafirovski, 2006). New institutionalism view of organizations opened the black box of organizational operations and paved the way for the contemporary view of agency theory. In the old institutionalism view, opportunistic behaviour based on the rational system view was dominant. However, the new institutionalism view of the organizations, promotes the delegation of responsibilities and operation, through an open system view towards the environment. 3.2 Conceptual Framework The independent variables for Supplier effectiveness (SE) include: supplier agility, supplier willingness, supplier capabilities and process visibility. These variables were investigated to determine their influence on organisational performance in public institutions in Kenya.
  • 4. ISSN 2349-7807 International Journal of Recent Research in Commerce Economics and Management (IJRRCEM) Vol. 3, Issue 3, pp: (70-84), Month: July - September 2016, Available at: www.paperpublications.org Page | 73 Paper Publications Independent Variable (IV) Dependent Variable (DV) Figure 3.1 : Conceptual Framework Supplier agility provides the basis of preparedness towards being alert, accessible, decisive, swift, and flexible (Gligor, 2015). These dimensions are form of resources and capabilities that companies must develop to achieve the desired level of agility. The companies can further improve their supplier agility by using a self-evaluation questionnaire based on these five dimensions to determine where they fall on the agility spectrum, whether corrective actions are needed, and where to make those corrections. The current business environment is characterized by irregular customer demands, constant change, shorter product lifecycles, and increased demand uncertainty (Sheppard, Young, Doyle, Sheppard & Newton, 2006). As these conditions have become the norm, companies must have the ability to quickly detect changes, opportunities, and threats; the ability to quickly access relevant data; the ability to make decisions resolutely using the available information; the ability to implement decisions quickly and the ability to modify its range of tactics and operations to the extent needed to implement its strategy. This domain has emerged as the dominant competitive vehicle for organizations operating in such an uncertain and ever-changing business environment. An organisation that lacks ability to quickly detect changes, opportunities, and threats (alertness); quickly access relevant data (accessibility); make resolute decisions about how to act (decisiveness); quickly implement those decisions (swiftness); and modify its range of supply chain tactics and operations to the extent needed to implement its strategy (flexibility) cannot be able to achieve its competitive advantage in the modern business environment (Gligor, 2015). These five dimensions are useful in determining what supplier agility is and the level of organisational agility with suppliers. 4. RESEARCH METHODOLOGY Research Design This study adopted an exploratory study design. The exploratory design is appropriate for assessing whether the case organizations have experienced supplier effectiveness. This was necessary as it enabled the formulation of a precise problem for investigation and developing the study hypothesis. It enabled the study to present information regarding the immediate conditions, presentations of crucial issues, study of the unknown fields, theoretical base, and presentation of uncertain problem for study in research. This was crucial since this issue of supplier effectiveness and the three dimensions of performance pursued in this study were not clearly defined currently. Hence this design allowed the researcher to be acquainted with the problem and concept researched, and enabling the production of hypotheses tested. This way, it enabled questionnaires to be discussed in the focus groups including small group discussions. This enabled the generation of better understanding of the issues needed to be filled in the questionnaire. It enabled the collection of the new information about supplier effectiveness and organizational performance. Finally, this design helped to fulfill the researcher’s curiosity and need for greater understanding, to test the feasibility of starting a more in depth study, and also to develop the methods to be used in any following research projects. The design provided a representative sample from a target population of all other Kenya seed branches in the country. Other Influencing Factors  Political  Economical Supplier Effectiveness  Supplier Agility  Process Visibility  Supplier Willingness  Supplier Capabilities Organizational Performance  Operational  Relational  Transformational
  • 5. ISSN 2349-7807 International Journal of Recent Research in Commerce Economics and Management (IJRRCEM) Vol. 3, Issue 3, pp: (70-84), Month: July - September 2016, Available at: www.paperpublications.org Page | 74 Paper Publications Population of the Study According to Ngechu, (2004) a population is a well-defined set of people, services, elements, things or households under investigation. Kothari, (2004) defines population as all items in a field of enquiry. The target population of this study was 360 employees of Kenya Seed Company in Kitale. The respondents were drawn from all the departments within the company since the effectiveness of the suppliers can be experienced within the entire organisations (See Table 3.1). Sample Size and Sampling Procedure According to Kothari, (2004), the sample size should be optimum in order to fulfill the requirements of Technical, representation, reliability and flexibility. While deciding sample size, the researcher determines the desired precision as also an acceptable confidence level of the estimate (Kothari, 2004). Mugenda and Mugenda, (2004) recommends 10% of accessible population is adequate. At least 10% sample of the population is considered a generally acceptable method of selecting samples in such a study (Stanley & Gregory, 2001). Kerlinger (2009) states that a 10% sample allows for reliable data analysis and provides desired levels of accuracy for testing significance of differences between estimates. Empirical study by Roscoe (1975), suggests that sample size should be larger than 30 and less than 500. The sample size of this study was 190 respondents, which were picked through simple random sampling. Using confidence level of 95%; level off error of 5% and the target population of 360, the simple random calculator generated a population of 186. This was confirmed by the calculation of the formula given below that generated 189 and some decimal numbers this was rounded up to whole number generating 190. The participants were asked to voluntarily participate in the study by answering a questionnaire and the interview questions. This sample size produced adequate data for analysis and in making conclusive generation. Simple random sampling method was used to select respondents from various strata. Gay (2002) identifies random sampling as the best form of sampling as it allows all members of population to have an equal and unbiased chance of appearing in the sample. This subsection covers the sample size and sampling technique. A sampling frame according to Cooper and Schindler is a list of elements from which the sample is actually drawn and is closely related to the population. A sample size was determined based on these registrants. A formula propounded by Cochran (1963) will be used to determine the size as follows; Where; n – is the sample size N – is the population size ℮ – is the level of precision (95%; e = 0.05) Given that N=360 (see Table 3.1); ℮2 =0.052 Therefore n= 360÷ (1+ (360*0.052 )= 189.47368 approximately 190, hence from the above a sample of 190 respondents that were selected for the study. The Institute of Economic Affairs (2009) defines a sample size as a function of logistics and homogeneity or heterogeneity of the population. According to Sekaran (2006) adequacy, means the sample should be big enough to enable reasonable estimates of variables to be obtained, capture variability of responses and facilitate comparative analysis. Kothari (2004) recommends any large sample to be at least 10% of the target population. The sample of 190, which is 52.8% of target population, was therefore adequate to address the objectives of the study. The sub-sample in each stratum was calculated by multiplying the stratum population with the sample proportion as shown in Table 3.1. Table 1: Sample Size and Sampling Procedure Category of Population Determination Sample Size 1. Top Level management 20 (20/360)*190 11 2. Middle Level 80 (80/360)*190 42 3. Operational Level 260 (260/360)*190 137 Total 360 190
  • 6. ISSN 2349-7807 International Journal of Recent Research in Commerce Economics and Management (IJRRCEM) Vol. 3, Issue 3, pp: (70-84), Month: July - September 2016, Available at: www.paperpublications.org Page | 75 Paper Publications Data Collection Procedure Data was collected through an administration of questionnaire distributed to the sample group of 200 participants and to an extend interview was applied where there was need for further clarification. The respondents were asked to answer questions without regard to gender, age, or qualifications. The questionnaire is preferred due to its ability to collect data from a large group within a short time. Data Collection Instruments The instruments that were used are the questionnaires and interview schedule. The questions covered areas of objectives of the project and the conceptual framework. Both primary and secondary data were used to obtain information for the success of this research. Primary data were obtained through self- administration of questionnaires and observations. These two methods were identified because of their advantages and ability to compliment the other. The respondents were required to fill the designed questionnaire so as to assist the researcher with the data that were needed in the study. The questionnaire was the main tool used in the research. The questionnaire consisted of questions and statements. Secondary data were obtained from research journals and the company reports and documents. Pilot Study A pilot study was conducted in a similar environment with 30 respondents drawn from Panar Seed Company. The process was repeated again using the same respondents after an interval of one week for reliability. Mugenda and Mugenda (2006), defines reliability as a measure of the degree to which a research instrument yields consistent results or data after repeated trials. A re-test method assessing reliability of data involves administering the same instrument twice to the same subjects. Content validity of the instruments was determined through piloting, where the responses of the subjects were checked, against the research objectives. Mugenda and Mugenda (2006), defines validity as the accuracy and meaningfulness of inferences, which are based on the research results. For a research instrument to be considered valid, the content selected and included in the questionnaires must be relevant to the variable being investigated, (Neuman 2000). Validity of the Questionnaire Determining validity of the instrument was one indispensable characteristics of measurement that must be considered in establishing the appropriateness and usefulness of instruments of measurements. Although this instrument was valid, face and content validity of the instruments were established again by a panel of expert. Researchers generally determine validity by asking a series of questions, and often look for the answers in the research of others (Orodho, 2008). A pilot study was carried out to determine the validity of the questionnaire; a pilot study was conducted in a similar environment prior to the actual research. The participants in the pilot study were not included in the actual research. Therefore validity of the instrument was realized after the researchers had examined the content of the instruments, through judgment of experts and the supervisors’ validations, which guided the researchers. The study applied different techniques to assess the Cronbach’s (1951) reliability coefficient alpha and to assess face and construct validity. In order to ascertain face validity, an initial questionnaire was passed through the routine editing after it was given to the panel of experts. They were asked to respond to the questionnaire. Very few comments were received and some minor changes were done to enhance the clarity. Reliability of the Questionnaire A reliability of the measuring instrument addresses the question of whether the results of the measuring processes are consistent on occasions when they should be consistent (Trochim, 2006). It is a statistical concept that is related to consistency and dependability, that is, consistency in obtaining the same relative answer when measuring phenomena that have not changed (Burns and Bush, 2010). Questionnaires have a very limited purpose as they are often one-time data gathering methods with a very short life, administered to a limited population (Norval, 2006). The following are important parts of reliability: test-retest reliability (coefficient correlation of stability). Consistency is estimated by comparing two or more repeated questions of the measuring instruments. This gives an indication of the dependability of the result on one occasion which may then be compared with the results obtained on another occasion and internal consistency reliability. This indicates how well the test items measure the same thing (Blumberg, et al., 2005). In this study reliability of the
  • 7. ISSN 2349-7807 International Journal of Recent Research in Commerce Economics and Management (IJRRCEM) Vol. 3, Issue 3, pp: (70-84), Month: July - September 2016, Available at: www.paperpublications.org Page | 76 Paper Publications questionnaire was determined using a sample of respondents. The items were measured by a 5-point Likert-scale, which ranged from strongly disagree (1) to strongly agree (5). Reliability analysis was subsequently done using Cronbach’s Alpha which measures the internal consistency to establish if certain items within a scale measure the same construct. Cronbach Alpha was established for every variable. Table 2: Reliability & Validity Analysis Constructs No. of Items No. of items (.60 & above) retained Alpha Value Mean Std Dev. Variance Explained Organization Performance 15 12 0.7839 4.03 0.48 0.57 Supplier Agility 10 7 0.8102 3.87 0.441 0.52 Process Visibility 15 8 0.9195 3.79 0.609 0.63 Supplier Willingness 10 6 0.8761 4 0.452 0.58 Supplier Capabilities 10 6 0.7969 3.45 0.779 0.74 Total 60 39 3.82 0.6 (Number of items retained that has corrected-item total >.40 The results in Table 3.3 indicate that Supplier Willingness had the highest reliability (α= 0.9195), followed by Supplier Agility (α=0.8102), Process Visibility (α=0.7969) and Organizational Performance (α=0.7839). This is an illustration that all the four variables were reliable as their reliability values exceeded the prescribed threshold of 0.7. This concurs with Gliem & Gliem (2003) who established the Alpha value threshold at 0.7. Data Analysis and Presentation This study adopted both qualitative and quantitative analysis in order to achieve the objectives of the study. Descriptive methods were employed. The data was organized in tabular form and represented in frequency distribution tables and percentage distribution of the respondents. Quantitative techniques (frequency tables and charts) were used for the presentation of quantifiable data that were presented textually using descriptive and inferential statistics. The questionnaires were collected and counted to ensure that all respondents had answered and completed the questions. The returned questionnaires were coded and captured on the computer. De Vos, et al. (2007) describes data analyses as the process of bringing order, structure and meaning to the mass of collected data. Questionnaires received from respondents, content analysis and interview schedules were checked for completeness with repeat calls being made for incomplete questionnaires to maintain the number of respondents. Categorization and coding was then done and data entered into SPSS for windows version 20 for analysis. Both descriptive and inferential tests were used in the analysis. Data was described or summarized using descriptive statistics such as mean and frequencies, which helped in meaningfully describing the distribution of responses. Various inferential statistics was used to infer population characteristics from the sample. Pearson’s correlation coefficient was used to establish relationships between variables. A multiple linear regression model was used to predict organization performance using the four independent variables in the study: Supplier Agility, Process Visibility, Supplier Willingness and Supplier Capabilities. In addition, the β coefficients for each independent variable generated from the model was subjected to a z–test, in order to test each of the hypotheses under study. The regression model used to test is shown below: Y = α + β1X1 + β2X2 +β3X3 + β4X4 +Ɛ Where; Y – Organizational Performance (OP) α - Constant β1, β2, β3 and β4 - Coefficient indicating rate of change of organizational performance as Supplier Effectiveness measured by its four dimensions of Supplier Agility, Process Visibility, Supplier Willingness and Supplier Capabilities changes. X1 – Supplier Agility (SA) X2 – Process Visibility (PV) X3 – Supplier Willingness (SW)
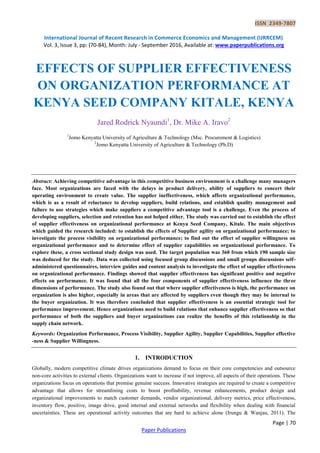
  • 8. ISSN 2349-7807 International Journal of Recent Research in Commerce Economics and Management (IJRRCEM) Vol. 3, Issue 3, pp: (70-84), Month: July - September 2016, Available at: www.paperpublications.org Page | 77 Paper Publications X4 – Supplier Capabilities (SC) Ɛ - Error term All the above statistical tests were analyzed using the Statistical Package for Social Sciences (SPSS), version 20. All tests were two-tailed. Significant levels were measured at 95% confidence level with significant differences recorded at p < 0.05. 5. DATA ANALYSIS AND PRESENTATION Response Rate The response rate of the respondents is critical to this study because it reflects the in-depth of the data gathered. Questionnaire forms were used to collect data required for the study and a total of 190 questionnaire forms were distributed to the sampled participants. Out of the 190 questionnaires distributed, 150 (78.95%) were appropriately filled and returned, this were marked complete. The rest 40 (21.05%) were either not returned or were partially filled, and were marked incomplete and so were discarded during analysis. A response rate of 50% and above is acceptable (Mugenda, 2003). Therefore a return of 150 (78.95%) of the questionnaires was considered a success and acceptable for this research. The results are as shown in figure 5.1. Figure 1: Response Rate of Respondents As shown in figure 1 respond by the top level employees and mid level employees was lowest, this was attributed to the fact that mid level employees are the people who mainly undertake the affairs of the firms on a daily basis including administrative duties outside their firms barring them from getting ample time to participate in this survey. Although the participants were asked in advance to create time to participate in the survey and even scheduled specific days for this exercise, in this case it might have been that most of departmental heads (mid level employees) did not abide by this requirement or were not able to return their dully filled questionnaires to the researcher. The lower level employees had the highest response rate (80.0%). The higher response by lower level employees could be attributed to the fact that the researcher had a personal contact with them during administering the questionnaires. At the same time, this could be to the fact that they were able to create some time off their schedules to participate in this study. This is an indication of their involvement of matters relating to their firms. Multiple Liner Regression Analysis The result of regression analysis for both linear and multiple regression analysis provides the functions of the equation that represents the best prediction of a dependent variable from several independent variables. This method is used when the independent variables are correlated with one another and with the dependent variable. The following regression equation is estimated as follow: CE = α0 + β1SA + β2PV + β3SW +β4SC + ε………………………………………………2 Where: OP: Organisational Performance α0: Constant SA: Supplier Agility 0 20 40 60 80 100 120 Top level Mid Level Employees Lower level Employees 10 36 104 1 6 33 Not Returned Returned
  • 9. ISSN 2349-7807 International Journal of Recent Research in Commerce Economics and Management (IJRRCEM) Vol. 3, Issue 3, pp: (70-84), Month: July - September 2016, Available at: www.paperpublications.org Page | 78 Paper Publications PV: Process Visibility SW: Supplier Willingness CE: Supplier Capabilities ε: Error term. Table 5: Summery of the Regression Model Model Summary Model R R Square Adjusted R Square Std. Error of the Estimate Change Statistics R Square Change F Change df1 df2 Sig. F Change 1 .877a .769 .045 13.32000 2.393 4.000 95 0 .000 a. Predictors: (Constant), SA, PV, SW, SC b. Dependent Variable: OP Table 5. Shows multiple regressions which is related to OP as dependent variable. The Table shows the influence of independent variable SA, PV, SW and SC on dependent variable OP. The Table indicates that the independent variables determine 76.9% of the OP variance. This means that the other factors influence OP by 23.1%. Multiple Regression Analysis A Multifactor linear regression model was used to predict organizational performance in the study. The prediction was carried out basing on the effect of the four independent factors: Supplier Agility, Process Visibility, Supplier Willingness and Supplier Capabilities. In addition, the b coefficients for each independent variable generated from the model was subjected to a t-test. The multiple regression analysis was evaluated to determine any effects of the independent variables on the dependent variable. This was important since it was necessitating the test of hypotheses on individual Supplier Effectiveness dimensions that included Supplier Agility (SA), Process Visibility (PV), Supplier Willingness (SW) and Supplier Capabilities (SC). The results are as shown in Table 6. Table 6: The Coefficients of Multiple Regression Analysis Coefficients Model Unstandardized Coefficients Standardized Coefficients t Sig.B Std. Error Beta 1 (Constant) 12.102 8.907 1.359 .177 SA 1.493 2.056 -.074 -.726 .469 PV 1.194 4.501 .026 .265 .791 SW .678 .758 .093 0.894 .374 S -14.768 5.950 -.249 -2.482 .015 a . Dependant Variable OP CE = α0 + β1SA + β2PV + β3SW +β4SC + ε 12.103+1.493SA+1.194PV+0.678SW-14.768SC+ε Table 6 shows the relationship between independent variables namely SA, PV, SW, SC on dependent variable OP. Statically, there is significant relationship between four dimensions of the ET mechanisms used in this study; LA, PV, SW and SC, on the Organisational Performance (OP). It is clear that the increasing in the percentage of Supplier Effectiveness
  • 10. ISSN 2349-7807 International Journal of Recent Research in Commerce Economics and Management (IJRRCEM) Vol. 3, Issue 3, pp: (70-84), Month: July - September 2016, Available at: www.paperpublications.org Page | 79 Paper Publications dimensions, OP will increase although some components have decreasing effects. If the Process Visibility increases by 1, the OP will decrease by about -14.8. If Supplier Effectiveness components SA, PV, SW and SC are equal to zero, OP will be 12.103 units of level of performance. 6. SUMMARY, CONCLUSIONS AND RECOMMENDATIONS Summary of the Findings Taken at face value, the results of this project suggest that supplier effectiveness is critical to the organisational performance. To evaluate what this means about the influence of supplier effectiveness dimensional competencies, it is important to recognize that there are different goals associated with such competencies and that some organisations may be interested in only one of them. If, for example, the aim is to give buyers upper chance of providing better services and product qualities to their clients, then suppliers become effective in the supply chain but this does not imply that suppliers who are not effective are merely retained in the supply chain of a buying organisation, this is why there are supplier development, selection and segmentation activities; this project does not address this. If the rationale behind supplier effectiveness goes a step further and intends for agility, visibility, willingness and capabilities to provide networks that is reliable, relevant, and responsive to the desires of the buyers and the customers of the buyers for higher quality performance, then there is evidence that supplier effectiveness is critical in the supply chain network. This is because implementing retention of suppliers who are non-performing are not spared hence those who earn effectiveness are only those who have shown improved performance to both the supply chain and the organisation. Based on the findings, the study found out that majority of participants are male accounting with a proportion of over 67% of the total respondents, which means that there are more male suppliers owned organisations than female owned organisation suppliers and that male dominancy is a factor in supplier effectives in the supply chain. They command the entire networks with little representation of female participation respondents during the time of answering the questionnaire. The findings also affirmed that there were more married respondents, which may determine the decisions to frequently hope from job to job. The results also attested that majority of respondents had bachelors degree affirming that there were moderate levels of literacy among the respondents, a level of education that qualifies one to rank higher in performance since it enables one to acquire more knowledge, and skills for competency in productivity. This implies that the modal age bracket was 25-44. The findings also affirmed that respondents have been in their work station or affirmed that majority of the participants have been with their current employer as from less than 10 years to 40 years confirming the organisational and supplier length of experience in this field that can be useful for development of effectiveness. It was also found out that majority of participants were at the lower level of management. The findings on the level of organisational performance showed that there was performance that meets the expectations. Majority 70.0% (105) of the sampled respondents approved the performance of this level of performance. The historical data also coincides with these findings where in the annual reports growth performance surpassed 100%. That means the actual results were more than budgeted expected performance. This is an indication that the level of financial outcome is significantly stable. The other variable of performance measure in this study was relational. This is also confirmed by the findings as majority of respondents approved the relational level of performance as also meeting the expectations, especially exceptional 46% (92) that accounted for close to a half of the sampled population and in total, 76.0% (152) of respondents approved the relational performance of the firm as meeting the expectations. The performance based on transformational show that majority of respondents approved the level rating as exceptionally higher. This is also related to the level of education; desire to stay longer in the organization, training and development, various incentives that employees are able to access in this organization. In general findings of organisational performance, of all the items of performance measures, it showed that Transformational scored the highest 79% (158), relational 76% (152), then operational at 72% (144) and finally relational which accounted for 70% (140). This may be attributed to the fact that these attributes are important in performance as they may be the drivers of Operational. The findings of descriptive statistics showed that the mean scores of employee skills on performance is moderately stable at highest score of mean 3.9060 and standard deviation of 1.38329 with the least mean score of 3.0016 and standard
  • 11. ISSN 2349-7807 International Journal of Recent Research in Commerce Economics and Management (IJRRCEM) Vol. 3, Issue 3, pp: (70-84), Month: July - September 2016, Available at: www.paperpublications.org Page | 80 Paper Publications deviation of 1.04037. This is an indication that generally the level of performance as influenced by supplier effectiveness is stable and higher. At the same time, mean scores for each indicator ranged from 2.0015(SD = .00145) to 2.23457 (SD = .10897). Relational had the highest mean scores, while organizational performance had the lowest mean and standard deviation scores. Overall, the item mean for organizational performance was 2.0015 (SD = .00145), which was within the lowest average level. This is an indication that the performance level is compliant with the individual items of measure hence a rating of healthy performance. The study found out that majority of participants approved the statement that the supplier effectiveness enables accumulation of considerable knowledge base of the company’s culture and its products and services. In relations to employee having experienced many changes within the workplace, and consequently understand what works and what doesn’t, results show that strongly agree accounted for 52.7% (106), agree 35.3% (71), disagree accounted for 07.3% (15), and strongly disagree 02.7%(06). This is an indication that majority of the participants agreed that supplier effectiveness enable them experience many changes within the workplace, and consequently understand what works and what doesn’t. At the same time, these results show that that strongly agree accounted for 51.3% (103), agree 34.0% (68), disagree accounted for 09.3% (19), and strongly disagree 05.3% (11). This is an indication that majority of the participants also agreed that tenure has enabled them develop quality standard and accuracy technique minimizing mistakes and resource wastage. Moreover, from the findings one realizes that strongly agree accounted for 50.7% (102), agree 32.7% (66), none 02.0% (04), disagree accounted for 09.3% (19), and strongly disagree 05.3% (11). This implies that majority of participants approved the statement that supplier effectiveness has made buyers possess a keen understanding of procedures and techniques for increased financial management or revenue administration. Also participants with opinion of strongly agree accounted for 50.7% (102), agree 32.7% (66), disagree accounted for 10.0% (20), and strongly disagree 06.7% (14). This implies that majority of participants agreed with the statement that supplier effectiveness necessitates creation of routine success in service delivery. Again these results reveal that strongly agree accounted for 49.3% (74), agree 34.7% (70), disagree 10.0% (20), and strongly disagree 06.0% (12). This implies that majority of participants agreed with the statement that the tenure necessitates cooperative work relations in groups and teams. In relation to measure that Ability to complete objectives and goals under pressure without supervision, the findings show that strongly agree accounted for 48.7% (98), agree 32.7% (66),none 02.7% (06), disagree 10.0% (20), and strongly disagree 06.0% (12). This implies that majority of participants accepted the statement that tenure enhances ability to complete objectives and goals under pressure without supervision. The objective one stated the effect of supplier agility on organisational performance. The findings showed that reported that supplier agility is an essential component of their effectiveness. Supplier agility has enabled them to acquire considerable knowledge base of the company’s culture and its products and services, have experienced many changes within the workplace, and consequently understand what works and what doesn’t, developed quality standard and accuracy technique minimizing mistakes and resource wastage, possess a keen understanding of procedures and techniques for increased benefits of the supply chain, creation of routine success in service delivery, necessitates cooperative work relations in groups and teams and ability to complete objectives and goals under pressure without supervision. All elements that are performance based for improved productivity and in generally Supplier agility was (mean=2.68314). This means that higher level of supplier agility have an effect on the performance of this organsiation. The objective two was to find out the effects of process visibility on organisational performance. The findings revealed that there was a strong positive correlation meaning that process visibility has a significant effect on the performance level of an organsiation. This means that higher process visibility will increase organizational performance. The third objective of the project was to determine the effects of Supplier willingness on organisational performance. The findings showed a strong negative relationship between the two implying that weaker work environment means poor or lower level of performance. The fourth objective was to examine the effect of supplier capabilities on organisational performance. The findings indicated that there is a significant positive relationship between them. This implies that where there are resources the ability to connect and convert these resources into products is possible, hence where there is poor level of performance
  • 12. ISSN 2349-7807 International Journal of Recent Research in Commerce Economics and Management (IJRRCEM) Vol. 3, Issue 3, pp: (70-84), Month: July - September 2016, Available at: www.paperpublications.org Page | 81 Paper Publications that requires improvements. The findings therefore showed that there are negative and positive effects of the four components of supplier effectiveness on organisational performance. Hypotheses Testing There were also four hypotheses that were tested by this project . Hypothesis 1 tested therelationship between supplier agility and organisational performance. The test findings showed that there was significantly positive relationship between supplier agility and organisational performance, supplier agility was negatively correlated to organisational performance (coefficient estimate (β1 = 0.681, p value =0.000). There is moderately high degree of supplier agility has been found to influence the competitiveness of the organisation in terms of poor supplier productivity as they may intend to perform simpler activities in order to avoid this situation. Hypothesis 2 tested the statement that there is no relationship between process visibility and organisational performance. The findings revealed that there is no agreement with this statement, (coefficient estimates (β2 = 0.311, p value =0.000). This showed that a high level of employee skill support system contributes immensely to organisational performance. Hypothesis 3 stated that Supplier willingness has no significant effect on organisational performance. The findings showed that there is no agreement with this statement since Supplier willingness has coefficient estimate (β3 = 0.238, p value =0.018), hence hypothesis 3 does not hold. It means that higher level Supplier willingness improves performance as employees are dedicated to their assigned duties without fear Hypothesis 4 states that supplier capabilities have no significant effect on organisational performance. The statistical tests findings showed that there is inconsistency with the hypothesis ; hence Supplier capabilities was correlated to organisational performance, (coefficient estimates (β4 = -0.186, p value =0.000). This means that when organization attains level of being cost effective, there is an increased level of performance. 7. CONCLUSIONS These findings provided an environment that proves the supplier agility has an effect on organisational performance as it contributes to the improvement or decrease in performance, and an indication of its magnitude effect. From the study findings there is enough proof to conclude that supplier agility is related to performance level that meets the expectation, exceptional and that exceeds expectations. There is also a proof that process visibility has an important role in improving organisational performance. Specifically, for supplier effectiveness with ability to disseminate these skills to the new recruits, performance likely to improve since there will always be a match in employee competency level. There were also findings that Supplier willingness has a significant effect on organisational performance. This implied that stable work place support employee skill and knowledge development enhancing experience as there is no fear that the next move is sacking of an employee. The last conclusion made was that supplier capabilities have a significant effect on organisational performance. It is therefore prudent for the firms to ensure that there is supplier capabilities level in the system so that resources wastages are not encountered. Finally the general conclusion is that supplier effectiveness has significant effects on organisational performance. The findings above provide evidence of proof that the components of supplier effectiveness are related to organisational performance either positively or negatively. 8. RECOMMENDATIONS From the findings and conclusions above, the project makes the following comments: that it is not an offense for an employee whose desire is to find an organisation where he/she can work for longer period of time. At the same time, an employer who reaps talent and competency from employees owing to their long tenure has no reason to merely retrench or sack such employees only because they have overstayed. What is important is productivity and improvement in the work place. No organisation engages on introducing incentives that are expected to improve employee competency yet
  • 13. ISSN 2349-7807 International Journal of Recent Research in Commerce Economics and Management (IJRRCEM) Vol. 3, Issue 3, pp: (70-84), Month: July - September 2016, Available at: www.paperpublications.org Page | 82 Paper Publications after obtaining such incentives such employee is intended to leave next minute. That will be a poor management strategy. The findings have proved that there are indeed effects of supplier effectiveness on organisational performance. The findings of this project deduced that supplier agility has a profound effect on organisational performance. This suggested that organisations with employees whose longevity is higher contribute to performance. Therefore, the organisations should strive to ensure that their effective suppliers keep improving on their efficiencies so as to be retained and work on a relational value creation network in the supply chain. The study finds strong support for the argument that process visibility has effects on performance, thus there should be an environment that encourages suppliers to obtain relevant information, consistency, competency reliability and trackability to enhance improved performance. This way, new and even ineffective suppliers will have a support base to improve and pursue competency. The findings also indicated that Supplier willingness has a significant effect on performance. Thus the supplier effectiveness must maintain the environment that is stable to keep current and new ones without fear of being the next on axe line. The supplier willingness enables accumulation and acquisition of talents that are essential to performance improvement. Finally, supplier capabilities was also found to have a significant effect on organisational performance, therefore the organisations need to ensure that they work toward achieving this status to reduce unnecessary wastages of resources. Suggestions for Further Studies This study was done only in a sub-region, it is important for future studies to be done on a larger study area, such as the entire country. The other case was that this study did not look at the cause effects so it is important to carry out a longitudinal study of at least five years to determine the cause effects of supplier effectiveness on organisational performance. There is also the need to study the effects of short term and long term employment on performance. REFERENCES [1] Aberdeen Group, (2009). Executive dashboards the key to unlocking double digit profit growth: Aberdeen Group. [2] Benson Kuira Irungu, B. K., & Wanjau, K. L., (2011). Effectiveness of vendor managed inventory systems in retail supermarkets in Kenya. International Journal of Business and Public Management (ISSN: 2223-6244) Vol. 1(1): 85- 89 [3] Borgström, B. (2005, September). Exploring efficiency and effectiveness in the supply chain: A conceptual analysis. In Proceedings from the 21st IMP Conference. [4] Charron, K., 2006. Why KPIs belong in supply chain contracts. Supply Chain Management Review, 10(2), pp. 22- 28. [5] Christopher, M., 2005. Logistics and supply chain management: creating value-added networks. 3rd ed. Harlow: Pearson Education Limited. [6] Early, J., (2015). The 3 Dimensions of Supplier Performance Management [7] Fleischer, D., & Christie, C. (2009). Evaluation use: Results from a survey of U.S. American Evaluation Association members. American Journal of Evaluation, 30(2), 158–175. [8] Forker, L.B., & Hershauer, J. C. (2000). Some determinants of satisfaction and quality performance in the electronic components industry. Production and Inventory Management Journal 41(2),14–20. [9] Gadde, L.-E., Håkansson, H. & Persson, G., 2010. Supply Network Strategies. 1st ed. Wiltshire: John Wiley & Sons. [10] Gligor, D. M., (2015). The Five Dimensions of Supply Chain Agility. CSCMP's Supply Chain Quarterly. Supply Chain Media LLC Publication. [11] Gonzalez, M. E., & Quesada, G. (2004). Determining the Importance of the Supplier Selection Process in Manufacturing: A Case Study. International Journal of Physical Distribution & Logistics Management, 34(6), 492-504 [12] Goodpasture, J. C. (2004). Quantitative Methods in Project Management. J. Ross Publishing.
  • 14. ISSN 2349-7807 International Journal of Recent Research in Commerce Economics and Management (IJRRCEM) Vol. 3, Issue 3, pp: (70-84), Month: July - September 2016, Available at: www.paperpublications.org Page | 83 Paper Publications [13] Gordon, S., 2005. Seven Steps to Measure Supplier Performance. Quality Progress, 38(8), pp. 20-25. [14] Gordon, S., 2008. Supplier Evaluation and Performance Excellence: A Guide to Meaningful Metrics and Successful Results. Florida: J. Ross Publishing. [15] Gunasekaran, A., Patel, C. & McGaughey, R. E., 2004. A framework for supply chain performance measurement. International Journal of Production Economics, 87(3), pp. 333-347. [16] Gustafsson J., & Karlsson E., (2012). Supplier performance dashboard at Volvo Logistics. Department of Technology Management and Economics. Division of Logistics and Transportation Chalmers University of Technology. Report No. E2012:025 [17] Handfield, R., Walton, S. V., Sroufe, R. & Melnyk, S. A., 2002. Applying environmentalcriteria to supplier assessment: A study in the application of the Analytical Hierarchy Process. Journal of Operations Management, Issue 141, pp. 70-87. [18] Harrrison, A. & Hoek, R. V., (2011). Logistics Management and Strategy, 4th edn, Pearson [19] Holter, A. R., Grant, D. B., Ritchie, J. & Shaw, N., 2008. A framework for purchasing logistics services in small and medium size enterprises. International Journal of Physical Distribution & Logistics Management, 38(1), pp. 21-38. [20] Kothari, C. R. (2004). Research Methodology: Methods and Techniques (2nd Ed.). New Delhi:New Age International limited. [21] Krause, D. R., Scannell, T. V. & Calantone, R. J., (2007). A Structural Analysis of the Effectiveness of Buying Firms' Strategies to Improve Supplier Performance. Decision Sciences 31(1):33 - 55 [22] Krause, D.R., Handfield, R.B. & Tyler, B.B. (2007).The relationships between supplier development, commitment, social capital accumulation and performance improvement, Journal of Operations Management, 25(2), 528-545. [23] Krause, D.R., Handfield, R.B., & Tyler, B.B. (2007). The relationships between supplier development, commitment, social capital accumulation and performance improvement. Journal of Operations Management, 25, 528-545 [24] Krause, D.R., Scannell, T. V., & Calantone, R. J. (2000). A Structural Analysis of the Effectiveness of Buying Firms' Strategies to Improve Supplier Performance. Decision Sciences, 31(1), 33-55 [25] Krause, D.R., Scannell, T.V. & Calantone, R.J. (2000). A structural analysis of the effectiveness of buying firms’ strategies to improve supplier performance. Decision Sciences, 31, 33‐55. [26] Krause, D.R. & Scannell, T. (2002). Supplier development practices: product and servicebased industrycompa- risons. Journal of Supply Chain Management, 38(2), 13-21. [27] Krauth, E., Moonen, H., Popova, V. & Schut, M., (2005). Performance measurement and control in logistics service providing. In: C. S. Chen, J. Filipe, I. Seruca & J. Cordeiro, eds. Proceedings of Seventh international conference on enterprise information systems. s.l.:ICEIS, pp. 239-247. [28] Kumar, S., & Bragg, R. (2003).Managing Supplier Relationships. Quality Progress,36(9), 24-30. [29] Mugenda, O. M & Mugenda, A.G. (2003). Research method: Qualitative and Quantitative approaches. Nairobi African centre for technology studies [30] Niraj, R., Gupta, M., & Narasimham, C. (2001).Customer profitability in a supply chain. Journal of marketing 65(3),1–16. [31] Orodho A. J. (2004). Techniques of writing Research proposals and report in Education and Social Science. Nairobi: Masola publishers, Reata Prince. [32] Parkash, S. & Kaushik, V. K., (2011). Simple, Cost Effective & Result Oriented Framework for Supplier Performance Measurement in Sports Goods Manufacturing Industry. Scientific Journal of Logistics. ISSN 1734- 459X. Vol. 7 Issue 3 No 2
  • 15. ISSN 2349-7807 International Journal of Recent Research in Commerce Economics and Management (IJRRCEM) Vol. 3, Issue 3, pp: (70-84), Month: July - September 2016, Available at: www.paperpublications.org Page | 84 Paper Publications [33] Petersen, K.J., Handfield, R. & Ragatz, G. (2005). Supplier Integration into New Product Development: Coordinating Product, Process and Supply Chain Design. Journal of Operations Management, 23(3-4), 371-388. [34] Sanderson, J., Lonsdale, C., Mannion, R., and Matharu, T., (2015). Towards a framework for enhancing procurement and supply chain management practice in the NHS: lessons for managers and clinicians from a synproject of the theoretical and empirical literature. National Institute for Health Services and Delivery Research. Volume 3 Issue 18 April 2015; ISSN 2050-4349 [35] Sarkar, A. & Mohapatra, P. K., (2006). Evaluation of supplier capability and performance: A method for supply base reduction. Journal of Purchasing & Supply Management, Volume 12, pp. 148-163. [36] Schmitz, J. & Platts, K. W., (2004). Supplier logistics performance measurement: Indications from a study in the automotive industry. International Journal of Production Economics, 89(2), pp. 231-243. [37] Sheppard, J.M., Young, W.B., Doyle, T.L., Sheppard, T.A., and Newton, R.U., (2006). An evaluation of a new test of reactive agility and its relationship to sprint speed and change of direction speed, Journal of Science and Medicine in Sport 9, no. 4: 342-9. [38] Simpson, P. M., Siguaw, J. A. & White, S. C., (2002) Measuring the Performance of Suppliers: An Analysis of Evaluation Processes. The Journal of Supply Chain Management, 38(1), pp. 29-41. [39] Skjøtt-Larsen, T., Schary, P. B., Mikkola, J. H. & Kotzab, H., 2007. Managing the global supply chain. 3rd ed. Gylling: Copenhagen Business School Press. [40] Talluri, S. & Sarkis, J., 2002. A model for performance monitoring of supplier.International Journal of Production Research, 40(16), pp. 4257-4269. [41] Van der Valk, W. & Rozemeijer, F., (2009) Buying business services: towards a structured service purchasing process. Journal of Services Marketing, 23(1), pp. 3-10. [42] Van Laarhoven, P., Berglund, M. & Peters, M., (2000) Third-party logistics in Europe. International Journal of Physical Distribution & Logistics Management, 30(5), pp. 425-442. [43] Van Veele , A. J., (2005) Purchasing & Supply Chain Management: Analysis, Planning, Strategy and Practice. 4th ed. Croatia: Thomson Learning. [44] Van Weele, A. J., (2010) Purchasing and Supply Chain Management. 5th ed. Hampshire: Cengage Learning EMEA. [45] Wagner, S. M. (2006). Supplier development practices: an exploratory study, European journal of marketing,40(5), 554-571. [46] Yen, Yu-Xiang, Wang E. Shih-Tse & Horng Der-Juinn (2011). Suppliers’ Willingness of Customization, Effective Communication, and Trust: A Study of Switching Cost Antecedents. Journal of Business & Industrial Marketing. Emerald Group Publishing Limited 250–259 [ISSN 0885-8624]