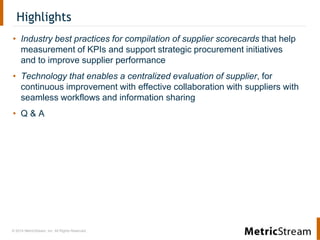
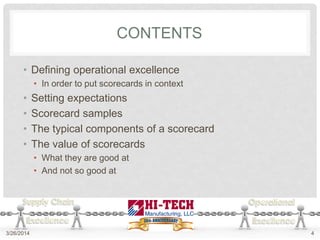
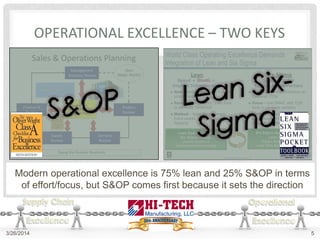
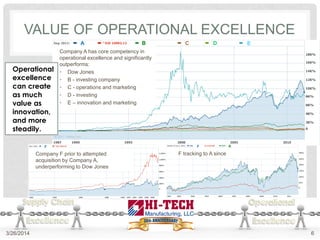
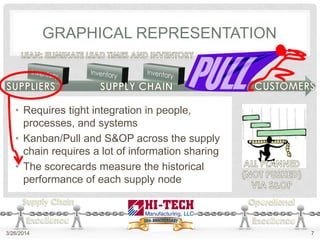
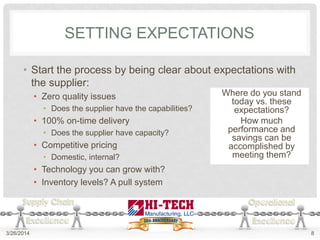
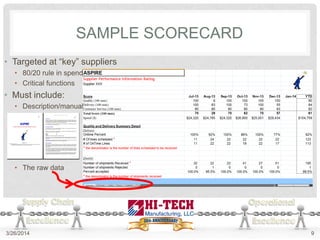
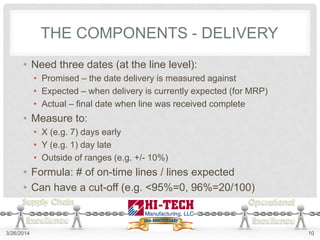
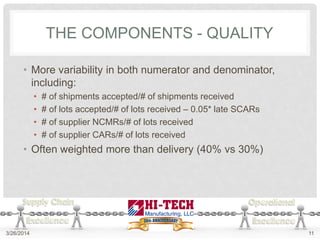
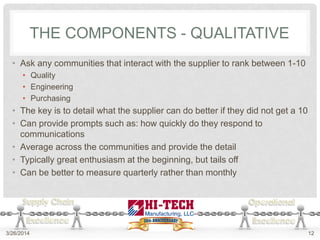
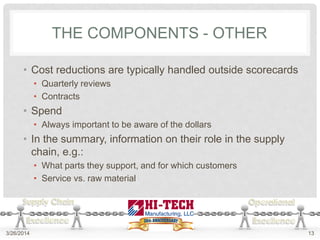
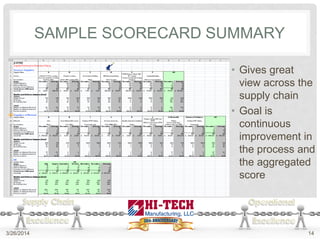
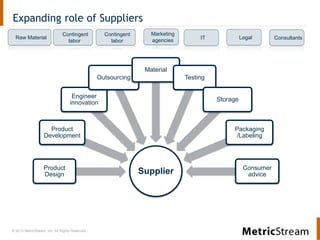
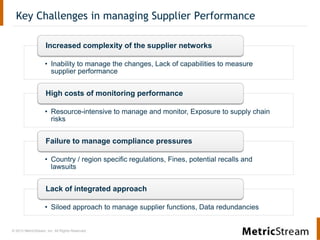
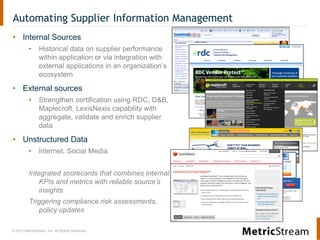
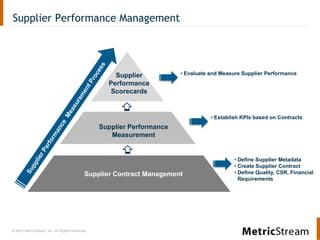
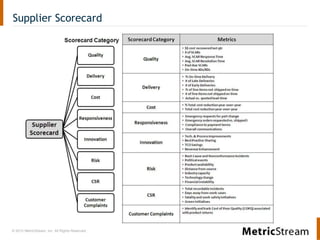
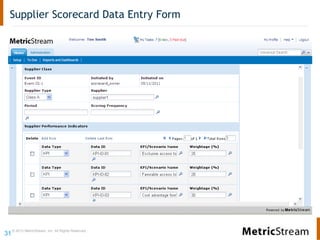
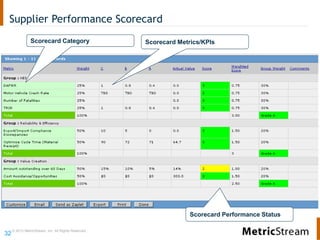
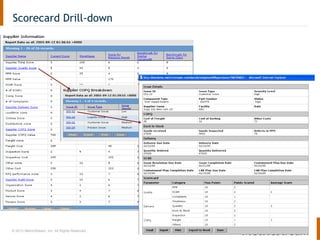
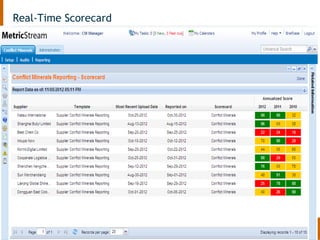
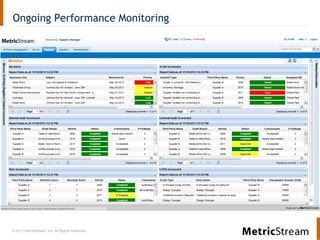
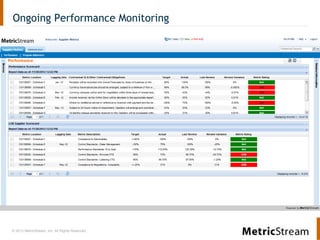
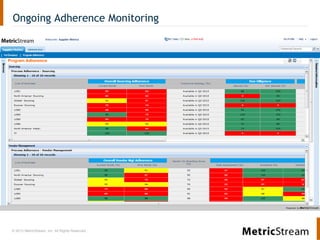
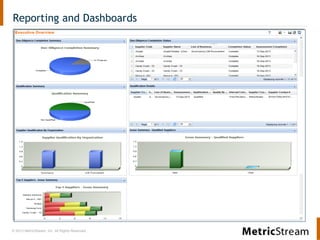
- The document discusses managing supplier performance through scorecards and key performance indicators (KPIs). It provides examples of typical scorecard components like delivery, quality, and qualitative measures.
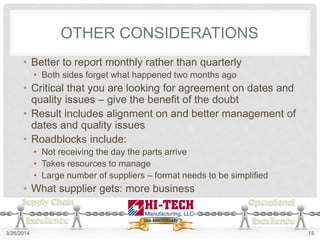
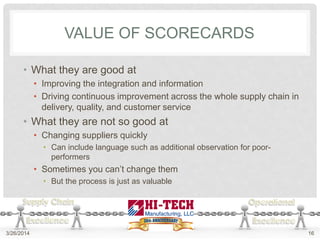
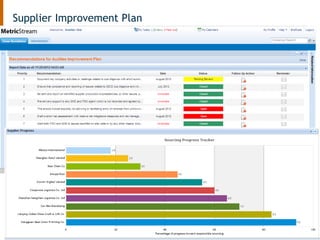
- Scorecards aim to drive continuous improvement across the supply chain through monitoring KPIs. While good for transparency and improvement, scorecards have limits in quickly replacing underperforming suppliers.
- The discussion includes questions from the audience about supplier performance management technology.