SlideShare a Scribd company logo
1 of 8
Download to read offline
Procedia - Social and Behavioral Sciences 226 (2016) 176 – 183
Available online at www.sciencedirect.com
1877-0428 © 2016 The Authors. Published by Elsevier Ltd. This is an open access article under the CC BY-NC-ND license
(http://creativecommons.org/licenses/by-nc-nd/4.0/).
Peer-review under responsibility of the organizing committee of IPMA WC 2015.
doi:10.1016/j.sbspro.2016.06.177
ScienceDirect
29th World Congress International Project Management Association (IPMA) 2015, IPMA WC
2015, 28-30 September – 1 October 2015, Westin Playa Bonita, Panama
Successive cost estimation – successful budgeting of major projects
Ole Jonny Klakegga
*, Steen Lichtenbergb
a
Norwegian University of Science and Technology, 7491 Trondheim, Norway
b
Lichtenberg & Partners, Baneskellet 16, DK-2950, Vedbaek, Denmark
Abstract
Project Management and Cost Engineering have made tremendous advances but we still witness all too frequent severe budget
overruns and delays. A solution to this mega problem of budget overruns actually exists. Use of the Successive Principle has
demonstrated this during the later decennials. It has demonstrated in tough practice that it is possible to make accurate, unbiased
statistical prognoses of the factual project cost or other important key figures. The results reported here may be surprising, given
the well-known history of cost overrun. In Scandinavia these principles have been widely accepted by top management and
authorities. It has improved professional project management. A proper documentation is recently available in the form of two
independent datasets of major public projects. This documentation and the key principles are summarised in this paper.
© 2016 The Authors. Published by Elsevier Ltd.
Peer-review under responsibility of the organizing committee of IPMA WC 2015.
Keywords: Cost estimation; Estimation methodology; Major projects; Risk management; Scheduling
* Corresponding author. Tel.: +4773594740; fax: +4773597021.
E-mail address: ole.jonny.klakegg@ntnu.no
© 2016 The Authors. Published by Elsevier Ltd. This is an open access article under the CC BY-NC-ND license
(http://creativecommons.org/licenses/by-nc-nd/4.0/).
Peer-review under responsibility of the organizing committee of IPMA WC 2015.
177Ole Jonny Klakegg and Steen Lichtenberg / Procedia - Social and Behavioral Sciences 226 (2016) 176 – 183
1. Introduction
Project Management (PM) and Cost Engineering (CE) have made tremendous advances during many decades.
Nevertheless, we still witness all too frequent severe budget overruns and delays, especially among larger projects.
Many authors have documented this. This introduction does not grant room to give a complete overview of this
theme, but gives a brief overview as background for presenting successful recent results from Scandinavia.
Internationally the most referred source for claiming project cost overrun is the famous Standish Group (2004)
“Chaos report”. It shows depressing results in a large sample of ICT-projects, and this source is not alone in
claiming most projects go wrong. Other credible sources include Flyvbjerg, Holm & Buhl (2002, 2003). Their result
of a large analysis was that 90% of an international set of large projects had cost overruns, generally of a significant
size. They also found significant overestimations of project benefit. They further documented that no improvement
could be seen over many decades. This dataset is dominated by public megaprojects. Merrow (2011) documents that
the situation is not much better in private sector: 65-75% of industrial megaprojects fail on business targets. Based
on 318 industrial megaprojects his analysis indicates that there are seven recurring reasons for failure, among these
are cutting corners and spending too little time and effort in the front end. The projects in the analyses above are
generally large and complex. This makes the question of size interesting – does size matter? Odeck (2004) studied
this by analyzing a complete sample of all public road projects in Norway for a 3 year period (1992-1995) – a total
of 620 projects. His results indicate that small projects have even worse results than large projects – the cost overrun
was even more frequent and relatively larger in small projects. On the positive side, he also documented that the
total share of projects having cost overrun and the average size of overrun was less than indicated in international
studies. To summarize this; we know for a fact that historically projects have had a strong tendency for cost overrun
– large or small, private or public – and over time.
Similarly, the studies on cost overrun also look for reasons behind the cost overrun (and corresponding benefit
underperformance). Flyvbjerg et al. (2002, 2003) argues that a main problem is that planners and promoters often
deliberately underestimate costs and risks and overestimate the benefits in order to increase the likelihood that their
project gets approval and funding. This view is supported by other studies as well – there are political or strategic
reasons for cost overrun. Similar reasons are identified by Merrow (2011) in business projects, and in addition he
point to inadequate cost estimation and risk assessments. We know that there are strategic and tactical reasons for
projects to experience cost overrun and benefits underperformance. These reasons need to be understood and
handled well to improve PM performance.
Another set of reasons for cost overrun are known to stem from human judgment, as documented by Kahneman
& Tversky (1979) and later excellently explained by Kahneman (2011). Lange (1985) disclosed this reason in a
master’s thesis: Subjective expert evaluations are typically biased by several psychological pitfalls. A well-known
scientific paradigm is typical for engineering culture; to focus only upon documentary matters, and avoid dealing
with subjective, non-documentary matters. Consequently, subjective matters were considered only superficial if at
all included. Despite scientific methods for cost estimation did exist, a still larger part of a budget or schedule rested
upon subjective expert evaluations. Inspired by this observation Lange identified from psychological literature more
than 20 pitfalls when making such quantitative evaluations. This was an eye-opener in Scandinavia and initiated a
different way of thinking about how cost estimation should be done in practice.
Traditional tools and techniques for project planning and management were based on deterministic logic,
although leading scholars early realized this was not sufficient. When theory tried to cope with uncertainty in these
traditional methods, it became very complicated. The tools became increasingly challenging, especially for small
organizations. Uncertainty was seen as almost impossible to handle, while using the classical statistical theories
towards planning and estimating the fuzzy future. The existing procedures were either too primitive or too difficult
to operate. This realization sparked a development in Denmark in the early 1970’s that initiated the story reported in
the next section of this paper.
2. Untraditional research efforts during the 70s and 80s
Successful results in scheduling during the 1960s came from the use of the Program Evaluation Review
Technique, PERT, one of the well-known Critical Path Methods. It introduced the triple estimate to measure
178 Ole Jonny Klakegg and Steen Lichtenberg / Procedia - Social and Behavioral Sciences 226 (2016) 176 – 183
uncertain data. Provoked by the many project budget overruns, the idea of using similar logic was introduced in the
1970s towards cost estimates. It was a research effort aiming more realistic project estimates, led by the second
author of this paper at the Technical University of Denmark, DTU.
The research soon met the difficulties of operative handling the uncertainty. It was complex as a bunch of keys
including numeral statistical dependencies. This problem was solved by isolating and defining all significant
dependencies among the individual cost items into contingency items. In this manner, all items are largely
statistically independent of each other. Another problem was to cope with the huge amount of data, and their
uncertainty. This was solved while using a consistent top - down principle. The estimate procedure starts with a set
of 8 to 12 physical main items covering the whole scope, and a similar number of contingency items. The estimators
evaluate triple estimates of each of these. The total cost is calculated while using normal statistical rules. The
specific effect from each uncertain item upon the total uncertainty is established as a “top ten list”.
The most uncertain local item at the top of the list by nature is the most critical for the total result. This element is
therefore subject to further clarification. The calculation is then updated and a new top ten list appears. The
procedure continues after this first step with further successive steps (re: the term “Successive Principle” or “the
Stepwise Method”) as long as the total uncertainty is reduced sufficiently. Surprisingly soon all major local
uncertainties has been clarified as much as possible. The end result - due to the 20/80 rule - will typically hold only
less than a hundred items and factors, often down to 30-40.
A prototype of the procedure was launched locally in Denmark during the 1970s and published by Lichtenberg
(1971, 1974). Its obvious advances made it soon widespread locally in Denmark. However, it suffered from severe
failures due to the many pitfalls when estimators make subjective evaluations. The results suffered from this and the
use after some time gradually faded out in Denmark. During the 1980s, this severe problem was solved. Nils Lange
(1985) sparked new development, when he identified more than 20 relevant psychological pitfalls from a study of
international psychological literature. Spetzler & Staël von Holstein (1975) and Tversky & Kahneman (1983)
among others. He also made some advices on how to bypass them.
The further development effort took place in an untraditional tight binational cooperation between researchers
from Statistical theory, Psychology and Engineering Economy. It was based at the Technical Universities of
Denmark respectively Norway, led by the second author and the late professor Reidar Hugsted and his team,
respectively. This was soon supplied with the Norwegian professor of psychology, Karl Halvor Teigen (Brun &
Teigen, 1988; Teigen, 1988). With Norway as the leading partner, this final research largely solved the remaining
problems before the end of the 1980s. The resulting procedure is further developed in section 3.
3. The resulting new procedure
In 1990 the research effort resulted in a procedure, which proved most successful (Klakegg, 1993; Lichtenberg,
2000). Its immediate primary applications were as a quality tool towards budget and schedules of larger projects.
Besides being able to forecast surprisingly accurate future final results, it identified and ranked the major
optimization options. It has been used to augment the productivity considerably and is summarized as follows.
The central part is a workshop of typically two full days. It has to be prepared and guided by a facilitator. He/she
should have a profound knowledge of the procedure and not least the evaluation techniques and its biases. A
workshop group is established of 7 - 15 experts and generalists; competent and with a broad and balanced
composition. The ensuing group sessions make full use of the participant’s pooled expertise, experience, intuition
and group synergy. In short, the full range of the brainpower of the assembled participants. The composition will
help moderate some of the evaluation biases. At least one of the participants should be from outside the project, if
possible outside the company, or in other ways be able to function as "the devil's advocate” in order to balance any
over-optimism. The physical conditions should be well prepared, and the culture needs to support an open attitude
among the participants.
After having reached agreement as to its point of departure, its goal and the specific analysis procedure, a
qualitative brainstorming process follows, allowing the group first to identify - spontaneously and without any ”no-
go areas” - all possible overall uncertain issues. These are then grouped to a smaller number (8 to 12) of discrete and
mutually independent main groups of contingencies. For each main group a basic, historical oriented and normalized
179Ole Jonny Klakegg and Steen Lichtenberg / Procedia - Social and Behavioral Sciences 226 (2016) 176 – 183
precondition is defined for use in the following quantification of the physical items. Another definition for each
main group of contingencies describes the actual expected future situation of the case project. This latter is used
during the following quantification process of the contingency items. Any “either/or” risks of catastrophes, accidents
or the like are set aside for a separate risk analysis. Initially merely 10 - 15 physical main items are used to cover the
total cost, normally based upon a conventional estimating procedure. To this structure, we add a series of
contingency items, namely the above defined 8 - 12 overall groups of contingency issues.
To assure the workshop group makes correct subjective judgments of the cost in the subsequent quantitative
analysis, use the following estimating procedure, called the Group Triple Estimate or GTE procedure. It is
documented to be able to largely compensate for the many evaluation pitfalls if “the rules of the game” are carefully
followed. These set of rules are thoroughly described in Lichtenberg (2000). Only the main aspects are described
here:
Before the quantification, the workshop group will briefly discuss the subject matter, particularly the scope and
defined preconditions of each item, but strictly without mentioning any figures. Then, in complete silence, all
participants concentrate and find their own intuitive personal triple estimates and write them down. Conferring is not
permitted in this phase.
A triple estimate consists of an extreme low and an extreme high value followed by a “most likely” value. In the
following quantification process, one triple estimate is made for each of the physical main items based on the
historical base preconditions, and for each of the supplementary contingency items. The latter quantification is based
upon the difference between the base precondition and the definition of the perceived actual situation. The extreme
values are evaluated before the most likely ones to avoid one of the biases. Using the most extreme values among all
participants compensate for a serious pitfall of underestimating the low and high values. The statistical calculations
of the first result are completed without contravening the natural laws of uncertainty (the Bayesian statistical
theory). Due to the established mutual independency, these calculations are both fairy simple and correct. The total
result is calculated. It can be done manually, but to save time it is normally fed into a computer with one of the
available software applications (see www.futuraone.com for more information).
The top level result of these initial calculations identifies a ”top ten list” of the largest local sources of uncertainty
from both the physical items and the contingency items. Those at the top of the top ten list - being the most critical
ones - are further specified into independent sub items if possible. If this is not possible, the participants seeks to
“bring on the table” supplementary relevant information to clarify the situation. The relevant sub items or the
original item is re-evaluated while using the GTE procedure again.
A re-calculation follows and an updated top ten list appears besides the total mean and standard deviation. The
previous clarification step is repeated successively until the total result is sufficiently stable. The well-known “20-80
rule” comes emphatically into effect here and therefore only relatively few steps are typically required before all the
predominant sources of uncertainty have been addressed and clarified as much as possible. At this point of time, the
participants are well equipped to suggest action plans for further optimization. Used as a management tool, this
helps the project manager develop his PM strategy and optimize the situation.
A number of specific variants of this procedure have been developed for a range of practical applications: Cost
estimates, Schedule analyses, Benefit/Cost analyses, as well as for project optimization, obtaining consensus and
team building. Examples are given in Klakegg (1993), Lichtenberg (2000), Samset & Volden (2013), Statens
vegvesen (2014), Schrøder & Lichtenberg (2013), and www.lichtenberg.org.
Schedules are basically analyzed according to the same procedure, but instead of a cost break down structure, a
top level critical path network is used as a basis. It consists of 10 - 14 main activities or groups of activities. To this
basic network, “contingency activities” are added at relevant places in the network plus one or several ones as end
activities. They cover contingencies, which affect the plan as a whole. The first qualitative part of the procedure runs
exactly as described above. The quantitative process uses the GTE procedure. The duration of all physical activities
are evaluated under condition of the basic preconditions, as described above, while the duration of the contingency
activities are evaluated according to the difference between the basic preconditions and the actual description of the
specific situation. The following network calculations will normally be based on Monte Carlo simulations. Using the
same Top-down procedure as above, any specification has the form of a sub net.
180 Ole Jonny Klakegg and Steen Lichtenberg / Procedia - Social and Behavioral Sciences 226 (2016) 176 – 183
4. Documentation and experience
The Successive Principle has been used internationally (www.futuraone.com) since 1990. However, first of all in
Scandinavia (www.lichtenbeg.org) in most public and private spheres and for many different purposes (Archibald &
Lichtenberg, 1992). Most intensively it is implemented in Norway (www.concept.ntnu.no), as documented in Aass,
Jermstad, Aanes Johansen & Klakegg (2010) and Samset & Volden (2013).
During three decades, up to a thousand of projects have been analyzed while using these principles with
successful results. However, it has been hard to believe that it is actually possible to get full control over the budget
and schedules of large projects. Therefore many previous examples of successful results have generally been
explained as pure luck, perfect project management or the like. However, this capability to fully control the project
outcome is for the first time recently properly documented from two independent series of large projects,
summarized below.
4.1. Norwegian major public projects since year 2000
A governmental commission in 1999 evaluated the current practice in many governmental bodies. As a result, the
commission suggested a budget quality audit based on these new principles (Berg, 1999). Since 2000 budget quality
audits based on the Successive Principle has been obligatory for all large-scale Norwegian public-sector investment
projects before final decision to finance and execute. The ambition was that from now on 80 % of the projects
should keep to budget. Any higher ambition than 80 % was assumed too costly. By 2013, 40 of these projects of all
categories were completed. An official report (Samset & Volden, 2013) published the result so far. The report shows
that exactly 80 %, namely 32 of the 40 projects, kept to budget (see Figure 1a).
4.2. Danish large road projects 2002-2007
Over the period 2002 – 2007, the final costs of all large-scale Danish highway projects were estimated using the
Successive Principle. By 2013 a significant number of projects were finished, and it was possible to compare the
prognoses with the actual final costs for 40 of these analyses. The result is illustrated in figure 1b.
The vertical scale indicates the number of projects, while the horizontal scale shows the difference between
prognosticated mean value and the actual costs in proportion to the standard deviation. The overall result was well in
agreement with both the mean values and the calculated uncertainty. However, the actual final costs were
approximately seven percent lower than the calculated mean figure on average. Similarly, the actual spread was
slightly below the calculated uncertainty. A likely reason is the fact that the project managers have capitalized on the
potential optimization possibilities identified by the analyses. The reduced final costs as well as the slightly reduced
Figure 1a Norwegian results from 40 major public
investment projects (Samset & Volden, 2013)
Figure 1b Danish results from 40 road projects. The
prognoses are blue, and the factual results are red
(Schrøder & Lichtenberg, 2014)
181Ole Jonny Klakegg and Steen Lichtenberg / Procedia - Social and Behavioral Sciences 226 (2016) 176 – 183
uncertainty are most likely a result of their subsequent action plans. More detailed results so far only appear in the
Danish language at www.lichtenberg.org.These results document that by now there is good control with the cost of
large infrastructure projects in Norway and road projects in Denmark from the GO/NO GO decision is made and
until the projects are delivered.
5. Discussion on theory and practice
Typical feedback used to be surprise at how close the prognoses are to the actual results, which are subsequently
achieved. This was most obvious in cases of project schedules. Today it is accepted as expected when large projects
actually meet cost and time in Norway, Sweden, and to lesser degree in Denmark. However, any untraditional
research which integrates different fields like Statistical theory, Psychology and Engineering Economy holds
weaknesses, limitations and unsolved questions.
Important benefits and solutions have materialized during the later decades of practical applications. The obvious
strength lies partly in that unpleasant surprises now with great certainty can be significantly reduced and partly in
the new opportunities for project efficiency and increased teamwork that this method helps uncover. Questions are
asked before instead of after the fact. The weaknesses and limitations lie in having to comply with "the rules of the
game" – some of them untraditional and for some participants provoking. It can for example only be useful in
organizations with a modern management attitude, and a policy of internal openness. It requires courage and
genuine will to meet the ‘naked truth’ of the task, whether it concerns schedules, budget proposals, financial
analyses etc.
It is a challenge in busy workdays to set up a sufficiently broad-based analysis group of key persons. Given the
innovative character of the Successive Principle and the weight given to both qualitative and quantitative evaluation
process, a considerable and demanding “running-in” period is needed, with the full, unequivocal backing of senior
management. Even if this is obtainable; the process must be steered by a facilitator who has a good grasp of group
dynamics, statistics and the use of the Successive Principle. They may be hard to find.
A typical observed weakness is to compromise with a less relevant analysis group and accept of unprepared
attendance. Even more serious is to focus solely on the physical items without sufficient regard to the overall
general effects from the project environment, management, client, the current project situation, future development
etc. Another typical weakness lies in handling the triple estimates correctly in the group. Unfortunately it is often
seen that the well-documented significant underestimation of the max and min values is not properly compensated
by using the most extreme values in the whole analysis group.
The new principles have already been used in a broad field of applications. However some applications are so far
at the experimental stage or even merely a potential. The use has shown considerable augments of the productivity.
So far, this has been seen as a side effect. Improvement of the productivity as a primary goal of an analysis does still
need further development and tests. The same is the case with quality reviews of Life Cycle Analyses as well as the
use as proper risk analysis. Improvement of the accuracy of economical prognoses is just a potential application so
far, however a most promising one.
A large portfolio of public and private companies in Scandinavia and beyond consistently testifies to the benefits
of using the Successive Principle. Many users liken the Successive Principle to a pair of “future- glasses” or to an
“ultra-sound scan” of plans, estimates, budgets, etc. This is partly because of the specific and realistic picture of how
matters will progress in terms of the budget or schedule and partly because of the ranked list of the most important
external and internal sources of uncertainty. These consist of specific threat factors, hidden opportunities or simply
grounds for uncertainty. The value of this list lies in allowing the client to take timely preventive or protective action
against threats and to make the most of the positive opportunities in order to improve competitiveness, or simply to
achieve greater efficiency. Control and optimization of major project schedules has been a particularly successful
sphere of application. It has often been possible to accelerate timely.
Johansen, Sandvin, Torp & Økland (2014) observes 5 challenges with today’s practice that still needs more
attention in current Norwegian practice: 1) expressing the real uncertainty in very early phases of a project, 2) avoid
digging too deep in details, 3) getting the standard deviation right (expressing the realistic uncertainty) in all phases
of the project, 4) handling the human error and team effects (heuristics and group think) and understanding their
effects, 5) avoid neglecting opportunities during the risk- and uncertainty analysis (we seem to have a blind spot for
182 Ole Jonny Klakegg and Steen Lichtenberg / Procedia - Social and Behavioral Sciences 226 (2016) 176 – 183
opportunities). The Successive Principle addresses all these challenges, but even more improvements in practice are
called for. We applaud such initiatives and suggest one specific improvement in the concluding part.
The potential is huge, but it does not come for free. Significant investment in education of key individuals and
training of facilitators is needed. So too is the development and implementation of organizational procedures to
support and utilize the method.
6. Conclusion and the way forward
Project Management and Cost Engineering have made tremendous advances during many decades. Still we know
that projects are often delivered too late and with severe cost overrun. This paper describes the development and
result of a new method that challenges traditional ways of thinking about project planning and cost estimation. The
results have been promising since the introduction in the 90’s but often explained away by referring to luck or other
situational factors. Then finally in 2013 and 2014 came credible documentation that confirmed there is more than
coincidence behind these results. The results are presented above: Good control with the cost of large infrastructure
projects is established in Norway and Denmark using the Successive Principle.
This documentation confirms we have come a long way, but still there are challenges for future development.
Klakegg, Torp & Austeng (2010) observed that there are several challenges in making the analyses, methods and
tools easy enough to give practical support to those that need it on one hand, and the ideal precision and advanced
user interface on the other hand. There are real dilemmas in this development. Maybe there is no such thing as a
perfect solution to this dilemma.
One problem has the Successive Principle not yet solved. It is the remaining issue of cost escalation of large
projects from the first idea and up to the point in time where the GO/NO GO decision is made. The Successive
Principle is the best available method for estimating the cost from an inside view position. However, current practice
shows that we need to strengthen even more the work in the earliest phases. Flyvbjerg (2006) suggests adding the
outside view through Reference class forecasting. We believe this is a useful way of strengthening the earliest cost
estimates. These two methods together form a complete toolset to secure realistic cost estimates even in a very early
phase of development. However, more research and practical implementation is needed. The first attempts to use the
outside view were introduced in Norway as part of external quality assurance, but complete reference class
forecasting is not implemented yet. The authors will follow this development with excitement.
References
Aass, T., Jermstad, O., Aanes Johansen, K. & Klakegg, O. J. (2010). Governance of Norwegian Government Projects. Paper, International Project
Management Association, IPMA World Congress 2010, Istanbul.
Archibald, R. D. & Lichtenberg, S. (1992). Experiences using Next Generation Management Practices, Keynote paper, Proceedings IPMA World
Congress 1992, Florence, Italy, June 1992.
Berg, P. (ed.) (1999). Styring av statlige investeringer (Controlling Governmental Investments), Norwegian Ministry of Finance, Oslo (in
Norwegian).
Brun, W. & Teigen K. H. (1988). Verbal probabilities: Ambiguous, context-dependent, or both? Organizational Behaviour and Human Decision
Processes, 41, 390 – 404.
Flyvbjerg, B., Holm, M. S. & Buhl, S. (2002). Underestimating Costs in Public Works Projects: Error or Lie?. Journal of the American Planning
Association, 68, 279-295.
Flyvbjerg, B., Holm, M. S. & Buhl, S. (2003) How common and how large are cost overruns in transport infrastructure projects?, Transport
Reviews, 23, 71-88.
Flyvbjerg, B. (2006). Curbing Optimism Bias and Strategic Misrepresentation in Planning: Reference Class Forecasting in Practice”, European
Planning Studies, 16, 3-21.
Johansen, A., Sandvin, B., Torp, O. & Økland, A. (2014) Uncertainty analysis – 5 challenges with today’s practice. Procedia – Social and
Behavioral Sciences, 119, 591-600.
Kahneman, D. & Tversky, A. (1979). Prospect Theory: An Analysis of Decision Under Risk. Econometrica, 47, 263–291.
Kahneman, D. (2011). Thinking, Fast and Slow. UK, London: Penguin books.
Klakegg, O. J. (1993). Trinnvis-prosessen (the handbook on the Stepwise Procedure). Handbook. NTH Technical University of Norway (in
Norwegian).
Klakegg, O. J.,Torp, O. & Austeng, K. (2010). Good and Simple: A dilemma in Analytical Processes? International Journal of Managing
Projects in Business, 3, 402-421.
183Ole Jonny Klakegg and Steen Lichtenberg / Procedia - Social and Behavioral Sciences 226 (2016) 176 – 183
Lange, N. (1985) Sikker vurdering af usikkerhed (Accurate evaluation of uncertainty) Ms.Thesis, Technical University of Denmark, DTU (in
Danish and not published). A summary appears in Lichtenberg. S. (2000), see p.132 ff.).
Lichtenberg, S. (1971). Successiv Kalkulation (Successive Estimating), Research report, Technical University of Denmark (in Danish, not
published).
Lichtenberg, S. (1974). The Successive Principle, Proceedings, PMI International Symposium, Washington, DC, 570-578.
Lichtenberg, S. (2000). Proactive management of uncertainty - using the Successive Principle, Handbook, published by the author, 345 p.
Merrow, E. W. (2011) Industrial megaprojects. Concepts, Strategies and Practices for Success. John Wiley and sons, Hoboken, New Jersey.
Odeck, J. (2004) Cost overruns in road construction – what are their sizes and determinants? Transport Policy, 11, 43–53.
Samset, K. & Volden, G.H. (2013). Investing for Impact. Lessons with the Norwegian State Project Model and the first investment projects that
have been subject to external quality assurance. Concept report no. 36. Available at www.ntnu.no/concept/
Schrøder, A. & Lichtenberg, S. (2014) Sikker budgetkontrol efter Successiv Princippet. [Budget control according to the Successive Principle] (in
Danish) Available at http://da.lichtenberg.org/nyheder-2014/vejprojekter
Standish Group (2004). CHAOS Report (Report). West Yarmouth, Massachusetts: Standish Group.
Spetzler, C. F. & Staël von Holstein, C., S. (1975). Probability encoding in decision analysis. Management Science, U.S.A. Nov.
Statens vegvesen (2014). Håndbok R764, Anslagmetoden (Handbook for the Stepwise Method). The Norwegian Public Road Authorities (Statens
vegvesen). Oslo. (in Norwegian). Available at http://www.vegvesen.no/Fag/Publikasjoner/Handboker
Teigen, K. H. (1988). The language of uncertainty, Acta Psychologica, 68, 1–3, , 27-38.
Tversky, A. & Kahneman, D. (1983). Judgement under Uncertainty: Heuristics and Biases. Hebrew University, Jerusalem.
www.futuraone.com/ Northern Europe group of consultants specialized in application of the Successive Principle.
www.lichtenberg.org/ Description of the principles, applications, and experiences of the Successive Principle.
www.ntnu.no/concept/ Research program at the Norwegian University of Science and Technology on optimizing large public projects.

More Related Content

Similar to Custo sucessivo

Berlin 6 Open Access Conference: John Houghton
Berlin 6 Open Access Conference: John HoughtonBerlin 6 Open Access Conference: John Houghton
Berlin 6 Open Access Conference: John HoughtonCornelius Puschmann
 
Successes, Failures, and the Road to 2030 - A Study of Emissions from the Nor...
Successes, Failures, and the Road to 2030 - A Study of Emissions from the Nor...Successes, Failures, and the Road to 2030 - A Study of Emissions from the Nor...
Successes, Failures, and the Road to 2030 - A Study of Emissions from the Nor...Rebecca L. H. Briedis
 
Technology supported requirement handling an estimation
Technology supported requirement handling an estimationTechnology supported requirement handling an estimation
Technology supported requirement handling an estimationKjetil Moløkken-Østvold
 
Chapter 23 Marketing Research Malhotra
Chapter 23 Marketing Research MalhotraChapter 23 Marketing Research Malhotra
Chapter 23 Marketing Research MalhotraAADITYA TANTIA
 
Houghton (Brussels 22 June 2009)
Houghton (Brussels  22 June 2009)Houghton (Brussels  22 June 2009)
Houghton (Brussels 22 June 2009)Knowledge Exchange
 
Do we measure functional size or do we count thomas fehlmann
Do we measure functional size or do we count   thomas fehlmannDo we measure functional size or do we count   thomas fehlmann
Do we measure functional size or do we count thomas fehlmannIWSM Mensura
 
Spreadsheet Engineering
Spreadsheet EngineeringSpreadsheet Engineering
Spreadsheet EngineeringJácome Cunha
 
A Triple Bottom Line Reporting Framework For Property Development Portfolios
A Triple Bottom Line Reporting Framework For Property Development PortfoliosA Triple Bottom Line Reporting Framework For Property Development Portfolios
A Triple Bottom Line Reporting Framework For Property Development PortfoliosTony Lisko
 
IRJET- Projects in Constructions due to Inadequate Risk Management
IRJET-  	  Projects in Constructions due to Inadequate Risk ManagementIRJET-  	  Projects in Constructions due to Inadequate Risk Management
IRJET- Projects in Constructions due to Inadequate Risk ManagementIRJET Journal
 
Open Source & Open Data Session report from imaGIne 2014 Conference
Open Source & Open Data Session report from imaGIne 2014 ConferenceOpen Source & Open Data Session report from imaGIne 2014 Conference
Open Source & Open Data Session report from imaGIne 2014 ConferenceGSDI Association
 
Problem in Budgeting - Master Uitm Shah Alam
Problem in Budgeting - Master Uitm Shah AlamProblem in Budgeting - Master Uitm Shah Alam
Problem in Budgeting - Master Uitm Shah AlamAna Muslims
 
Exploiting the Added Value of Climate Services - From Climate Service Concept...
Exploiting the Added Value of Climate Services - From Climate Service Concept...Exploiting the Added Value of Climate Services - From Climate Service Concept...
Exploiting the Added Value of Climate Services - From Climate Service Concept...Environmental Protection Agency, Ireland
 
Delay Analysis of Projects and Effects of Delays in the Mining/Manufacturing ...
Delay Analysis of Projects and Effects of Delays in the Mining/Manufacturing ...Delay Analysis of Projects and Effects of Delays in the Mining/Manufacturing ...
Delay Analysis of Projects and Effects of Delays in the Mining/Manufacturing ...iosrjce
 
Research Policy Monitoring in the Era of Open Science & Big Data Workshop Report
Research Policy Monitoring in the Era of Open Science & Big Data Workshop ReportResearch Policy Monitoring in the Era of Open Science & Big Data Workshop Report
Research Policy Monitoring in the Era of Open Science & Big Data Workshop ReportData4Impact
 
R&D and Innovation Statistics, challenges of interpretation
R&D and Innovation Statistics, challenges of interpretationR&D and Innovation Statistics, challenges of interpretation
R&D and Innovation Statistics, challenges of interpretationPer Koch
 
Qudos the phoenix project
Qudos   the phoenix projectQudos   the phoenix project
Qudos the phoenix projectDamian Tamburri
 

Similar to Custo sucessivo (20)

Berlin 6 Open Access Conference: John Houghton
Berlin 6 Open Access Conference: John HoughtonBerlin 6 Open Access Conference: John Houghton
Berlin 6 Open Access Conference: John Houghton
 
Ima g ine2014_8c1report
Ima g ine2014_8c1reportIma g ine2014_8c1report
Ima g ine2014_8c1report
 
Successes, Failures, and the Road to 2030 - A Study of Emissions from the Nor...
Successes, Failures, and the Road to 2030 - A Study of Emissions from the Nor...Successes, Failures, and the Road to 2030 - A Study of Emissions from the Nor...
Successes, Failures, and the Road to 2030 - A Study of Emissions from the Nor...
 
Technology supported requirement handling an estimation
Technology supported requirement handling an estimationTechnology supported requirement handling an estimation
Technology supported requirement handling an estimation
 
Chapter 23 Marketing Research Malhotra
Chapter 23 Marketing Research MalhotraChapter 23 Marketing Research Malhotra
Chapter 23 Marketing Research Malhotra
 
Houghton (Brussels 22 June 2009)
Houghton (Brussels  22 June 2009)Houghton (Brussels  22 June 2009)
Houghton (Brussels 22 June 2009)
 
Do we measure functional size or do we count thomas fehlmann
Do we measure functional size or do we count   thomas fehlmannDo we measure functional size or do we count   thomas fehlmann
Do we measure functional size or do we count thomas fehlmann
 
Spreadsheet Engineering
Spreadsheet EngineeringSpreadsheet Engineering
Spreadsheet Engineering
 
A Triple Bottom Line Reporting Framework For Property Development Portfolios
A Triple Bottom Line Reporting Framework For Property Development PortfoliosA Triple Bottom Line Reporting Framework For Property Development Portfolios
A Triple Bottom Line Reporting Framework For Property Development Portfolios
 
IRJET- Projects in Constructions due to Inadequate Risk Management
IRJET-  	  Projects in Constructions due to Inadequate Risk ManagementIRJET-  	  Projects in Constructions due to Inadequate Risk Management
IRJET- Projects in Constructions due to Inadequate Risk Management
 
Open Source & Open Data Session report from imaGIne 2014 Conference
Open Source & Open Data Session report from imaGIne 2014 ConferenceOpen Source & Open Data Session report from imaGIne 2014 Conference
Open Source & Open Data Session report from imaGIne 2014 Conference
 
Problem in Budgeting - Master Uitm Shah Alam
Problem in Budgeting - Master Uitm Shah AlamProblem in Budgeting - Master Uitm Shah Alam
Problem in Budgeting - Master Uitm Shah Alam
 
Exploiting the Added Value of Climate Services - From Climate Service Concept...
Exploiting the Added Value of Climate Services - From Climate Service Concept...Exploiting the Added Value of Climate Services - From Climate Service Concept...
Exploiting the Added Value of Climate Services - From Climate Service Concept...
 
Delay Analysis of Projects and Effects of Delays in the Mining/Manufacturing ...
Delay Analysis of Projects and Effects of Delays in the Mining/Manufacturing ...Delay Analysis of Projects and Effects of Delays in the Mining/Manufacturing ...
Delay Analysis of Projects and Effects of Delays in the Mining/Manufacturing ...
 
I012646171
I012646171I012646171
I012646171
 
I012646171
I012646171I012646171
I012646171
 
Research Policy Monitoring in the Era of Open Science & Big Data Workshop Report
Research Policy Monitoring in the Era of Open Science & Big Data Workshop ReportResearch Policy Monitoring in the Era of Open Science & Big Data Workshop Report
Research Policy Monitoring in the Era of Open Science & Big Data Workshop Report
 
Projectification of economy in a smaller country: A case from Croatia
Projectification of economy in a smaller country: A case from CroatiaProjectification of economy in a smaller country: A case from Croatia
Projectification of economy in a smaller country: A case from Croatia
 
R&D and Innovation Statistics, challenges of interpretation
R&D and Innovation Statistics, challenges of interpretationR&D and Innovation Statistics, challenges of interpretation
R&D and Innovation Statistics, challenges of interpretation
 
Qudos the phoenix project
Qudos   the phoenix projectQudos   the phoenix project
Qudos the phoenix project
 

Recently uploaded

Internship report on mechanical engineering
Internship report on mechanical engineeringInternship report on mechanical engineering
Internship report on mechanical engineeringmalavadedarshan25
 
IVE Industry Focused Event - Defence Sector 2024
IVE Industry Focused Event - Defence Sector 2024IVE Industry Focused Event - Defence Sector 2024
IVE Industry Focused Event - Defence Sector 2024Mark Billinghurst
 
Electronically Controlled suspensions system .pdf
Electronically Controlled suspensions system .pdfElectronically Controlled suspensions system .pdf
Electronically Controlled suspensions system .pdfme23b1001
 
OSVC_Meta-Data based Simulation Automation to overcome Verification Challenge...
OSVC_Meta-Data based Simulation Automation to overcome Verification Challenge...OSVC_Meta-Data based Simulation Automation to overcome Verification Challenge...
OSVC_Meta-Data based Simulation Automation to overcome Verification Challenge...Soham Mondal
 
Oxy acetylene welding presentation note.
Oxy acetylene welding presentation note.Oxy acetylene welding presentation note.
Oxy acetylene welding presentation note.eptoze12
 
CCS355 Neural Network & Deep Learning UNIT III notes and Question bank .pdf
CCS355 Neural Network & Deep Learning UNIT III notes and Question bank .pdfCCS355 Neural Network & Deep Learning UNIT III notes and Question bank .pdf
CCS355 Neural Network & Deep Learning UNIT III notes and Question bank .pdfAsst.prof M.Gokilavani
 
Microscopic Analysis of Ceramic Materials.pptx
Microscopic Analysis of Ceramic Materials.pptxMicroscopic Analysis of Ceramic Materials.pptx
Microscopic Analysis of Ceramic Materials.pptxpurnimasatapathy1234
 
CCS355 Neural Network & Deep Learning Unit II Notes with Question bank .pdf
CCS355 Neural Network & Deep Learning Unit II Notes with Question bank .pdfCCS355 Neural Network & Deep Learning Unit II Notes with Question bank .pdf
CCS355 Neural Network & Deep Learning Unit II Notes with Question bank .pdfAsst.prof M.Gokilavani
 
APPLICATIONS-AC/DC DRIVES-OPERATING CHARACTERISTICS
APPLICATIONS-AC/DC DRIVES-OPERATING CHARACTERISTICSAPPLICATIONS-AC/DC DRIVES-OPERATING CHARACTERISTICS
APPLICATIONS-AC/DC DRIVES-OPERATING CHARACTERISTICSKurinjimalarL3
 
Architect Hassan Khalil Portfolio for 2024
Architect Hassan Khalil Portfolio for 2024Architect Hassan Khalil Portfolio for 2024
Architect Hassan Khalil Portfolio for 2024hassan khalil
 
Artificial-Intelligence-in-Electronics (K).pptx
Artificial-Intelligence-in-Electronics (K).pptxArtificial-Intelligence-in-Electronics (K).pptx
Artificial-Intelligence-in-Electronics (K).pptxbritheesh05
 
VIP Call Girls Service Hitech City Hyderabad Call +91-8250192130
VIP Call Girls Service Hitech City Hyderabad Call +91-8250192130VIP Call Girls Service Hitech City Hyderabad Call +91-8250192130
VIP Call Girls Service Hitech City Hyderabad Call +91-8250192130Suhani Kapoor
 
main PPT.pptx of girls hostel security using rfid
main PPT.pptx of girls hostel security using rfidmain PPT.pptx of girls hostel security using rfid
main PPT.pptx of girls hostel security using rfidNikhilNagaraju
 
Past, Present and Future of Generative AI
Past, Present and Future of Generative AIPast, Present and Future of Generative AI
Past, Present and Future of Generative AIabhishek36461
 
Call Girls Delhi {Jodhpur} 9711199012 high profile service
Call Girls Delhi {Jodhpur} 9711199012 high profile serviceCall Girls Delhi {Jodhpur} 9711199012 high profile service
Call Girls Delhi {Jodhpur} 9711199012 high profile servicerehmti665
 
Gurgaon ✡️9711147426✨Call In girls Gurgaon Sector 51 escort service
Gurgaon ✡️9711147426✨Call In girls Gurgaon Sector 51 escort serviceGurgaon ✡️9711147426✨Call In girls Gurgaon Sector 51 escort service
Gurgaon ✡️9711147426✨Call In girls Gurgaon Sector 51 escort servicejennyeacort
 

Recently uploaded (20)

Internship report on mechanical engineering
Internship report on mechanical engineeringInternship report on mechanical engineering
Internship report on mechanical engineering
 
young call girls in Rajiv Chowk🔝 9953056974 🔝 Delhi escort Service
young call girls in Rajiv Chowk🔝 9953056974 🔝 Delhi escort Serviceyoung call girls in Rajiv Chowk🔝 9953056974 🔝 Delhi escort Service
young call girls in Rajiv Chowk🔝 9953056974 🔝 Delhi escort Service
 
IVE Industry Focused Event - Defence Sector 2024
IVE Industry Focused Event - Defence Sector 2024IVE Industry Focused Event - Defence Sector 2024
IVE Industry Focused Event - Defence Sector 2024
 
🔝9953056974🔝!!-YOUNG call girls in Rajendra Nagar Escort rvice Shot 2000 nigh...
🔝9953056974🔝!!-YOUNG call girls in Rajendra Nagar Escort rvice Shot 2000 nigh...🔝9953056974🔝!!-YOUNG call girls in Rajendra Nagar Escort rvice Shot 2000 nigh...
🔝9953056974🔝!!-YOUNG call girls in Rajendra Nagar Escort rvice Shot 2000 nigh...
 
Electronically Controlled suspensions system .pdf
Electronically Controlled suspensions system .pdfElectronically Controlled suspensions system .pdf
Electronically Controlled suspensions system .pdf
 
OSVC_Meta-Data based Simulation Automation to overcome Verification Challenge...
OSVC_Meta-Data based Simulation Automation to overcome Verification Challenge...OSVC_Meta-Data based Simulation Automation to overcome Verification Challenge...
OSVC_Meta-Data based Simulation Automation to overcome Verification Challenge...
 
Oxy acetylene welding presentation note.
Oxy acetylene welding presentation note.Oxy acetylene welding presentation note.
Oxy acetylene welding presentation note.
 
CCS355 Neural Network & Deep Learning UNIT III notes and Question bank .pdf
CCS355 Neural Network & Deep Learning UNIT III notes and Question bank .pdfCCS355 Neural Network & Deep Learning UNIT III notes and Question bank .pdf
CCS355 Neural Network & Deep Learning UNIT III notes and Question bank .pdf
 
Microscopic Analysis of Ceramic Materials.pptx
Microscopic Analysis of Ceramic Materials.pptxMicroscopic Analysis of Ceramic Materials.pptx
Microscopic Analysis of Ceramic Materials.pptx
 
CCS355 Neural Network & Deep Learning Unit II Notes with Question bank .pdf
CCS355 Neural Network & Deep Learning Unit II Notes with Question bank .pdfCCS355 Neural Network & Deep Learning Unit II Notes with Question bank .pdf
CCS355 Neural Network & Deep Learning Unit II Notes with Question bank .pdf
 
APPLICATIONS-AC/DC DRIVES-OPERATING CHARACTERISTICS
APPLICATIONS-AC/DC DRIVES-OPERATING CHARACTERISTICSAPPLICATIONS-AC/DC DRIVES-OPERATING CHARACTERISTICS
APPLICATIONS-AC/DC DRIVES-OPERATING CHARACTERISTICS
 
9953056974 Call Girls In South Ex, Escorts (Delhi) NCR.pdf
9953056974 Call Girls In South Ex, Escorts (Delhi) NCR.pdf9953056974 Call Girls In South Ex, Escorts (Delhi) NCR.pdf
9953056974 Call Girls In South Ex, Escorts (Delhi) NCR.pdf
 
Call Us -/9953056974- Call Girls In Vikaspuri-/- Delhi NCR
Call Us -/9953056974- Call Girls In Vikaspuri-/- Delhi NCRCall Us -/9953056974- Call Girls In Vikaspuri-/- Delhi NCR
Call Us -/9953056974- Call Girls In Vikaspuri-/- Delhi NCR
 
Architect Hassan Khalil Portfolio for 2024
Architect Hassan Khalil Portfolio for 2024Architect Hassan Khalil Portfolio for 2024
Architect Hassan Khalil Portfolio for 2024
 
Artificial-Intelligence-in-Electronics (K).pptx
Artificial-Intelligence-in-Electronics (K).pptxArtificial-Intelligence-in-Electronics (K).pptx
Artificial-Intelligence-in-Electronics (K).pptx
 
VIP Call Girls Service Hitech City Hyderabad Call +91-8250192130
VIP Call Girls Service Hitech City Hyderabad Call +91-8250192130VIP Call Girls Service Hitech City Hyderabad Call +91-8250192130
VIP Call Girls Service Hitech City Hyderabad Call +91-8250192130
 
main PPT.pptx of girls hostel security using rfid
main PPT.pptx of girls hostel security using rfidmain PPT.pptx of girls hostel security using rfid
main PPT.pptx of girls hostel security using rfid
 
Past, Present and Future of Generative AI
Past, Present and Future of Generative AIPast, Present and Future of Generative AI
Past, Present and Future of Generative AI
 
Call Girls Delhi {Jodhpur} 9711199012 high profile service
Call Girls Delhi {Jodhpur} 9711199012 high profile serviceCall Girls Delhi {Jodhpur} 9711199012 high profile service
Call Girls Delhi {Jodhpur} 9711199012 high profile service
 
Gurgaon ✡️9711147426✨Call In girls Gurgaon Sector 51 escort service
Gurgaon ✡️9711147426✨Call In girls Gurgaon Sector 51 escort serviceGurgaon ✡️9711147426✨Call In girls Gurgaon Sector 51 escort service
Gurgaon ✡️9711147426✨Call In girls Gurgaon Sector 51 escort service
 

Custo sucessivo

  • 1. Procedia - Social and Behavioral Sciences 226 (2016) 176 – 183 Available online at www.sciencedirect.com 1877-0428 © 2016 The Authors. Published by Elsevier Ltd. This is an open access article under the CC BY-NC-ND license (http://creativecommons.org/licenses/by-nc-nd/4.0/). Peer-review under responsibility of the organizing committee of IPMA WC 2015. doi:10.1016/j.sbspro.2016.06.177 ScienceDirect 29th World Congress International Project Management Association (IPMA) 2015, IPMA WC 2015, 28-30 September – 1 October 2015, Westin Playa Bonita, Panama Successive cost estimation – successful budgeting of major projects Ole Jonny Klakegga *, Steen Lichtenbergb a Norwegian University of Science and Technology, 7491 Trondheim, Norway b Lichtenberg & Partners, Baneskellet 16, DK-2950, Vedbaek, Denmark Abstract Project Management and Cost Engineering have made tremendous advances but we still witness all too frequent severe budget overruns and delays. A solution to this mega problem of budget overruns actually exists. Use of the Successive Principle has demonstrated this during the later decennials. It has demonstrated in tough practice that it is possible to make accurate, unbiased statistical prognoses of the factual project cost or other important key figures. The results reported here may be surprising, given the well-known history of cost overrun. In Scandinavia these principles have been widely accepted by top management and authorities. It has improved professional project management. A proper documentation is recently available in the form of two independent datasets of major public projects. This documentation and the key principles are summarised in this paper. © 2016 The Authors. Published by Elsevier Ltd. Peer-review under responsibility of the organizing committee of IPMA WC 2015. Keywords: Cost estimation; Estimation methodology; Major projects; Risk management; Scheduling * Corresponding author. Tel.: +4773594740; fax: +4773597021. E-mail address: ole.jonny.klakegg@ntnu.no © 2016 The Authors. Published by Elsevier Ltd. This is an open access article under the CC BY-NC-ND license (http://creativecommons.org/licenses/by-nc-nd/4.0/). Peer-review under responsibility of the organizing committee of IPMA WC 2015.
  • 2. 177Ole Jonny Klakegg and Steen Lichtenberg / Procedia - Social and Behavioral Sciences 226 (2016) 176 – 183 1. Introduction Project Management (PM) and Cost Engineering (CE) have made tremendous advances during many decades. Nevertheless, we still witness all too frequent severe budget overruns and delays, especially among larger projects. Many authors have documented this. This introduction does not grant room to give a complete overview of this theme, but gives a brief overview as background for presenting successful recent results from Scandinavia. Internationally the most referred source for claiming project cost overrun is the famous Standish Group (2004) “Chaos report”. It shows depressing results in a large sample of ICT-projects, and this source is not alone in claiming most projects go wrong. Other credible sources include Flyvbjerg, Holm & Buhl (2002, 2003). Their result of a large analysis was that 90% of an international set of large projects had cost overruns, generally of a significant size. They also found significant overestimations of project benefit. They further documented that no improvement could be seen over many decades. This dataset is dominated by public megaprojects. Merrow (2011) documents that the situation is not much better in private sector: 65-75% of industrial megaprojects fail on business targets. Based on 318 industrial megaprojects his analysis indicates that there are seven recurring reasons for failure, among these are cutting corners and spending too little time and effort in the front end. The projects in the analyses above are generally large and complex. This makes the question of size interesting – does size matter? Odeck (2004) studied this by analyzing a complete sample of all public road projects in Norway for a 3 year period (1992-1995) – a total of 620 projects. His results indicate that small projects have even worse results than large projects – the cost overrun was even more frequent and relatively larger in small projects. On the positive side, he also documented that the total share of projects having cost overrun and the average size of overrun was less than indicated in international studies. To summarize this; we know for a fact that historically projects have had a strong tendency for cost overrun – large or small, private or public – and over time. Similarly, the studies on cost overrun also look for reasons behind the cost overrun (and corresponding benefit underperformance). Flyvbjerg et al. (2002, 2003) argues that a main problem is that planners and promoters often deliberately underestimate costs and risks and overestimate the benefits in order to increase the likelihood that their project gets approval and funding. This view is supported by other studies as well – there are political or strategic reasons for cost overrun. Similar reasons are identified by Merrow (2011) in business projects, and in addition he point to inadequate cost estimation and risk assessments. We know that there are strategic and tactical reasons for projects to experience cost overrun and benefits underperformance. These reasons need to be understood and handled well to improve PM performance. Another set of reasons for cost overrun are known to stem from human judgment, as documented by Kahneman & Tversky (1979) and later excellently explained by Kahneman (2011). Lange (1985) disclosed this reason in a master’s thesis: Subjective expert evaluations are typically biased by several psychological pitfalls. A well-known scientific paradigm is typical for engineering culture; to focus only upon documentary matters, and avoid dealing with subjective, non-documentary matters. Consequently, subjective matters were considered only superficial if at all included. Despite scientific methods for cost estimation did exist, a still larger part of a budget or schedule rested upon subjective expert evaluations. Inspired by this observation Lange identified from psychological literature more than 20 pitfalls when making such quantitative evaluations. This was an eye-opener in Scandinavia and initiated a different way of thinking about how cost estimation should be done in practice. Traditional tools and techniques for project planning and management were based on deterministic logic, although leading scholars early realized this was not sufficient. When theory tried to cope with uncertainty in these traditional methods, it became very complicated. The tools became increasingly challenging, especially for small organizations. Uncertainty was seen as almost impossible to handle, while using the classical statistical theories towards planning and estimating the fuzzy future. The existing procedures were either too primitive or too difficult to operate. This realization sparked a development in Denmark in the early 1970’s that initiated the story reported in the next section of this paper. 2. Untraditional research efforts during the 70s and 80s Successful results in scheduling during the 1960s came from the use of the Program Evaluation Review Technique, PERT, one of the well-known Critical Path Methods. It introduced the triple estimate to measure
  • 3. 178 Ole Jonny Klakegg and Steen Lichtenberg / Procedia - Social and Behavioral Sciences 226 (2016) 176 – 183 uncertain data. Provoked by the many project budget overruns, the idea of using similar logic was introduced in the 1970s towards cost estimates. It was a research effort aiming more realistic project estimates, led by the second author of this paper at the Technical University of Denmark, DTU. The research soon met the difficulties of operative handling the uncertainty. It was complex as a bunch of keys including numeral statistical dependencies. This problem was solved by isolating and defining all significant dependencies among the individual cost items into contingency items. In this manner, all items are largely statistically independent of each other. Another problem was to cope with the huge amount of data, and their uncertainty. This was solved while using a consistent top - down principle. The estimate procedure starts with a set of 8 to 12 physical main items covering the whole scope, and a similar number of contingency items. The estimators evaluate triple estimates of each of these. The total cost is calculated while using normal statistical rules. The specific effect from each uncertain item upon the total uncertainty is established as a “top ten list”. The most uncertain local item at the top of the list by nature is the most critical for the total result. This element is therefore subject to further clarification. The calculation is then updated and a new top ten list appears. The procedure continues after this first step with further successive steps (re: the term “Successive Principle” or “the Stepwise Method”) as long as the total uncertainty is reduced sufficiently. Surprisingly soon all major local uncertainties has been clarified as much as possible. The end result - due to the 20/80 rule - will typically hold only less than a hundred items and factors, often down to 30-40. A prototype of the procedure was launched locally in Denmark during the 1970s and published by Lichtenberg (1971, 1974). Its obvious advances made it soon widespread locally in Denmark. However, it suffered from severe failures due to the many pitfalls when estimators make subjective evaluations. The results suffered from this and the use after some time gradually faded out in Denmark. During the 1980s, this severe problem was solved. Nils Lange (1985) sparked new development, when he identified more than 20 relevant psychological pitfalls from a study of international psychological literature. Spetzler & Staël von Holstein (1975) and Tversky & Kahneman (1983) among others. He also made some advices on how to bypass them. The further development effort took place in an untraditional tight binational cooperation between researchers from Statistical theory, Psychology and Engineering Economy. It was based at the Technical Universities of Denmark respectively Norway, led by the second author and the late professor Reidar Hugsted and his team, respectively. This was soon supplied with the Norwegian professor of psychology, Karl Halvor Teigen (Brun & Teigen, 1988; Teigen, 1988). With Norway as the leading partner, this final research largely solved the remaining problems before the end of the 1980s. The resulting procedure is further developed in section 3. 3. The resulting new procedure In 1990 the research effort resulted in a procedure, which proved most successful (Klakegg, 1993; Lichtenberg, 2000). Its immediate primary applications were as a quality tool towards budget and schedules of larger projects. Besides being able to forecast surprisingly accurate future final results, it identified and ranked the major optimization options. It has been used to augment the productivity considerably and is summarized as follows. The central part is a workshop of typically two full days. It has to be prepared and guided by a facilitator. He/she should have a profound knowledge of the procedure and not least the evaluation techniques and its biases. A workshop group is established of 7 - 15 experts and generalists; competent and with a broad and balanced composition. The ensuing group sessions make full use of the participant’s pooled expertise, experience, intuition and group synergy. In short, the full range of the brainpower of the assembled participants. The composition will help moderate some of the evaluation biases. At least one of the participants should be from outside the project, if possible outside the company, or in other ways be able to function as "the devil's advocate” in order to balance any over-optimism. The physical conditions should be well prepared, and the culture needs to support an open attitude among the participants. After having reached agreement as to its point of departure, its goal and the specific analysis procedure, a qualitative brainstorming process follows, allowing the group first to identify - spontaneously and without any ”no- go areas” - all possible overall uncertain issues. These are then grouped to a smaller number (8 to 12) of discrete and mutually independent main groups of contingencies. For each main group a basic, historical oriented and normalized
  • 4. 179Ole Jonny Klakegg and Steen Lichtenberg / Procedia - Social and Behavioral Sciences 226 (2016) 176 – 183 precondition is defined for use in the following quantification of the physical items. Another definition for each main group of contingencies describes the actual expected future situation of the case project. This latter is used during the following quantification process of the contingency items. Any “either/or” risks of catastrophes, accidents or the like are set aside for a separate risk analysis. Initially merely 10 - 15 physical main items are used to cover the total cost, normally based upon a conventional estimating procedure. To this structure, we add a series of contingency items, namely the above defined 8 - 12 overall groups of contingency issues. To assure the workshop group makes correct subjective judgments of the cost in the subsequent quantitative analysis, use the following estimating procedure, called the Group Triple Estimate or GTE procedure. It is documented to be able to largely compensate for the many evaluation pitfalls if “the rules of the game” are carefully followed. These set of rules are thoroughly described in Lichtenberg (2000). Only the main aspects are described here: Before the quantification, the workshop group will briefly discuss the subject matter, particularly the scope and defined preconditions of each item, but strictly without mentioning any figures. Then, in complete silence, all participants concentrate and find their own intuitive personal triple estimates and write them down. Conferring is not permitted in this phase. A triple estimate consists of an extreme low and an extreme high value followed by a “most likely” value. In the following quantification process, one triple estimate is made for each of the physical main items based on the historical base preconditions, and for each of the supplementary contingency items. The latter quantification is based upon the difference between the base precondition and the definition of the perceived actual situation. The extreme values are evaluated before the most likely ones to avoid one of the biases. Using the most extreme values among all participants compensate for a serious pitfall of underestimating the low and high values. The statistical calculations of the first result are completed without contravening the natural laws of uncertainty (the Bayesian statistical theory). Due to the established mutual independency, these calculations are both fairy simple and correct. The total result is calculated. It can be done manually, but to save time it is normally fed into a computer with one of the available software applications (see www.futuraone.com for more information). The top level result of these initial calculations identifies a ”top ten list” of the largest local sources of uncertainty from both the physical items and the contingency items. Those at the top of the top ten list - being the most critical ones - are further specified into independent sub items if possible. If this is not possible, the participants seeks to “bring on the table” supplementary relevant information to clarify the situation. The relevant sub items or the original item is re-evaluated while using the GTE procedure again. A re-calculation follows and an updated top ten list appears besides the total mean and standard deviation. The previous clarification step is repeated successively until the total result is sufficiently stable. The well-known “20-80 rule” comes emphatically into effect here and therefore only relatively few steps are typically required before all the predominant sources of uncertainty have been addressed and clarified as much as possible. At this point of time, the participants are well equipped to suggest action plans for further optimization. Used as a management tool, this helps the project manager develop his PM strategy and optimize the situation. A number of specific variants of this procedure have been developed for a range of practical applications: Cost estimates, Schedule analyses, Benefit/Cost analyses, as well as for project optimization, obtaining consensus and team building. Examples are given in Klakegg (1993), Lichtenberg (2000), Samset & Volden (2013), Statens vegvesen (2014), Schrøder & Lichtenberg (2013), and www.lichtenberg.org. Schedules are basically analyzed according to the same procedure, but instead of a cost break down structure, a top level critical path network is used as a basis. It consists of 10 - 14 main activities or groups of activities. To this basic network, “contingency activities” are added at relevant places in the network plus one or several ones as end activities. They cover contingencies, which affect the plan as a whole. The first qualitative part of the procedure runs exactly as described above. The quantitative process uses the GTE procedure. The duration of all physical activities are evaluated under condition of the basic preconditions, as described above, while the duration of the contingency activities are evaluated according to the difference between the basic preconditions and the actual description of the specific situation. The following network calculations will normally be based on Monte Carlo simulations. Using the same Top-down procedure as above, any specification has the form of a sub net.
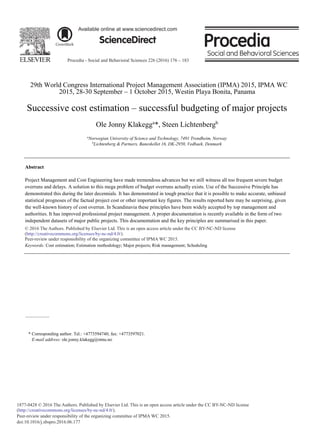
  • 5. 180 Ole Jonny Klakegg and Steen Lichtenberg / Procedia - Social and Behavioral Sciences 226 (2016) 176 – 183 4. Documentation and experience The Successive Principle has been used internationally (www.futuraone.com) since 1990. However, first of all in Scandinavia (www.lichtenbeg.org) in most public and private spheres and for many different purposes (Archibald & Lichtenberg, 1992). Most intensively it is implemented in Norway (www.concept.ntnu.no), as documented in Aass, Jermstad, Aanes Johansen & Klakegg (2010) and Samset & Volden (2013). During three decades, up to a thousand of projects have been analyzed while using these principles with successful results. However, it has been hard to believe that it is actually possible to get full control over the budget and schedules of large projects. Therefore many previous examples of successful results have generally been explained as pure luck, perfect project management or the like. However, this capability to fully control the project outcome is for the first time recently properly documented from two independent series of large projects, summarized below. 4.1. Norwegian major public projects since year 2000 A governmental commission in 1999 evaluated the current practice in many governmental bodies. As a result, the commission suggested a budget quality audit based on these new principles (Berg, 1999). Since 2000 budget quality audits based on the Successive Principle has been obligatory for all large-scale Norwegian public-sector investment projects before final decision to finance and execute. The ambition was that from now on 80 % of the projects should keep to budget. Any higher ambition than 80 % was assumed too costly. By 2013, 40 of these projects of all categories were completed. An official report (Samset & Volden, 2013) published the result so far. The report shows that exactly 80 %, namely 32 of the 40 projects, kept to budget (see Figure 1a). 4.2. Danish large road projects 2002-2007 Over the period 2002 – 2007, the final costs of all large-scale Danish highway projects were estimated using the Successive Principle. By 2013 a significant number of projects were finished, and it was possible to compare the prognoses with the actual final costs for 40 of these analyses. The result is illustrated in figure 1b. The vertical scale indicates the number of projects, while the horizontal scale shows the difference between prognosticated mean value and the actual costs in proportion to the standard deviation. The overall result was well in agreement with both the mean values and the calculated uncertainty. However, the actual final costs were approximately seven percent lower than the calculated mean figure on average. Similarly, the actual spread was slightly below the calculated uncertainty. A likely reason is the fact that the project managers have capitalized on the potential optimization possibilities identified by the analyses. The reduced final costs as well as the slightly reduced Figure 1a Norwegian results from 40 major public investment projects (Samset & Volden, 2013) Figure 1b Danish results from 40 road projects. The prognoses are blue, and the factual results are red (Schrøder & Lichtenberg, 2014)
  • 6. 181Ole Jonny Klakegg and Steen Lichtenberg / Procedia - Social and Behavioral Sciences 226 (2016) 176 – 183 uncertainty are most likely a result of their subsequent action plans. More detailed results so far only appear in the Danish language at www.lichtenberg.org.These results document that by now there is good control with the cost of large infrastructure projects in Norway and road projects in Denmark from the GO/NO GO decision is made and until the projects are delivered. 5. Discussion on theory and practice Typical feedback used to be surprise at how close the prognoses are to the actual results, which are subsequently achieved. This was most obvious in cases of project schedules. Today it is accepted as expected when large projects actually meet cost and time in Norway, Sweden, and to lesser degree in Denmark. However, any untraditional research which integrates different fields like Statistical theory, Psychology and Engineering Economy holds weaknesses, limitations and unsolved questions. Important benefits and solutions have materialized during the later decades of practical applications. The obvious strength lies partly in that unpleasant surprises now with great certainty can be significantly reduced and partly in the new opportunities for project efficiency and increased teamwork that this method helps uncover. Questions are asked before instead of after the fact. The weaknesses and limitations lie in having to comply with "the rules of the game" – some of them untraditional and for some participants provoking. It can for example only be useful in organizations with a modern management attitude, and a policy of internal openness. It requires courage and genuine will to meet the ‘naked truth’ of the task, whether it concerns schedules, budget proposals, financial analyses etc. It is a challenge in busy workdays to set up a sufficiently broad-based analysis group of key persons. Given the innovative character of the Successive Principle and the weight given to both qualitative and quantitative evaluation process, a considerable and demanding “running-in” period is needed, with the full, unequivocal backing of senior management. Even if this is obtainable; the process must be steered by a facilitator who has a good grasp of group dynamics, statistics and the use of the Successive Principle. They may be hard to find. A typical observed weakness is to compromise with a less relevant analysis group and accept of unprepared attendance. Even more serious is to focus solely on the physical items without sufficient regard to the overall general effects from the project environment, management, client, the current project situation, future development etc. Another typical weakness lies in handling the triple estimates correctly in the group. Unfortunately it is often seen that the well-documented significant underestimation of the max and min values is not properly compensated by using the most extreme values in the whole analysis group. The new principles have already been used in a broad field of applications. However some applications are so far at the experimental stage or even merely a potential. The use has shown considerable augments of the productivity. So far, this has been seen as a side effect. Improvement of the productivity as a primary goal of an analysis does still need further development and tests. The same is the case with quality reviews of Life Cycle Analyses as well as the use as proper risk analysis. Improvement of the accuracy of economical prognoses is just a potential application so far, however a most promising one. A large portfolio of public and private companies in Scandinavia and beyond consistently testifies to the benefits of using the Successive Principle. Many users liken the Successive Principle to a pair of “future- glasses” or to an “ultra-sound scan” of plans, estimates, budgets, etc. This is partly because of the specific and realistic picture of how matters will progress in terms of the budget or schedule and partly because of the ranked list of the most important external and internal sources of uncertainty. These consist of specific threat factors, hidden opportunities or simply grounds for uncertainty. The value of this list lies in allowing the client to take timely preventive or protective action against threats and to make the most of the positive opportunities in order to improve competitiveness, or simply to achieve greater efficiency. Control and optimization of major project schedules has been a particularly successful sphere of application. It has often been possible to accelerate timely. Johansen, Sandvin, Torp & Økland (2014) observes 5 challenges with today’s practice that still needs more attention in current Norwegian practice: 1) expressing the real uncertainty in very early phases of a project, 2) avoid digging too deep in details, 3) getting the standard deviation right (expressing the realistic uncertainty) in all phases of the project, 4) handling the human error and team effects (heuristics and group think) and understanding their effects, 5) avoid neglecting opportunities during the risk- and uncertainty analysis (we seem to have a blind spot for
  • 7. 182 Ole Jonny Klakegg and Steen Lichtenberg / Procedia - Social and Behavioral Sciences 226 (2016) 176 – 183 opportunities). The Successive Principle addresses all these challenges, but even more improvements in practice are called for. We applaud such initiatives and suggest one specific improvement in the concluding part. The potential is huge, but it does not come for free. Significant investment in education of key individuals and training of facilitators is needed. So too is the development and implementation of organizational procedures to support and utilize the method. 6. Conclusion and the way forward Project Management and Cost Engineering have made tremendous advances during many decades. Still we know that projects are often delivered too late and with severe cost overrun. This paper describes the development and result of a new method that challenges traditional ways of thinking about project planning and cost estimation. The results have been promising since the introduction in the 90’s but often explained away by referring to luck or other situational factors. Then finally in 2013 and 2014 came credible documentation that confirmed there is more than coincidence behind these results. The results are presented above: Good control with the cost of large infrastructure projects is established in Norway and Denmark using the Successive Principle. This documentation confirms we have come a long way, but still there are challenges for future development. Klakegg, Torp & Austeng (2010) observed that there are several challenges in making the analyses, methods and tools easy enough to give practical support to those that need it on one hand, and the ideal precision and advanced user interface on the other hand. There are real dilemmas in this development. Maybe there is no such thing as a perfect solution to this dilemma. One problem has the Successive Principle not yet solved. It is the remaining issue of cost escalation of large projects from the first idea and up to the point in time where the GO/NO GO decision is made. The Successive Principle is the best available method for estimating the cost from an inside view position. However, current practice shows that we need to strengthen even more the work in the earliest phases. Flyvbjerg (2006) suggests adding the outside view through Reference class forecasting. We believe this is a useful way of strengthening the earliest cost estimates. These two methods together form a complete toolset to secure realistic cost estimates even in a very early phase of development. However, more research and practical implementation is needed. The first attempts to use the outside view were introduced in Norway as part of external quality assurance, but complete reference class forecasting is not implemented yet. The authors will follow this development with excitement. References Aass, T., Jermstad, O., Aanes Johansen, K. & Klakegg, O. J. (2010). Governance of Norwegian Government Projects. Paper, International Project Management Association, IPMA World Congress 2010, Istanbul. Archibald, R. D. & Lichtenberg, S. (1992). Experiences using Next Generation Management Practices, Keynote paper, Proceedings IPMA World Congress 1992, Florence, Italy, June 1992. Berg, P. (ed.) (1999). Styring av statlige investeringer (Controlling Governmental Investments), Norwegian Ministry of Finance, Oslo (in Norwegian). Brun, W. & Teigen K. H. (1988). Verbal probabilities: Ambiguous, context-dependent, or both? Organizational Behaviour and Human Decision Processes, 41, 390 – 404. Flyvbjerg, B., Holm, M. S. & Buhl, S. (2002). Underestimating Costs in Public Works Projects: Error or Lie?. Journal of the American Planning Association, 68, 279-295. Flyvbjerg, B., Holm, M. S. & Buhl, S. (2003) How common and how large are cost overruns in transport infrastructure projects?, Transport Reviews, 23, 71-88. Flyvbjerg, B. (2006). Curbing Optimism Bias and Strategic Misrepresentation in Planning: Reference Class Forecasting in Practice”, European Planning Studies, 16, 3-21. Johansen, A., Sandvin, B., Torp, O. & Økland, A. (2014) Uncertainty analysis – 5 challenges with today’s practice. Procedia – Social and Behavioral Sciences, 119, 591-600. Kahneman, D. & Tversky, A. (1979). Prospect Theory: An Analysis of Decision Under Risk. Econometrica, 47, 263–291. Kahneman, D. (2011). Thinking, Fast and Slow. UK, London: Penguin books. Klakegg, O. J. (1993). Trinnvis-prosessen (the handbook on the Stepwise Procedure). Handbook. NTH Technical University of Norway (in Norwegian). Klakegg, O. J.,Torp, O. & Austeng, K. (2010). Good and Simple: A dilemma in Analytical Processes? International Journal of Managing Projects in Business, 3, 402-421.
  • 8. 183Ole Jonny Klakegg and Steen Lichtenberg / Procedia - Social and Behavioral Sciences 226 (2016) 176 – 183 Lange, N. (1985) Sikker vurdering af usikkerhed (Accurate evaluation of uncertainty) Ms.Thesis, Technical University of Denmark, DTU (in Danish and not published). A summary appears in Lichtenberg. S. (2000), see p.132 ff.). Lichtenberg, S. (1971). Successiv Kalkulation (Successive Estimating), Research report, Technical University of Denmark (in Danish, not published). Lichtenberg, S. (1974). The Successive Principle, Proceedings, PMI International Symposium, Washington, DC, 570-578. Lichtenberg, S. (2000). Proactive management of uncertainty - using the Successive Principle, Handbook, published by the author, 345 p. Merrow, E. W. (2011) Industrial megaprojects. Concepts, Strategies and Practices for Success. John Wiley and sons, Hoboken, New Jersey. Odeck, J. (2004) Cost overruns in road construction – what are their sizes and determinants? Transport Policy, 11, 43–53. Samset, K. & Volden, G.H. (2013). Investing for Impact. Lessons with the Norwegian State Project Model and the first investment projects that have been subject to external quality assurance. Concept report no. 36. Available at www.ntnu.no/concept/ Schrøder, A. & Lichtenberg, S. (2014) Sikker budgetkontrol efter Successiv Princippet. [Budget control according to the Successive Principle] (in Danish) Available at http://da.lichtenberg.org/nyheder-2014/vejprojekter Standish Group (2004). CHAOS Report (Report). West Yarmouth, Massachusetts: Standish Group. Spetzler, C. F. & Staël von Holstein, C., S. (1975). Probability encoding in decision analysis. Management Science, U.S.A. Nov. Statens vegvesen (2014). Håndbok R764, Anslagmetoden (Handbook for the Stepwise Method). The Norwegian Public Road Authorities (Statens vegvesen). Oslo. (in Norwegian). Available at http://www.vegvesen.no/Fag/Publikasjoner/Handboker Teigen, K. H. (1988). The language of uncertainty, Acta Psychologica, 68, 1–3, , 27-38. Tversky, A. & Kahneman, D. (1983). Judgement under Uncertainty: Heuristics and Biases. Hebrew University, Jerusalem. www.futuraone.com/ Northern Europe group of consultants specialized in application of the Successive Principle. www.lichtenberg.org/ Description of the principles, applications, and experiences of the Successive Principle. www.ntnu.no/concept/ Research program at the Norwegian University of Science and Technology on optimizing large public projects.