
Recommended
Recommended
More Related Content
Similar to Activity 8.1B- Questions 1, 3, & 4 (Page 217)The picture below i.docx
Similar to Activity 8.1B- Questions 1, 3, & 4 (Page 217)The picture below i.docx (14)
More from nettletondevon
More from nettletondevon (20)
Recently uploaded
Recently uploaded (20)
Activity 8.1B- Questions 1, 3, & 4 (Page 217)The picture below i.docx
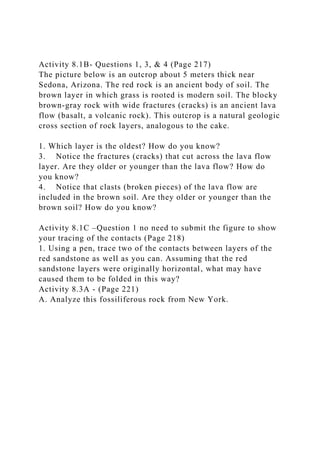
- 1. Activity 8.1B- Questions 1, 3, & 4 (Page 217) The picture below is an outcrop about 5 meters thick near Sedona, Arizona. The red rock is an ancient body of soil. The brown layer in which grass is rooted is modern soil. The blocky brown-gray rock with wide fractures (cracks) is an ancient lava flow (basalt, a volcanic rock). This outcrop is a natural geologic cross section of rock layers, analogous to the cake. 1. Which layer is the oldest? How do you know? 3. Notice the fractures (cracks) that cut across the lava flow layer. Are they older or younger than the lava flow? How do you know? 4. Notice that clasts (broken pieces) of the lava flow are included in the brown soil. Are they older or younger than the brown soil? How do you know? Activity 8.1C –Question 1 no need to submit the figure to show your tracing of the contacts (Page 218) 1. Using a pen, trace two of the contacts between layers of the red sandstone as well as you can. Assuming that the red sandstone layers were originally horizontal, what may have caused them to be folded in this way? Activity 8.3A - (Page 221) A. Analyze this fossiliferous rock from New York.
- 2. Figure 8.10 1. What index fossils from Figure 8.10 are present? 2. Based on the overlap of range zones for these index fossils what is the relative age of the rock (expressed as the early, middle, or late part of one or more periods of time)? 3. Using Figure 8.10, what is the absolute age of the rock in Ma (millions of years old/ago), as a range from oldest to youngest? Activity 8.5A (Page 223) A. Refer to the image below, an outcrop in a surface mine (coal strip mine) in northern New Mexico. Note the sill, sedimentary rocks, fault, places where a fossil leaf was found, and isotope data for zircon crystals in the sill. 1. What is the relative age of the sedimentary rocks in this rock exposure? Explain your reasoning. 2. What is the absolute age of the sill? Show how you calculated the answer. 3. Locate the fault. How much displacement has occurred along this fault? ______meters Figure 5.4 Plotting Goals from a Development Perspective
- 3. • Functional goals are high in organizational value but low in development value. These are things that employees know how to do and have typically done before. They are not necessarily easy, but they are familiar. The advantage of functional goals is they allow employees to contribute to the organization by focusing on important but familiar tasks. The disadvantage is they do not push employees to grow and develop new capabilities. People who have too many functional goals may feel as if they are stuck in a rut, doing the same things over and over. • Self-focused development goals are low in organizational value but high in development value. The advantage of these goals is they allow employees to take developmental risks since failure will not have a major negative impact on the business. The disadvantage is that employees may never get around to these goals since they are not important to the organization. This quadrant is sometimes referred to as the “books I want to read” or “classes I keep hoping to take” section of someone's goal plan. • Underutilization goals are low in both organizational value and developmental value. These may be goals that used to have more value but have become less important or less challenging over time. Underutilization goals provide little value to the company or the employee and should be removed from an employee's goal plan if possible. It may make sense to reassign these goals to other employees who will gain more developmental value from performing them. What may be a relatively unimportant and low-development-value goal for a more tenured employee might be a challenging and important goal for a less-experienced employee. (Hunt 139-140) Hunt, Steven T. Commonsense Talent Management. Pfeiffer, 2014-02-10. VitalBook file.
- 4. THE ACCOUNTING REVIEW American Accounting Association Vol. 88, No. 5 DOI: 10.2308/accr-50480 2013 pp. 1805–1831 The Effects of Reward Type on Employee Goal Setting, Goal Commitment, and Performance Adam Presslee University of Pittsburgh Thomas W. Vance University of Illinois at Urbana–Champaign R. Alan Webb University of Waterloo ABSTRACT: The use of tangible rewards in the form of non- cash incentives with a monetary value has become increasingly common in many organizations (Peltier et al. 2005). Despite their use, the behavioral and performance effects of tangible rewards have received minimal research attention. Relative to cash rewards, we predict tangible
- 5. rewards will have positive effects on goal commitment and performance but will lead employees to set easier goals, which will negatively affect performance. The overall performance impact of tangible rewards will depend on the relative strength of these competing effects. We conduct a quasi-experiment at five call centers of a financial services company. Employees at two locations earned cash rewards for goal attainment while employees at three locations earned points, with equivalent retail value to cash rewards, redeemable for merchandise. Results show that cash rewards lead to better performance through their effects on the difficulty of the goals employees selected. Implications for theory and practice are discussed. Keywords: goals; tangible rewards; performance. Data Availability: The data used in this study are available upon request. Thanks to Scott Jeffrey for assistance in obtaining the data for this study. We also thank two anonymous reviewers, John Harry Evans III (senior editor), Leslie Berger, Margaret Christ, Lynn Hannan, Ken Klassen, Victor Maas, Timothy
- 6. Mitchell, Tony Wirjanto, participants at the 2011 AAA Annual Meeting, participants at the 2011 CAAA Conference, participants at the 2011 MAS Conference, participants at the 2010 ABO Conference, and two anonymous reviewers from the 2011 MAS Conference for helpful comments on an earlier draft. Editor’s note: At the time that Senior Editor John Harry Evans III accepted this manuscript, Adam Presslee had no association with the University of Pittsburgh. Submitted: March 2011 Accepted: February 2013 Published Online: April 2013 1805 I. INTRODUCTION O rganizations frequently use performance goals and research in accounting and psychology shows a positive association between goal difficulty and performance until ability limits are reached (Fisher et al. 2003; Locke and Latham 1990). Existing research also indicates that providing rewards for goal attainment can increase effort and strengthen individuals’ goal commitment, which can result in better performance
- 7. (Hollenbeck and Klein 1987; Prendergast 1999). While performance-based rewards have traditionally taken the form of cash bonuses, companies are increasingly providing tangible rewards (Brun and Dugas 2008; Long and Shields 2010). Tangible rewards are non-cash incentives that have monetary value, which includes gift cards, merchandise, and travel (Condly et al. 2003). The practitioner literature on compensation commonly advocates the use of tangible rewards (e.g., Ford and Fina 2006 ). Compensation practice surveys in the U.S. report that from 34 percent to 65 percent of companies use merchandise, travel, or gift card rewards, with total annual spending of over $46 billion (Incentive Federation Inc. 2007; Peltier et al. 2005). 1 Despite the common use of tangible rewards, minimal research has examined their effects on employee behavior and performance. We address this gap by considering three related research questions in the context of a unique, field-based goal-setting program as described below. First, holding the monetary value of the reward constant, does reward
- 8. type (cash versus tangible) affect the difficulty of the performance goal selected by employees? Second, does reward type affect employees’ commitment to attaining their self-selected performance goals? Finally, through the effects on goal difficulty and commitment, does reward type affect performance? Using mental accounting theory, which deals with the psychology of choice (Kahneman 2003; Thaler 1999), we predict that employees eligible to receive tangible rewards will self-select less difficult performance goals than those eligible for cash rewards. Cash rewards share similar properties as salary because cash rewards are paid in cash, deposited to the same bank account, etc., and employees are therefore more likely to categorize cash rewards in a mental ‘‘account’’ containing other cash earnings (Thaler 1999). Conversely, because of their distinctiveness, employees are more likely to categorize tangible rewards in a mental ‘‘account’’ separate from cash compensation. Because of this categorization process, a smaller percentage of the corresponding mental account balance is at stake when the employee fails to attain a goal in the cash reward
- 9. system relative to the tangible reward system. To avoid the potential loss of a larger percentage of the mental account balance by failing to meet their selected goal, employees eligible to earn tangible rewards will choose goals that are easier to attain compared to those pursuing cash rewards. We also expect that because of their hedonic attributes, such as enjoyment and pleasure, tangible rewards will elicit a stronger affective response and generate higher levels of anticipated satisfaction than cash (Dhar and Wertenbroch 2000; O’Curry and Strahilevitz 2001). We predict that the greater attractiveness of tangible rewards will result in employees eligible to receive tangible rewards being more committed to goal attainment than those eligible for cash rewards (Klein et al. 1999). Our predictions regarding goal selection and commitment imply competing effects of reward type on performance. On one hand, the more difficult goals selected by employees eligible for cash rewards will be associated with better performance (Klein et al. 1999; Locke and Latham 1990), while on the other hand, the higher goal commitment by employees eligible for tangible rewards
- 10. will also be associated with better performance (Hollenbeck et al. 1989). Because there is no clear theoretical basis for predicting which effect will dominate, we pose a null hypothesis on the 1 A recent survey by Jeffrey et al. (2011) indicates that for companies using tangible rewards and spending more than $1 million annually on all types of incentive compensation, tangible rewards represent about 19 percent of the total. 1806 Presslee, Vance, and Webb The Accounting Review September 2013 association between reward type and performance. However, within each goal level, we predict that the higher commitment induced by tangible rewards will lead to better performance than cash rewards. To test our predictions, we worked with a large financial services company in the U.S. (hereafter, the Company) and a compensation-consulting firm (hereafter, the Firm) to design and conduct a quasi-field experiment across five Company locations.
- 11. 2 Employees at each location selected a performance goal for a one-month period from a menu of three choices, ranging from easy to difficult with payouts for attainment of $100 (easy goal), $350 (moderate goal), and $1,000 (difficult goal). Working with the Company and the Firm, we manipulated the type of reward received for goal attainment. Employees in the cash reward condition received cash, while those in the tangible reward condition earned points redeemable for luxury merchandise, such as expensive coffee makers, selected from a 112-page catalog. The retail value of the points corresponded to the cash payout amounts. The Company selected two locations to receive cash rewards and three locations to receive tangible rewards based on criteria we discussed with them to reduce the likelihood that differences across locations, such as employee age, experience, supervisory style, etc., would affect performance. The Company provided performance data for two months and allowed us to administer a brief online questionnaire immediately after employees selected their
- 12. performance goal in the second month. Results for 570 Company employees show that, as predicted, those eligible for cash rewards selected more challenging performance goals while those eligible for tangible rewards reported higher initial goal commitment. As predicted, we find a positive association between goal difficulty and performance, but do not observe the expected positive link between goal commitment and performance. The only evidence of positive performance effects related to tangible rewards is their association with a significantly higher level of goal attainment for employees selecting the moderately difficult goal. Overall, our results indicate that cash rewards, through their impact on goal selection, have positive significant indirect effects on performance. Our study makes several contributions to the goal-setting and incentive-contracting literatures. First, we extend the limited literature on the effects of reward type on performance. Despite the widespread use of tangible rewards, we are aware of only two studies, both of which are lab
- 13. experiments, that have directly compared the performance effects of tangible versus cash rewards, and these studies produce equivocal findings. Jeffrey (2009) finds tangible rewards lead to better performance than cash, while Shaffer and Arkes (2009) find that cash versus tangible reward type has no impact on performance. To our knowledge, we are the first to examine the performance effects of reward type using field data, and our results are largely consistent with cash motivating better performance. Second, we extend Webb et al. (2010), who use data from the current research site to provide evidence that impression management intentions and prior eligibility for rewards are significantly associated with goal selection. 3 We build on their results by showing that reward type is associated with the difficulty of employees’ self-selected performance goals and their subsequent commitment to those goals. As such, we contribute to the extensive goal-theory literature by identifying an important influence on goal-setting behavior and performance not considered in prior research. Finally, we believe our results demonstrate the relevance of mental accounting theory to
- 14. 2 Unlike a traditional experiment, a quasi-experiment does not include random assignment of individuals to treatment-groups (Trochim and Donnelly 2008). In our study, the Company assigned reward condition at each location. 3 We discuss the overlap in data between our study and Webb et al. (2010) in Section III. However, Webb et al. (2010) do not examine the effects of reward type on goal-setting or goal commitment nor do they examine the relation between goal commitment and performance. The Effects of Reward Type on Employee Goal Setting, Goal Commitment, and Performance 1807 The Accounting Review September 2013 understanding individual behavior in an important setting in which employees participate in establishing their own performance goals (Luft and Shields 2003). The next section develops hypotheses on the effects of reward type on goal selection, commitment, and performance. In Section III, we describe our research setting and method, Section IV presents our results, and Section V concludes.
- 15. II. BACKGROUND AND HYPOTHESES DEVELOPMENT Tangible Rewards Background and Research Setting Tangible rewards are non-cash incentives that have a monetary value, which can take a variety of forms, including trips, debit cards, gift cards or certificates, and merchandise (Incentive Federation Inc. 2007; Long and Shields 2010). They are distinct from other forms of recognition that have no (little) monetary value such as thank-you letters, plaques, or token gifts (Condly et al. 2003; Jeffrey and Shaffer 2007). 4 Incentive programs providing tangible rewards may be short- term in nature (e.g., a month) with different performance metrics used each program or long-term (e.g., annual) with the same metric(s) used throughout. Tangible rewards are used in a variety of industries, for various functional areas (e.g., sales, production, and administration) and across seniority levels from junior employees to senior managers (Incentive Federation Inc. 2007; Peltier et al. 2005).
- 16. 5 Firms providing tangible rewards often use points systems or gift cards in order to give employees choice as to the rewards received (Jeffrey and Shaffer 2007). In points systems, employees are given points as the reward, which can then be redeemed for tangible rewards, usually from a catalog or website containing numerous choices (Alonzo 1996 ). Recent surveys indicate tangible rewards are an important component of incentive schemes. An Incentive Federation Inc. (2007) survey study indicates total annual tangible reward spending in the U.S. of $46 billion. The same study reports that 34 percent of the 1,121 U.S. companies surveyed use merchandise or travel rewards, with larger companies (revenue greater than $100 million) more likely to use them (57 percent). Similarly, Peltier et al. (2005) report that 57 percent (65 percent) of their 235 survey respondents use merchandise (gift card) awards. Finally, the merchandise reward amounts are often substantive portions of total compensation. Jeffrey et al. (2011) report that among firms budgeting at least $250,000
- 17. for merchandise rewards, the reward amounts range from 4.4 percent to 8.8 percent of employee annual salary. There are anecdotal claims by practitioners that tangible rewards are more effective than cash in motivating employees, and survey evidence indicates many compensation professionals believe tangible rewards are at least as effective as cash (e.g., Ford and Fina 2006; Peltier et al. 2005; Serino 2002). However, research directly comparing the behavioral and performance effects of tangible versus cash rewards is scant and results are mixed. Jeffrey (2009) had participants play a two-round word game with payouts increasing as a function of performance in the second round. In the tangible reward condition, participants received a massage varying in length depending on the performance level attained (5-, 20-, or 60-minute massage, with local retail values of $10, $30, and $100, respectively). In the cash reward condition, participants received the cash equivalent of the retail value of the massage. Results show participants eligible to receive the tangible reward had a significantly larger performance improvement compared to
- 18. those eligible to receive cash. 4 Arguably cash is simply a more liquid form of tangible rewards. However, to remain consistent with the prior literature, we view the limited exchange value of tangible rewards as critically distinguishing them from cash. 5 We confirmed this observation during in-depth interviews conducted with two experts in the field of employee reward and recognition programs. One interviewee is the manager of recognition programs at a large international financial services company and the other is the vice president of reward systems at a large, privately owned consulting company based in the U.S. that specializes in designing and implementing incentive programs. 1808 Presslee, Vance, and Webb The Accounting Review September 2013 Conversely, Shaffer and Arkes (2009) find no difference in performance on a cognitive task (solving anagrams) between participants given cash ($250) versus tangible rewards of a comparable retail value (e.g., iPod, satellite radio receiver). 6 The evidence reviewed above indicates that tangible rewards are an important component of
- 19. the incentive schemes used at many organizations. There is also evidence indicating that tangible rewards are used in settings where bonuses are contingent upon goal attainment (Incentive Federation Inc. 2007; Peltier et al. 2005). Although bonus-for- goal-attainment schemes are commonly employed by organizations, prior research in this area has focused exclusively on settings in which cash rewards are provided (e.g., Anderson et al. 2010; Bonner and Sprinkle 2002). In the sections below, we develop predictions in the context of our research site (described more fully in Section III), where all employees included in our study: (1) select a goal (one-month period) from a menu of three choices established by management; (2) earn rewards for goal attainment that are increasing in goal difficulty; and (3) receive the reward either in cash or in points (equivalent in value to the cash bonuses) redeemable for merchandise of their choosing from a 112-page catalogue. Additional rewards are not provided for performance in excess of the selected goal. Given this setting, our hypotheses focus on the effects of reward type (tangible versus cash) on goal
- 20. selection, goal commitment, and performance. Hypotheses Development Effects of Reward Type on Goal Selection We rely on both mental accounting and prospect theory to predict the effects of reward type on goal selection (Thaler 1985, 1999). Mental accounting focuses on how individuals code, categorize, and evaluate information when making choices (Thaler 1999). Coding relates to the ways in which individuals combine or disaggregate outcomes (e.g., segregation of gains, cancellation of losses against gains). Categorization pertains to the assignment of financial transactions (inflows or outflows) to ‘‘accounts,’’ which, according to Thaler (1999), fall into one of three categories: expenditures (e.g., bills, entertainment); wealth (e.g., retirement savings, home equity); and income (e.g., windfall gains, regular earnings). Individuals tend to categorize financial outcomes (realized and potential) into different mental ‘‘accounts’’ based on the characteristics of those outcomes, with each account having a value function centered on its own reference point (Kahneman and Tversky 1984; Thaler 1999).
- 21. Prior research provides evidence consistent with individuals using separate mental ‘‘accounts’’ for income from different sources and with different mental accounts being associated with different behavior patterns. For example, O’Curry (1999) finds that funds from windfall gains such as football pool winnings are more likely to be spent on hedonic (i.e., fun, pleasurable) items than funds from more anticipated sources of income such as salary. Similarly, Henderson and Peterson (1992) show that different sources of funds lead to different consumption intentions; a cash gift is more likely to be spent on oneself than is a cash bonus from work. These studies demonstrate that separate accounts appear to be activated for different sources of funds and this influences how the funds are spent. Moreover, these findings imply that cash and tangible rewards will be subject to different mental accounting. Given the difference in mental accounting, prospect theory suggests differences in subsequent behavior with respect to goal selection. Prospect theory assumes individuals assess risky decisions by considering the value of a change in an outcome state relative to
- 22. a central referent (Thaler 1999; Kahneman and Tversky 1979). Individuals make wealth-related decisions by considering potential 6 In Jeffrey (2009) and Shaffer and Arkes (2009) the retail (market) value of the tangible rewards was approximately the same as the cash reward amounts to avoid confounding reward type with reward amount. The Effects of Reward Type on Employee Goal Setting, Goal Commitment, and Performance 1809 The Accounting Review September 2013 changes (gains or losses) to their mental account that could result rather than focusing on the ‘‘final balance’’ (Kahneman 2003; Thaler 1999). Individuals are typically risk-averse over gains, risk-seeking over losses, and suffer more from a loss than they feel pleasure from an equivalent gain (Camerer and Loewenstein 2004; Kahneman and Tversky 1979). Tangible rewards with hedonic attributes are likely to result in employees assigning the expected outcomes from goal attainment to a mental account (e.g., ‘‘tangible rewards’’) used less frequently than cash, with a smaller referent value (balance) due to a lack of transaction history (Jeffrey 2009; Thaler 1999). Consequently, failure to reach the target would
- 23. result in a loss of a relatively large proportion of the total balance of the ‘‘tangible rewards’’ mental account. In an effort to avoid this potential loss, individuals will be more risk-averse with respect to goal-setting behavior for tangible rewards, and will select easier, more attainable goals. Conversely, cash rewards have properties similar to the cash salaried employees receive, suggesting inclusion in an already active mental account (e.g., ‘‘cash earnings’’) with a larger central referent value. We believe this is particularly likely in settings (such as ours) where cash bonuses are combined with regular salary and paid to employees as a ‘‘lump sum.’’ 7 Consequently, employees paid cash for goal attainment will likely exhibit more risk-seeking behavior because there is a smaller marginal gain (loss) from receiving (not receiving) a bonus for goal attainment relative to a large ‘‘cash earnings’’ mental account referent value. Individuals will be less sensitive to cash gains earned through goal attainment and less sensitive to losses from failure to attain a goal when those outcomes are coded to the same mental account as regular earnings (Kahneman and
- 24. Tversky 1984; Thaler 1985). This reasoning leads to our first prediction stated in the alternative form: H1: Employees eligible to receive tangible rewards for goal attainment will select less difficult performance goals than those eligible to receive cash rewards. Economic theory would lead to a similar prediction regarding the impact of reward type on goal-setting. Under economic theory, individuals eligible to receive a cash reward will likely choose more difficult goals and be willing to exert the effort necessary to attain them because cash has a higher exchange value and thus potentially greater perceived benefits (Peterson and Luthans 2006; Waldfogel 1993). Moreover, unlike cash, tangible rewards are likely to result in the incurrence of transaction costs related to using (or exchanging) the goods received, which could further reduce their utility for the recipient. However, as described below, economic- and psychology-based theories do not yield similar expectations regarding individuals’ level of commitment to attaining their selected goals.
- 25. Effects of Reward Type on Goal Commitment Goal theory predicts that once a goal is selected or assigned, it is more likely to have a positive effect on performance when individuals are committed to goal attainment (Locke and Latham 1990; Klein et al. 1999). Goal commitment is defined as ‘‘the determination to try for a goal’’ (Hollenbeck et al. 1989, 18). 8 Expectancy and goal theories identify two primary determinants of goal 7 Individuals may record transactions to more than one mental account, but the one with the strongest ‘‘degree of membership’’ or fit will guide behavior (Henderson and Peterson 1992, 108). So, a tangible bonus could be recorded as both a ‘‘tangible reward’’ and ‘‘bonus pay’’ (which could also include cash bonuses). However, given the distinctive nature of tangible items, it seems plausible to expect that they will have a stronger fit with a ‘‘tangible reward’’ account. To the extent the fit of both tangible and cash rewards is stronger for a ‘‘bonus pay’’ account, this biases against H1 since there would be little difference in referent values for that account across reward conditions. 8 In our setting, employees chose their own goal and we measured commitment immediately thereafter. Therefore, H2 is conditional on goal selection. Because we anticipate goal difficulty will affect goal commitment, we
- 26. control for this relation in our specified model (see Figure 1). 1810 Presslee, Vance, and Webb The Accounting Review September 2013 commitment: expectancy, the perceived likelihood of achieving a goal, (Hollenbeck et al. 1989); and goal attractiveness, ‘‘the anticipated satisfaction from goal attainment’’ (Klein 1991, 238). Research shows that providing rewards for goal attainment can increase goal attractiveness, which in turn has a positive effect on commitment (Wright 1992). No studies that we are aware of have examined the effects of reward type on commitment. Economic theory suggests that cash rewards, because of their greater fungibility and zero transaction costs, would be more attractive and thus lead to higher goal commitment than tangible rewards (Shaffer and Arkes 2009). While we agree that these factors will make cash attractive as a reward, psychology theory and related evidence suggests other factors that will make tangible rewards relatively more attractive. Rewards with hedonic
- 27. attributes have been shown to elicit stronger positive affective responses than utilitarian rewards (e.g., cash) of equivalent dollar value (McGraw et al. 2010; O’Curry and Strahilevitz 2001; Shaffer and Arkes 2009). The positive affective response arises in part because individuals have difficulty justifying the purchase of items with hedonic attributes, making them particularly attractive to receive as gifts or rewards (Jeffrey 2009; Prelec and Lowenstein 1998). For example, Shaffer and Arkes (2009) find that when individuals separately evaluate the possibility of receiving tangible versus cash rewards of equal monetary value, the greater positive affect associated with tangible rewards leads to a higher level of anticipated satisfaction. Moreover, social proscriptions generally inhibit the discussion of cash earnings, so individuals are more likely to talk to others about the receipt of tangible rewards (Jeffrey 2009; Webley and Wilson 1989). This willingness to share good news about tangible rewards can also lead to social recognition, adding to the anticipated satisfaction and attractiveness of receiving such rewards.
- 28. The above reasoning suggests that the greater positive affect and anticipated satisfaction with tangible rewards will lead to higher goal attractiveness and commitment compared to cash (Klein 1991). Bolstering this effect are the differences in mental accounting arising for tangible and cash rewards described in the development of our first hypothesis. Because potential tangible rewards are more likely to be coded to a distinct mental account, once the goal is selected, individuals will be more committed to attaining it in an effort to avoid the greater negative affect associated with failing to receive that reward. Our prediction, stated in the alternative form is: 9 H2: Employees eligible to receive tangible rewards for goal attainment will be more committed to their self-selected goals than those eligible to receive cash rewards. Effects of Goal Difficulty and Goal Commitment on Performance The positive effects of goal difficulty on performance are well documented (Bonner and Sprinkle 2002; Locke and Latham 1990). Individuals pursuing
- 29. more difficult goals increase their efforts to achieve them, which can result in higher levels of performance (Locke and Latham 1990; 2002). This relation holds until goals are perceived as too difficult to attain, at which point effort and performance cease to improve (Locke and Latham 2002). We expect goal selection to be a particularly strong determinant of employee effort in our setting since no additional rewards are provided for performance in excess of the chosen goal. Thus, there is an incentive to meet, but not beat, the selected goal. Our prediction, stated in the alternative form is as follows: 9 Because theory and the related evidence support the existence of a strong affective response from tangible rewards, we do not state a competing economics-based hypothesis. Economic factors related to the fungibility and zero transaction cost of cash establishes tension for H2 and, to the extent they influence goal commitment, bias against our predicted effects. The Effects of Reward Type on Employee Goal Setting, Goal Commitment, and Performance 1811 The Accounting Review September 2013
- 30. H3: There will be a positive association between the difficulty of employees’ self-selected goal and performance. In settings where goals are assigned to individuals, goal commitment has been shown to moderate the positive relation between goal difficulty and performance (Latham and Locke 2002). The relation between goal difficulty and performance is stronger when individuals are committed to attaining their goals (Klein et al. 1999). However, there is also evidence supporting a direct relation between goal commitment and performance, particularly when goals are self-set by individuals, as is the case in our setting (Klein et al. 1999; Klein and Lee 2006 ). When goals are self-set, research shows that both goal difficulty and goal commitment can have direct effects on performance (Klein and Lee 2006 ). For any given goal self-set by individuals, the more committed they are to attaining it, the better their performance is likely to be. Because employees are permitted to select their own goals in our setting, we expect a positive association between goal commitment and performance, controlling for the effects of goal difficulty on performance
- 31. predicted by H3. Our prediction, stated in the alternative form, is as follows: H4: There will be a positive association between employee goal commitment and performance. Reward Type and Performance Jointly, H1 and H3 indicate that providing cash rewards for goal attainment will lead to higher performance than providing tangible rewards through their effects on the difficulty of the selected goals. However, H2 and H4 suggest a performance advantage for tangible rewards through their effect on goal commitment. Given these competing effects, the overall impact of reward type on performance is likely to depend on the strength of the goal difficulty effect relative to the goal commitment effect. If equal in strength, then these effects could also be offsetting, resulting in similar performance levels for employees eligible for tangible versus cash rewards. Because we do not have a theoretical basis for predicting whether the goal difficulty effect or the goal commitment effect will be stronger, we pose the following null hypothesis:
- 32. H5: There will be no difference in the performance of employees eligible for tangible rewards compared to those eligible for cash rewards. While H5 considers the performance effects of reward type across goal levels, the theory underlying H2 leads us to expect there will be performance differences within each goal level. Specifically, we anticipate that, once the goal has been selected, and because employees eligible for tangible rewards will be more committed to the goal, they will outperform those eligible for cash rewards. Our final prediction, stated in the alternative form is: H6: Within goal level, employees eligible for tangible rewards will perform better than those eligible for cash rewards. Our predictions and other expected relations are summarized in the Figure 1 model. 10 10 Figure 1 includes three paths to control for other known antecedents of goal-setting and commitment. Research shows a positive association between prior performance and both the difficulty of self-set goals and current performance, so we include each path (Locke and Latham 1990). Also, research shows a negative association between goal difficulty and expectancy so we include a path between goal difficulty and commitment (Klein 1991).
- 33. 1812 Presslee, Vance, and Webb The Accounting Review September 2013 III. RESEARCH SETTING AND METHOD Research Site We conducted our research at five call center locations of a Fortune 100 financial services company over a two-month period (May and June). We gained access to the Company through contacts at the Firm that was helping them develop and implement employee reward programs. The call centers were in diverse geographic locations throughout North America and Company management indicated that the five participating call centers are representative of the 18 centers they operate; given their genuine interest in understanding the effects of cash versus tangible rewards on goal selection and performance, we have no reason to doubt their assertion regarding the appropriateness of the locations. The primary responsibility of call center employees was collecting overdue credit card balances
- 34. from clients. Their key performance metric was E-pay Usage, calculated as the number of customer promises to pay immediately (or soon) via an electronic transfer of funds divided by the number of customer promises to pay via another method (e.g., in person at a branch). Management chose this metric because they believed it would motivate the desired behavior by employees to secure immediate reductions in overdue customer balances. Moreover, they believed employees would easily understand the metric and would be able to readily assess their progress in attaining the selected goal. Although some factors affecting E-pay Usage performance are uncontrollable by employees (e.g., the financial ability of a customer to make a payment), persuading clients with overdue balances to perform an electronic transfer is sensitive to both ability (e.g., identifying tactics that will work with a particular client) and effort (e.g., persistence). As a result, the task setting is one in which employees can develop expectations about attainable levels of performance and thus make reasonably informed choices when selecting a performance goal. FIGURE 1 Hypothesized Model
- 35. a Reward Type is coded 0 when the observation is in the tangible reward system, and 1 when in the cash system. The Effects of Reward Type on Employee Goal Setting, Goal Commitment, and Performance 1813 The Accounting Review September 2013 May and June Incentive Schemes In May employees received a reward associated with attaining a particular level of performance. The performance levels in May were expressed as a percentage of a call-center- specific baseline E-pay Usage target: 105 percent, 110 percent, 115 percent, 125 percent, and 140 percent, with rewards of $100, $200, $400, $600, and $1,000, respectively. Each baseline performance target incorporated location-specific factors such as client characteristics (e.g., average amount or age of the overdue balances) and economic conditions. 11 Employees did not self-select a performance goal in May, instead reward receipt was based
- 36. strictly on their actual level of performance (if actual E-pay Usage performance was 114 percent of target, then a $200 reward was earned; 126 percent earned $600, and so on). At the beginning of June, Company management at each call center used actual results from May to set a new baseline target for E-pay Usage. Company management also worked with the Firm to establish three E-pay Usage goals and reward payout amounts for use in an employee goal- setting program in June. The goals were 105 percent, 110 percent, and 125 percent of the baseline target with reward values of $100, $350, and $1,000, respectively. These values represent 3 percent, 10 percent, and 30 percent, respectively, of the average monthly employee salary, which is in keeping with prior research showing bonus payouts ranging from 5 percent to 22 percent of salary (Anderson et al. 2010). 12 At the beginning of June, employees each self-selected one of the performance goals and received the corresponding reward if the performance goal was achieved, but no reward otherwise. No additional rewards were provided for performance in excess of the
- 37. selected goal. 13 Independent Variable Working with the Company and the Firm, we manipulated reward type at the call center level; employees at two of the call centers all received cash, while employees at three other call centers all received ‘‘points’’ redeemable for various rewards listed at retail price in a 112-page catalog. Employees were not told that different types of rewards were being used at different call centers. The value of the points to employees was intended to be equivalent to the cash payouts for the three goal-levels described above (e.g., $100 in cash versus $100 in purchases at retail value from the catalog). Prior to selecting a goal, employees in the tangible award condition were told the value of the points awarded at each level and given the catalog to review. Items in the catalog were diverse, ranging in retail price from approximately $30 to $1,000 and including items such as popcorn makers, bicycles, barbecues, video cameras, and travel vouchers. 14
- 38. Moreover, the Firm worked with the Company in generating attractive higher-value reward alternatives (e.g., televisions, travel vouchers) to reduce the likelihood that goal selection in the tangible reward condition would be influenced by a lack of choice (i.e., employees would choose 11 Baseline E-pay Usage targets ranged from 0.60 (0.65) to 1.80 (1.93) in May (June). 12 Average monthly employee salary is approximately $3,300; we discuss this measure further in Section IV. 13 Employees were free to select whichever goal they wished and were not required to discuss their choice with center management prior to goal selection. Center management did become aware of the goals once selected by each employee, but to our knowledge did not attempt to influence the goal selection process in any way. 14 Discussions with the Firm indicate that the values listed in the rewards catalog were intended to approximate retail value with no systematic under- or over-pricing of items. Thus, from the employees’ perspective at each goal level, the dollar value of cash and the retail value of available tangible rewards is intended to be equal. It is possible that discounts related to bulk purchasing by the Firm may have been passed on to the Company, lowering the total reward costs for tangible goods. We have no
- 39. information related to the provision of any such ‘‘discounts,’’ but the Company’s actual cost of the tangible versus cash reward schemes is beyond the scope of our study. 1814 Presslee, Vance, and Webb The Accounting Review September 2013 less difficult goals simply because they did not like the higher- value reward options). Importantly, reward type was held constant for May and June at all call centers; employees who received a cash (tangible) bonus in May also received a cash (tangible) bonus in June. This approach avoided confounding June results with a change in reward type. In May, E-pay Usage did not differ between employees at call centers receiving a cash reward versus those receiving points with an equivalent cash value. Variable Measurement Management provided us with the June goals selected by employees, which we code as an ordinal variable labeled June Goal Level: 1 ¼ 105 percent of unit target; 2 ¼ 110 percent of unit target; and 3 ¼ 125 percent of unit target. Within minutes of
- 40. using the Company’s computerized system to select a June goal, employees completed an online questionnaire that included a measure of commitment to the chosen goal. Based on Klein et al. (2001), we employ the five-item goal commitment measure detailed in Appendix A. Employees indicated their extent of agreement with each item using a five-point scale with endpoints labeled ‘‘strongly disagree’’ (1) and ‘‘strongly agree’’ (5). Confirmatory factor analysis (not tabulated) shows the five items represent a unidimensional construct with all loadings greater than 0.7, an eigenvalue of 2.9, and 59 percent of variance explained (Stevens 1996 ). 15 This variable is labeled June Goal Commitment. Our primary employee performance measure is actual E-pay Usage scaled by the corresponding center-specific baseline E-pay Usage target because of differences in these targets across locations. We label the resultant measure June Percent-to-Target, which is calculated as: June Actual Employee E-pay Usage 4 June Center Baseline Target E-pay Usage. We also use this approach to calculate our measure of May performance: May Percent-to-Target ¼ May Actual Employee E-pay Usage 4 May Center Baseline Target E-pay Usage. Given the nature of the incentive scheme, employees have an incentive to
- 41. meet but not beat their chosen goal since no additional rewards are earned for performance in excess of the goal. Thus, within a given June Goal Level, goal attainment is likely to be more sensitive to the impact of reward type than June Percent-to-Target since the incentive scheme is likely to induce actual performance to cluster around the selected goal. Accordingly, our primary test of H6 uses goal attainment (June Attained) as the dichotomous dependent variable rather than June-Percent-to- Target. Our survey included several questions to evaluate whether reward type affected employees’ mental accounting and hedonic experience as expected in H1 and H2. 16 To evaluate whether tangible rewards appear to be ‘‘recorded’’ in a separate mental account, we asked participants about the degree to which they would consider any rewards earned as separable from other income (Separate). To evaluate whether tangible rewards will result in a stronger hedonic experience, we asked employees about the extent to which they would frequently think about their reward while working (Think). Finally, to assess the social recognition
- 42. potential of tangible rewards we asked employees about the degree to which they would want others to know about any reward received (Others Know). 15 Scale reliability is also acceptable with a Cronbach’s alpha of 0.82 (Nunnally 1994 ). 16 Employees indicated their level of agreement with each of these items using a five-point scale. Appendix A provides the wording of each item. The Effects of Reward Type on Employee Goal Setting, Goal Commitment, and Performance 1815 The Accounting Review September 2013 IV. RESULTS Descriptive Results and Analysis Approach In total, 911 employees worked at the five call centers included in our study and 627 (69 percent) completed our questionnaire. Of these, 53 were dropped because they did not work in May, which is required since we use prior performance as a variable in our Figure 1 model (Bandura
- 43. 1997; Locke and Latham 1990). 17 We dropped four additional employees because the data provided by management did not indicate the goal they selected in June. This leaves 570 employees (63 percent response rate) in the final data set used to test our predictions. 18 Because the Company selected the call centers that would receive tangible (n ¼3) versus cash (n ¼ 2) rewards rather than allowing us to randomly assign employees to reward conditions, we compare the available employee demographic variables across the two sets of centers to assess their similarity. The variables and, where applicable, the response scale used in collecting the data are shown in Appendix A, Panel C. 19 We report results for each measure in Table 1, Panel A. Analysis (not tabulated) shows that employees’ gender, age, experience at the call center, and income level do not differ across the locations receiving tangible versus cash rewards (all p-values . 0.35). Moreover, we find no significant differences in the total number of hours worked by employees
- 44. across the two reward conditions either in May or June (both p- values . 0.30). Finally, discussions with Company management indicate that the primary task performed by all employees during the time of our study was the collection of overdue credit card balances and there are no appreciable differences in managerial style at any of the centers. Based on the available evidence, we conclude that employee demographics and other factors that might impact performance levels are comparable across the tangible versus cash reward conditions. 20 Table 1 also presents descriptive data for the main variables in our model and the related process measures. Panel B includes the percentage and number of employees in each Reward Type condition, by the June Goal Level selected. Panel C shows the average level of June Goal Commitment in each Reward Type condition, by June Goal Level. Panel D reports employees’ responses to our questions about mental accounting and hedonic attitudes by Reward Type and Panel E presents June Percent-to-Target by Reward Type condition and June Goal Level. Table 2 provides the correlation matrix for the main variables used in our study. 21
- 45. 17 Prior performance captures individual differences in ability and effort, which are important to control for in isolating the effects of reward type on goal selection, commitment, and current performance (Luft and Shields 2003). 18 Webb et al. (2010) report data for 452 of these employees with respect to prior performance, goal difficulty, and current performance. Data for the remaining 118 employees were not included in Webb et al. (2010) nor does their model include our primary independent variables Reward Type and June Goal Commitment. Webb et al. (2010) examine the effects of impression management intentions, employee experience, and prior bonus eligibility on employee goal-setting behavior; controlling for the effects of these variables does not affect the inferences reported below. 19 Management expressed concern that employees might be sensitive to questions asking for their specific level of experience or income level, hence our use of multi-category response scales for these items. Employees were also given the option to not respond to any of the demographic questions. In all cases our sample size is less than 570. 20 We also calculate intra-class correlations (ICC ) for our main dependent variables to assess differences across centers relative to differences within centers (Kreft and De Leeuw 1998). The ICC values are: June Goal Level¼ 0.12; June Goal Commitment ¼ 0.02; and June Percent-to-
- 46. Target ¼ 0.005. Consistent with our analysis of demographic and other variables, the ICC values suggest that a relatively small portion of the variance in our main dependent variables is attributable to center-specific factors. 21 Kurtosis and skewness for all variables (observed and latent) are below maximum acceptable levels of 10 and 3, respectively, indicating that the univariate normality assumption required to use SEM is not violated (Kline 2011). We allow the exogenous variables of Reward Type and May Percent-to-Target to covary. 1816 Presslee, Vance, and Webb The Accounting Review September 2013 TABLE 1 Descriptive Data Panel A: Employee Characteristics Reward Type Gender a Frequency (%) Means (Standard Deviations)
- 47. Hours Worked Male Female Age a Experience a Income a May June Tangible 103 205 33.9 2.8 1.06 128.8 125.2 (33.4) (66.6) (12.3) (1.6) (0.3) (27.0) (28.9) n ¼ 291 n ¼ 302 n ¼ 265 n ¼ 338 n ¼ 338 Cash 76 140 33.2 2.6 1.05 131.1 124.6 (35.2) (64.8) (11.5) (1.6) (0.2) (26.1) (27.9) n ¼ 176 n ¼ 204 n ¼ 180 n ¼ 232 n ¼ 232 Overall 179 345 33.6 2.7 1.06 129.7 124.9 (34.2) (65.8) (12.0) (1.6) (0.3) (26.6 ) (28.4) n ¼ 467 n ¼ 506 n ¼ 445 n ¼ 570 n ¼ 570 Panel B: Percent (Number) of Total Employees Selecting Each June Goal Level (n ¼ 570) Reward Type June Goal Level
- 48. b 1*** 2** 3*** Total Tangible 42% 38% 20% 100% (143) (128) (67) (338) Cash 17% 47% 36% 100% (39) (108) (85) (232) Total 32% 41% 27% 100% (182) (236) (152) (570) Panel C: Mean (Standard Deviation) June Goal Commitmentc (n ¼ 570) Reward Type June Goal Level 1 2* 3*** Average*** Tangible 2.19 2.13 2.06 2.14 (0.66) (0.63) (0.83) (0.69) Cash 2.20 1.98 1.75 1.93 (0.63) (0.74) (0.67) (0.72) Average 2.19 2.06 1.88 2.05 (0.65) (0.68) (0.76) (0.70)
- 49. (continued on next page) The Effects of Reward Type on Employee Goal Setting, Goal Commitment, and Performance 1817 The Accounting Review September 2013 We use Stata 12.0 to estimate the hypothesized structural equation model (SEM) depicted in Figure 1, adjusting all standard errors and associated significance levels for clustering that results from the five distinct call center locations in our data (Peterson 2008). 22 We use the full information maximum likelihood estimation method to test the SEM, where all of our variables are observed with the exception of the latent construct, June Goal Commitment. We report the results of our structural model in Figure 2 and Table 3. The Chi-square value of our model is significant (v2(22)¼ TABLE 1 (continued) Panel D: Mean (Standard Deviation) Mental Accounting and Hedonic Measuresd
- 50. Reward Type Measure Separate*** (n ¼ 562) Think*** (n ¼ 563) Others Know (n ¼ 562) Tangible 2.31 2.99 2.73 (0.93) (1.08) (0.99) Cash 2.00 2.24 2.63 (0.86) (1.01) (1.14) Panel E: Mean (Standard Deviation) June Percent-to-Targete (n ¼ 570) Reward Type June Goal Level 1 2 3 Average** Tangible 105% 114% 132% 114% (20%) (21%) (28%) (24%) Cash 104% 111% 135% 119%
- 51. (23%) (29%) (32%) (32%) Average 105% 113% f 134% 116% (21%) (25%) (31%) (28%) *, **, *** Where indicated, differences between reward conditions are significant at , 0.10, , 0.05, and , 0.01, respectively. a Data collected via an online survey conducted immediately after employees selected their June goal level. Observations are less than 570 because of missing data (employees were not required to complete the survey for any of these questions). See Appendix A, Panel C for a description of the measures used. b To achieve June Goal Level 1, June Goal Level 2, and June Goal Level 3 employees must achieve a June Percent-to- Target of 105 percent, 110 percent, and 125 percent, respectively. c Mean June Goal Commitment is the average self-reported response to our five-item goal commitment questionnaire with each question measured on a five-point scale (Appendix A, Panel A). d Separate, Thought, and Others Know are based on the responses to items one to three in Appendix A, Panel B, as
- 52. measured on a five-point scale. e June Percent-to-Target is calculated as employees’ June E-pay Usage (the ratio of employees’ collected promises to pay via online payment divided by their collected promises to pay via all other methods for the month of June) divided by call-center performance target. f Across reward conditions, June Percent-to-Target for June Goal Level 2 differs from June Goal Level 1 and June Goal Level 3 (both p-values , 0.01). 22 All reported significance levels are two-tailed. 1818 Presslee, Vance, and Webb The Accounting Review September 2013 64.067, p , 0.01). 23 The root mean square error of approximation (RMSEA) value is 0.058, the comprehensive fit index (CFI) is 0.971, and the Normed Fit Index (NFI) is 0.957. We conclude that our model fits the data well, explaining 41 percent of the variance in June Percent-to-Target (Browne and Cudeck 1993; Kline 2011).
- 53. Hypotheses Tests H1 predicts that cash rewards will lead employees to select more difficult goals than tangible rewards of an equivalent retail value. The descriptive results presented in Table 1, Panel B are consistent with our expectation. Significantly (v2 ¼ 41.15, p , 0.01) fewer employees in the cash reward condition (17 percent) selected the easiest goal compared to the tangible reward condition (42 percent). Conversely, 36 percent of employees in the cash reward condition selected the most difficult goal while only 20 percent in the tangible reward condition chose the most difficult goal (v2 ¼ 19.89, p , 0.01). The results in Table 3 and Figure 2 support H1, showing that the standardized path coefficient from Reward Type (0 ¼ tangible reward; 1 ¼ cash reward) to June Goal Level is positive and significant (Table 3; b ¼ 0.26; p , 0.01); on average, employees pursuing cash rewards selected more difficult goals than those pursuing tangible rewards. We also find that employees’ past performance (May Percent-to-Target) is positively associated with June Goal Level (Table 3; b ¼ 0.44; p , 0.01). This is consistent with expectancy theory in that better performers in May would have higher performance expectations for June, leading them to select more challenging goals (Klein 1991).
- 54. H2 predicts that employees eligible for tangible rewards will be more committed to their chosen goal than employees eligible for cash rewards. The results in Table 1, Panel C are consistent with H2; across all June Goal Levels average June Goal Commitment is significantly higher in the tangible (l¼2.14) versus cash condition (l¼1.93) (t¼3.50; p , 0.01). Comparisons by goal level show that the commitment of employees’ eligible for tangible compared to cash rewards is not significantly different for June Goal Level 1 (t¼0.13; p¼0.90), is marginally higher for June Goal Level 2 (t ¼ 1.70; p ¼ 0.09) and is significantly higher for June Goal Level 3 (t ¼ 2.56; p , 0.01). The results in Figure 2 and Table 3 support H2; the standardized path coefficient from Reward Type TABLE 2 Correlation Matrixa Reward Type June Goal Level June Goal Commitment May Percent- to-Target June Percent-
- 55. to-Target Reward Type 1 June Goal Level 0.272*** 1 June Goal Commitment �0.145*** �0.164*** 1 May Percent-to-Target 0.032 0.459*** �0.118** 1 June Percent-to-Target 0.082** 0.390*** �0.136*** 0.622*** 1 **, *** Indicates p , 0.05 and p , 0.01, respectively, all p-values are two-tailed. a n ¼ 570 See Figure 2 and Table 1 for variable definitions. 23 Although the Chi-square statistic is significant, it has been shown to be highly sensitive to large sample sizes such as ours (Byrne 2001). The Effects of Reward Type on Employee Goal Setting, Goal Commitment, and Performance 1819 The Accounting Review September 2013 to June Goal Commitment is negative and significant (Table 3; b¼�0.12; p ¼0.05). We also find that June Goal Level is negatively associated with June Goal Commitment (Table 3; b¼�0.15; p¼ 0.05). This is consistent with prior research showing that more difficult goals lead to a lower
- 56. expectancy of goal attainment, which in turn results in lower goal commitment (Klein 1991). 24 FIGURE 2 Structural Equation Model Results **, *** Indicates p , 0.05 and p , 0.01, respectively. All p- values are two-tailed. n ¼ 570 and the figure reports only the significant standardized path coefficients. Model fit statistics include: v2 (22) ¼ 64.067 ( p , 0.01); CFI ¼ 0.971; NFI ¼ 0.957; and RMSEA ¼ 0.058. The exogenous variables of Reward Type and May Percent-to- Target were allowed to covary. All standard errors have been adjusted for clustering using the ‘‘cluster robust’’ adjustment procedure in Stata. a Reward Type is coded 0 when the observation is in the tangible reward system, and 1 when in the cash reward system. b May Percent-to-Target is calculated as May E-pay Usage 4 May Center Target. May E-pay Usage is calculated as the ratio of employees’ collected promises to pay via online payment divided by their collected promises to pay via all other methods for the month of May. May Center Target is specific to call center location and controls for potential differences in client base and socio-economic conditions. c June Goal Level takes the value of 1, 2, or 3 for easy, moderate, or difficult goals, respectively. d June Goal Commitment is a latent variable determined by employees’ responses to a five-item goal commitment measure (Appendix A, Panel A).
- 57. e June Percent-to-Target is calculated as June E-pay Usage 4 June Center Target. June E-pay Usage is calculated as the ratio of employees’ collected promises to pay via online payment divided by their collected promises to pay via all other methods for the month of June. 24 As an alternative means of evaluating the paths related to H1 and H2, we use a multi-level modeling approach where the structure is 570 observations (Level 1) nested within five call centers (Level 2). This permits an assessment of the impact of including the random effects of Center (n ¼ 5) in Level 2 on the coefficients and standard errors for Reward Type (Kreft and De Leeuw 1998). Results (not tabulated) yield inferences related to H1 and H2 that are almost identical to those attained from the reported analysis using clustered robust standard errors. The only difference of note is that the effect of Reward Type on June Goal Level becomes slightly weaker ( p ¼ 0.03). 1820 Presslee, Vance, and Webb The Accounting Review September 2013 Next we examine results for the three measures used to evaluate the validity of our reasoning underlying H1 and H2. Recall that for H1 we expect that employees eligible to receive tangible rewards will mentally account for them differently (separately)
- 58. than those eligible to receive cash. To evaluate this, we analyze responses to our measure of the extent to which employees consider the reward for goal attainment as separate from other income (Separate). Consistent with our expectation, results in Table 1, Panel D show that the mean for Separate is higher in the tangible condition (l¼2.31) than in the cash condition (l¼2.00) and the difference is significant (t¼4.04, p , 0.01). The difference between reward conditions is also significant within each goal (all p- values , 0.10). Also as expected, the correlation between Separate and June Goal Level is negative and significant (r ¼ �0.12; p , 0.01). Overall, these results are consistent with our mental accounting based expectation that tangible rewards are more likely to be thought of as separate from other income. To assess the extent to which our H2 results are related to the greater hedonic experience and potential for social recognition generated by tangible rewards, we examine employee responses regarding the extent to which they: (1) expected to Think frequently about the reward during June; and (2) would be happy that Others Know about the reward if
- 59. received. Descriptive statistics for the two measures are summarized in Table 1, Panel D. Think is significantly higher in the tangible (l¼ 2.99) versus cash reward (l¼ 2.24) condition (t ¼ 8.33; p , 0.01) but the mean for Others Know does not differ significantly between conditions (t ¼ 1.14; p ¼ 0.25). We also analyze employee responses to Think and Others Know, separately within each goal level. Results (not tabulated) show that for each goal level, Think is significantly higher in the tangible reward TABLE 3 Structural Model Estimatesa Standardized Estimates Standard Errorb p-valuec R2 Paths Reward Type ! June Goal Level 0.26 0.09 ,0.01 Reward Type ! June Goal Commitment �0.12 0.06 0.05 June Goal Level ! June Percent-to-Target 0.12 0.03 ,0.01 June Goal Commitment ! June Percent-to-Target �0.07 0.04 0.12 May Percent-to-Target ! June Goal Level 0.44 0.05 ,0.01 May Percent-to-Target ! June Percent-to-Target 0.56 0.06 ,0.01 June Goal Level ! June Goal Commitment �0.15 0.08 0.05
- 60. Reward Type ! June Percent-to-Target 0.02 0.02 0.36 Dependent Measures June Goal Level 26.4% June Goal Commitment 4.5% June Percent-to-Target 40.6% a n ¼ 570. Model fit statistics include: v2 (22) ¼ 64.067 ( p , 0.01); CFI ¼ 0.971; NFI ¼ 0.957; and RMSEA ¼ 0.058. b Robust standard errors are adjusted for five clusters due to employees being drawn from five unique call center locations. c p-values are shown as two-tailed. See Figure 2 for variable definitions. The Effects of Reward Type on Employee Goal Setting, Goal Commitment, and Performance 1821 The Accounting Review September 2013 condition (all p-values , 0.01). 25 The only significant difference in Others Know is for goal level 3 (tangible l¼2.98; cash l¼2.43; t¼2.95, p , 0.01). To the extent
- 61. Others Know is a proxy for rewards-based social recognition, it is reasonable to expect this effect to be strongest for the largest payout. Finally, there is a significant positive correlation between June Goal Commitment and both Think (r ¼0.44, p , 0.01) and Others Know (r ¼0.36, p , 0.01). Overall, these results provide considerable evidence that tangible rewards generate a stronger hedonic experience than cash, which in turn is positively associated with employee goal commitment. H3 predicts that there will be a positive association between the difficulty of the goals selected and performance. The descriptive statistics presented in Table 1, Panel E show that across reward types, June Percent-to-Target increases with goal difficulty: employees who chose the easiest goal had June Percent-to-Target of 105 percent compared to 113 percent for those who selected the moderate goal difficulty, and 134 percent for employees who selected the most difficult goal. The increases in performance between June Goal Level 1 and June Goal Level 2 (t ¼ 3.34; p , 0.01) and between June Goal Level 2 and June Goal Level 3 (t ¼ 7.44; p , 0.01) are significant. Moreover, as shown in Figure 2 and Table 3, consistent with H3, the standardized path coefficient from June Goal Level to June Percent-to-Target is positive and significant (Table 3; b¼0.12; p ,
- 62. 0.01). 26 H4 predicts a positive association between employee goal commitment and performance. Contrary to our expectations, the results in Table 3 show that the association between June Goal Commitment and June Percent-to-Target is not statistically significant (Table 3, b ¼�0.07; p ¼ 0.12). Although speculative, this may relate to the fact that we were only permitted to measure goal commitment once, immediately after employee goal selection. It is possible that for lower performing employees, goal commitment decreased as it became evident during the month that they were unlikely to attain their chosen goal level. If goal commitment changed over time, then this would help explain why we do not find the predicted association with performance using our initial measure. We also find that May Percent-to-Target has a significant and positive direct effect on June Percent-to-Target (Table 3; b ¼ 0.56; p , 0.01) indicating that incremental to the effects of June Goal Level, employees who performed well in May also tended to perform well in June. H5 examines the association between reward type and June performance given the competing effects via goal difficulty (H1) and goal commitment (H2). To
- 63. evaluate H5, we first compare the means for June Percent-to-Target across goal levels for the two reward conditions. As shown in Table 1, Panel E, average June Percent-to-Target is greater for employees eligible for cash rewards than those eligible for tangible rewards (119 percent versus 114 percent; t ¼ 1.96, p ¼ 0.05). Next, we regress June Percent-to-Target on Reward Type and May Percent-to-Target, excluding June Goal Level and June Goal Commitment; the results are summarized in Table 4, Panel A. May Percent-to-Target is significantly associated with June Percent- to-Target (b¼ 0.62; p , 0.01) but Reward Type is not (b¼0.06; p¼0.21). Thus we fail to reject the H5 null hypothesis. This result, in conjunction with those reported above for H1 and H3, indicate that the effects of Reward Type on June Percent-to-Target are indirect, working via the selected June Goal Level. To test the significance of these indirect effects, we ran our Figure 1 model excluding June Goal Commitment. 25 Finding a significant difference between reward conditions for Separate and Think for both the easy ($100 payout) and difficult ($1,000 payout) goals represents more convincing evidence about the mental accounting effects and hedonic experience generated by tangible rewards. That is, it seems less likely that small tangible rewards ($100) would be thought of as separate from other income, or more often, compared to cash. It seems more likely that large cash rewards ($1,000) would be similarly thought of as separate from other income, or more often, relative to tangible rewards.
- 64. 26 We acknowledge that the results related to H3 are intuitive given that both goal selection and the related effort choices are endogenous to the employee. 1822 Presslee, Vance, and Webb The Accounting Review September 2013 Results (not tabulated) show that the standardized coefficient for the indirect effects of Reward Type and June Goal Level is positive and marginally significant (b ¼ 0.02; p ¼ 0.07).27 Our final prediction (H6) is that within goal level, employees eligible for tangible rewards will perform better than those eligible for cash rewards. We evaluate this hypothesis using separate logistic regressions for each goal level with June Attained as the dependent variable (0 ¼ did not attain; 1¼attained), Reward Type and May Percent-to-Target as independent variables. Univariate TABLE 4 Effects of Reward Type on Performancea Panel A: Overall Effect of Reward Type on June Percent-to- Target (n ¼ 570)
- 65. June Percent-to-Targeti ¼ ½ai�þ b1Reward Typei þ b2May Percent-to-Targeti þ ei: Standardized Coefficient Standard Error b t-statistic p-value Reward Type 0.06 0.02 1.50 0.21 May Percent-to-Target 0.62 0.07 8.45 , 0.01 Adjusted R 2 38.8% Panel B: Goal Attainment Percentage by Reward Type and June Goal Levelb Reward Type June Goal Level 1 2** 3 Tangible 48.9% 60.1% 61.2% Cash 51.3% 44.4% 58.8% Overall 49.4% 53.0% 59.9% Panel C: Logistic Regression—Effects of Reward Type on June Goal Attainmentc,d
- 66. June Attainedi ¼ ½ai�þ b1Reward Typei þ b2May Percent-to- Targeti þ ei: Coefficient Standard Error e z-statistic p-value Reward Type �0.35 0.16 �2.22 0.03 May Percent-to-Target 5.97 1.59 4.11 ,0.01 Pseudo R 2 21.1% a See Figure 2 for variable definitions. b Where indicated, ** indicates that a Chi-squared test of association shows a significant difference in attainment rates between reward conditions at a significance level of p , 0.05. c June Goal Level 2 (Moderate, n ¼ 236). d June Attained: 0 ¼ did not attain June Goal Level; 1 ¼ attained June Goal Level. e Robust standard errors are adjusted for five clusters due to employees being drawn from five unique call center locations.
- 67. 27 For the reduced Figure 1 model excluding June Goal Commitment, we use Stata 12.0 to generate the standardized coefficient and p-value for the indirect effect of Reward Type on June Percent-to-Target through June Goal Level, using the clustered robust procedure for center location to adjust all standard errors. The Effects of Reward Type on Employee Goal Setting, Goal Commitment, and Performance 1823 The Accounting Review September 2013 results in Table 4, Panel B show that the only significant difference in attainment rates between reward conditions is for June Goal Level 2, where employees eligible for tangible rewards attained their goals about 60 percent of the time compared to 44 percent for employees eligible for cash (v2 ¼ 5.80, p ¼ 0.02). Consistent with this, the logistic regression in Panel C indicates that for June Goal Level 2, the coefficient for Reward Type is significant and negative (b¼�0.35; p¼0.03); the coefficient for May Percent-to-Target is positive and significant (b ¼ 5.97; p , 0.01). However, results for June Goal Levels 1 and 3 (not tabulated) show that Reward Type is not significantly associated with June Attained ( p ¼ 0.42 and p ¼ 0.91, respectively). Thus, for the highest and lowest goal levels, employees eligible to receive tangible rewards were no more likely to attain their
- 68. goal than those receiving cash rewards. Overall we find only limited support for H6. 28 Supplementary Analysis Expectancy of Goal Attainment, Reward Type, and Performance Goal theory suggests that linking rewards to goal attainment is more likely to motivate effort when individuals have a reasonable expectancy of achieving the goal (Klein 1991). So, to the extent that cash and tangible rewards have different effects on performance, we are more likely to observe them for those employees with more than a minimal expectancy of goal attainment. We explore this possibility by dropping the bottom 5 percent of June performers (based on June Percent-to-Target) as these individuals are likely to have the lowest expectancy of attaining their selected goal. On average, these 30 employees have June Percent-to-Target of 69 percent, which is nearly two standard deviations below the average performance of the other 540 employees. These bottom performers also fell short of their selected goal by an average of over 40 points, while the remaining 540 employees averaged approximately six points above their goal. Descriptive statistics (not
- 69. tabulated) for the 30 excluded employees indicate little difference in June Percent-to-Target across the three goal levels or across the reward conditions. 29 This is consistent with poor-performing individuals not being motivated by either the goals they chose or the rewards they were eligible to receive for goal attainment. To assess whether reward type affects performance for the subsample of 540 employees with a higher expectancy of goal attainment, we regress June Percent- to-Target on Reward Type and May Percent-to-Target. As shown in Table 5, Panel A, the coefficient for Reward Type is positive and marginally significant (b ¼ 0.10, p ¼ 0.06).30 Incrementally removing more low performers (e.g., bottom 10 percent, bottom 20 percent) results in a reasonably monotonic increase (decrease) in the coefficient ( p-value) for Reward Type. Overall, this result is consistent with cash rewards having a positive impact on performance for employees with a reasonable expectancy of attaining their selected goals. 28 Results from OLS regressions (not tabulated) show that if June Percent-to-Target is used as the dependent variable instead of June Attained, then Reward Type is not
- 70. significant within any of the three goal levels (all p- values . 0.37 ). 29 Of the 30 low-performing employees, 11 (19) were in the tangible (cash) reward condition. June Percent-to- Target in the tangible (cash) condition is 71 percent (68 percent). Also, 12, 14, and 4 employees chose the easy, moderate, and difficult goals, respectively. June Percent-to- Target was 71 percent, 68 percent, and 67 percent for the easy, moderate, and difficult goals, respectively. Finally, on average these 30 employees worked approximately the same number of hours during June (l ¼ 115) as the other 540 employees (l ¼ 126 ). 30 Results (not tabulated) show that the overall effect of Reward Type on June Percent-to-Target for the reduced sample is partially mediated by June Goal Level. 1824 Presslee, Vance, and Webb The Accounting Review September 2013 TABLE 5 Supplemental Analysis—Reward Type, Performance, and Change in Performancea Panel A: Overall Effect of Reward Type on June Percent-to- Target—Excluding Bottom 5 Percent of June Performers (n ¼ 540)
- 71. June Percent-to-Targeti ¼ ½ai�þ b1Reward Typei þ b2May Percent-to-Targeti þ ei: Standardized Coefficient Standard Errorb t-statistic p-value Reward Type 0.10 0.02 2.54 0.06 May Percent-to-Target 0.59 0.07 7.84 0.01 Adjusted R 2 36.6% Panel B: Overall Effect of Reward Type on the Change in June Performance—Full Sample (n ¼ 570)c,d June Performance Changei ¼ ½ai�þ b1Reward Typei þ b2May Percent-to-Targeti þ b3June Target Change þ ei: Standardized Coefficient Standard Errorb t-statistic p-value Reward Type 0.08 0.02 2.32 0.08 May Percent-to-Target �0.41 0.04 �7.18 0.01 June Target Change �0.02 0.12 �0.98 0.38 Adjusted R 2
- 72. 17.0% Panel C: Mediated Effects of Reward Type on the Change in June Performance—Full Sample (n ¼ 570) June Performance Changei ¼ ½ai�þ b1Reward Typei þ b2June Goal Leveli þ b3May Percent-to-Targeti þ b4June Target Change þ ei:c;d Standardized Coefficient Standard Errorb t-statistic p-value Reward Type 0.04 0.01 1.79 0.15 June Goal Level 0.15 0.02 2.50 0.07 May Percent-to-Target �0.47 0.03 �11.12 0.01 June Target Change �0.04 0.09 �2.04 0.11 Adjusted R 2 18.8% a See Figure 2 for variable definitions. b Standard errors are adjusted for clustering resulting from employees being drawn from five unique call center locations. c June Performance Change ¼ (June Percent-to-Target � May Percent-to-Target) 4 May Percent-to-Target. d June Target Change ¼ June baseline E-pay Usage target �May baseline E-pay Usage target. The Effects of Reward Type on Employee Goal Setting, Goal Commitment, and Performance 1825
- 73. The Accounting Review September 2013 Change in Performance Company management implemented the June goal-setting program in the hopes of motivating improved performance. To explore the month-over-month performance effects of the June program, we create a new variable, June Performance Change, which equals ([June Percent-to-Target� May Percent-to-Target] 4 May Percent-to-Target) and regress it on Reward Type and May Percent-to- Target.31 We also include June Target Change (June Baseline Target E-pay Usage� May Baseline Target E-pay Usage) as an additional control variable because as noted above, all call centers increased the baseline target for E-pay Usage in June. Results reported in Table 5, Panel B indicate a marginally significant positive association between Reward Type and June Performance Change (b¼0.08; p¼0.08) suggesting that employees eligible for cash rewards showed a larger increase in performance from May to June. We also examine whether the effects of Reward Type on June Performance Change are mediated by June Goal Level. The results in Table 5, Panel C show that the coefficient for June Goal Level is positive and marginally significant (b¼0.15; p¼0.07) while Reward Type is no longer significant (b ¼ 0.04; p ¼ 0.15).32 Thus, the positive effect of cash
- 74. rewards on the change in June performance is fully mediated by their impact on the difficulty of the self-selected goals (Baron and Kenny 1986 ). Reward Type and Ability-Based Goal Selection An alternative interpretation of our results supporting H1 is that cash rewards are more effective at inducing an ability-based sorting of employees via June goal selection (Cadsby et al. 2007; Erikkson and Villeval 2008; Lazear 2000). 33 That is, when eligible for cash rewards that are increasing in goal difficulty, employees are more likely to consider and reveal their performance capabilities when selecting June goals, such that more capable employees choose more challenging goals. Alternatively, employees eligible for tangible rewards may not value them as highly as cash, and will be less willing to exert the incremental effort necessary to attain more difficult goals. 34 As a consequence, they will select easier goals. To evaluate the extent to which reward type may have
- 75. influenced the effectiveness of the ability-based sorting feature inherent to the menu of goals approach at the Company, we separately conduct ordered logistic regressions for each reward condition with June Goal Level as the dependent variable and May Percent-to-Target (our proxy for ability and effort) as the independent variable. Results (not tabulated) show that May Percent-to- Target has a positive and significant effect on June goal selection in both the tangible (b¼4.42; p , 0.01) and cash (b¼3.02; p , 0.01) reward conditions. In both reward conditions, the menu of goals approach appears to have induced a significant ability-based approach to goal selection. This finding is inconsistent with tangible rewards leading employees to place less reliance on their performance capabilities when choosing goals in June. The mental accounting framework used to develop our first hypothesis is compatible with the notion that tangible rewards may result in some reduction in the effectiveness of the sorting feature inherent to the menu of goals approach employed at our research site. That is, the loss aversion induced by the mental accounting for tangible rewards leads individuals to consider factors other 31 We scale by May Percent-to-Target because of the large range
- 76. of May performance (43 percent to 244 percent). 32 Results (not tabulated) show that June Goal Commitment is not significantly ( p ¼ 0.30) associated with June Performance Change when included in the Table 5, Panel C model. Thus, we omit June Goal Commitment to simplify the presentation and discussion of our results. 33 We thank an anonymous reviewer for suggesting the relevance of the menu of contracts literature to our setting. 34 Evidence reported earlier in support of H2 is consistent with employees finding tangible rewards more attractive than cash rewards. 1826 Presslee, Vance, and Webb The Accounting Review September 2013 than ability when choosing goals. However, we believe the results of our additional analysis provide persuasive evidence that tangible rewards did not override the ability-based sorting feature of the menu of goals approach used in our research setting. V. DISCUSSION AND CONCLUSIONS We employ a quasi-field experiment to compare the effects of
- 77. tangible versus cash rewards on employee goal-setting, goal commitment, and performance. Company management implemented a cash-based reward system at two call centers of their choosing and a tangible reward system at three others, where all employees self-selected a goal from a menu of three choices. Consistent with mental accounting and economic theory, employees eligible to receive tangible rewards selected less-challenging goals. Further, in keeping with our psychology- based prediction that the hedonic experience arising from tangible rewards increases goal attractiveness, we find that employees eligible for tangible rewards were more committed to achieving the self-selected goal. Ultimately, average performance was better among those receiving cash rewards, due to the significant positive effects on employee goal selection. In supplementary analysis, we find that for employees with a reasonable expectancy of goal attainment (i.e., excluding the bottom 5 percent of June performers) cash rewards had significant direct effects on performance. Also, cash rewards were positively associated with the change in
- 78. performance over the previous month, with this effect fully mediated by the impact of reward type on goal selection. Our only evidence consistent with tangible rewards being associated with better performance than cash is a higher rate of goal attainment among employees who selected the moderate goal. Our study makes several contributions to the goal-setting and incentive-contracting literatures. First, we build on limited prior research examining the performance effects of tangible versus cash rewards. The only studies in this area that we are aware of employ lab experiments and provide mixed evidence on the effectiveness of tangible rewards (Jeffrey 2009; Shaffer and Arkes 2009). To the best of our knowledge, we present the first archival evidence comparing the goal-setting and performance effects of cash versus tangible rewards. The majority of our results support cash rewards as leading to better performance in a setting where employees were able influence the difficulty of their performance goals. Given the increasing use of tangible rewards in practice and
- 79. the largely unsubstantiated claims about their motivational advantages, we believe this is an important finding relevant to designers of performance management systems (Aguinis 2009; Incentive Federation Inc. 2007; Jeffrey 2009). Second, we extend the goal theory framework of Locke and Latham (1990) by demonstrating that reward type influences the difficulty of self-selected goals and individuals’ commitment to attaining them. While prior studies show that linking monetary rewards to goal attainment can affect goal- setting behavior, ours is the first that we are aware of to show reward type also matters, holding constant the reward’s monetary value. Relatedly, the menu of goals with rewards increasing in goal difficulty used by the Company represents a unique form of participative goal-setting, which has received minimal attention in the management accounting literature (Webb et al. 2010). Our results show that, consistent with the menu of contracts literature, the Company’s approach induced an effective ability-based sorting of employee ‘‘type’’ regarding goal selection, which does not appear to have been substantively
- 80. attenuated by reward type. Finally, we illustrate a unique application of mental accounting theory in a setting involving goal-setting and performance-based rewards that has been of considerable interest to management accounting researchers for a considerable time (Luft and Shields 2003). While a few accounting studies have employed mental accounting theory, to our knowledge it has not been used in the context of participative goal-setting (e.g., Fennema and Koonce 2011; Jackson The Effects of Reward Type on Employee Goal Setting, Goal Commitment, and Performance 1827 The Accounting Review September 2013 2008; Jackson et al. 2010). We find strong support for our mental accounting-based prediction and hope this will provoke others to consider the applicability of the theory to similar settings. Like all studies, ours is subject to limitations that provide opportunities for future research. First, we only have access to data regarding the impact of reward type on goal-setting behavior for one month. It would be helpful to evaluate the extent to which
- 81. our findings generalize to multi-period settings where employees repeatedly work under the types of reward schemes used at the Company. For example, there may be a novelty factor associated with tangible rewards such that the differences relative to cash rewards that we document in goal selection and goal commitment diminish over time. Second, Company management assigned centers to reward conditions based on our input as to factors (e.g., employee characteristics, center management style) that should be as similar as possible across locations. Although our analysis of the available employee demographic measures and other data (hours worked, prior-month performance) suggests the centers were highly comparable, the lack of random assignment limits our ability to make causal inferences and we cannot completely rule out the possibility that unobserved center differences influenced goal selection and commitment. As such, future research employing lab experiments would be helpful in establishing the robustness of our results in a more controlled setting. Third, the maximum reward value in our setting was $1,000 but there is
- 82. evidence that organizations are using tangible rewards (e.g., travel) well in excess of that amount (Jeffrey et al. 2011). It is unclear whether the higher commitment to tangible rewards that we document would generalize to higher value rewards, or whether beyond some threshold, cash becomes more attractive because of its fungibility. Future research would be helpful in evaluating this possibility. Finally, Company management imposed limits on the number of process measures we could collect in our survey regarding the mental accounting and affective responses generated by the different rewards. Future research is needed in developing a more comprehensive set of process measures that would permit a fuller understanding of the basic mental accounting and affective response differences we observed in our setting. REFERENCES Aguinis, H. 2009. Performance Management. Second edition. Englewood Cliffs, NJ: Pearson Prentice Hall. Alonzo, V. 1996. The trouble with money. Incentive 170 (2): 26–31. Anderson, S., H. Dekker, and K. Sedatole. 2010. An empirical examination of goals and performance-to-
- 83. goal following the introduction of an incentive bonus plan with participative goal setting. Management Science 56 (1): 90–109. Bandura, A. 1997. Social cognitive theory of self-regulation. Organizational Behavior and Human Decision Processes 50: 248–287. Bonner, S., and G. Sprinkle. 2002. The effects of monetary incentives on effort and task performance: Theories, evidence, and a framework for research. Accounting, Organizations and Society 27: 303– 345. Browne, M., and R. Cudeck. 1993. Alternative ways of assessing model fit. In Testing Structural Equation Models, edited by K. A. Bollen, and J. S. Long, 136–162. Newbury Park, CA: Sage Publications. Brun, J., and N. Dugas. 2008. An analysis of employee recognition: Perspectives on human resources practices. The International Journal of Human Resource Management 19 (4): 716–730. Byrne, B. 2001. Structural Equation Modeling with AMOS: Basic, Concepts, Applications, and Programming. Mahwah, NJ: Lawrence Erlbaum Associates. Cadsby, B., F. Song, and F. Tapon. 2007. Sorting and incentive effects of pay for performance: An experimental investigation. The Academy of Management Journal 50 (2): 387–405. Camerer, C., and G. Loewenstein. 2004. Behavioral economics:
- 84. Past, present, and future. In Advances in Behavioral Economics, edited by C. Camerer, G. Loewenstein, and M. Rabin, 3–51. New York, NY: Princeton University Press. 1828 Presslee, Vance, and Webb The Accounting Review September 2013 http://dx.doi.org/10.1287/mnsc.1090.1088 http://dx.doi.org/10.1016/0749-5978(91)90022-L http://dx.doi.org/10.1016/0749-5978(91)90022-L http://dx.doi.org/10.1016/S0361-3682(01)00052-6 http://dx.doi.org/10.1080/09585190801953723 http://dx.doi.org/10.5465/AMJ.2007.24634448 Condly, S., R. Clark, and H. Stolvitch. 2003. The effects of incentives on workplace performance: A meta- analytic review of research studies. Performance Improvement Quarterly 16 (3): 46–63. Dhar, R., and K. Wertenbroch. 2000. Consumer choice between hedonic and utilitarian goods. Journal of Marketing Research 37 (1): 60–71. Erikkson, T., and M. C. Villeval. 2008. Performance-pay, sorting, and social motivation. Journal of Economic Behavior and Organization 68 (2): 412–421. Fennema, B., and L. Koonce. 2011. Mental accounting in financial reporting and voluntary disclosure. Journal of Accounting Literature 30: 1–29.
- 85. Fisher, J., S. Peffer, and G. Sprinkle. 2003. Budget-based contracts, budget levels, and group performance. Journal of Management Accounting Research 15 (1): 71–94. Ford, E., and M. Fina. 2006. Leveraging recognition: Noncash incentives to improve performance. Workspan 49 (11): 18–20. Henderson, P., and R. Peterson. 1992. Mental accounting and categorization. Organizational Behavior and Human Decision Processes 51: 92–117. Hollenbeck, J., and H. Klein. 1987. Goal commitment and the goal-setting process: Problems, prospects, and proposals for future research. Journal of Applied Psychology 72 (2): 212–220. Hollenbeck, J., C. Williams, and H. Klein. 1989. An empirical examination of the antecedents of commitment to difficult goals. Journal of Applied Psychology 74 (1): 18–23. Incentive Federation Inc. 2007. Federation Study 2007: A Study of the Incentive Merchandise and Travel Marketplace. Westfield, NJ: Incentive Federation Inc. Jackson, S. 2008. The effect of firms’ depreciation method choice on managers’ capital investment decisions. The Accounting Review 83 (2): 351–376. Jackson, S., T. Rodgers, and B. Tuttle. 2010. The effect of depreciation method choice on asset selling prices. Accounting, Organizations and Society 35: 757–774. Jeffrey, S. 2009. Justifiability and the motivational power of tangible noncash incentives. Human
- 86. Performance 22 (2): 143–155. Jeffrey, S., A. M. Dickinson, and Y. F. Einarsson. 2011. The Use of Reward and Recognition Awards in Organizations. Working paper, Monmouth University and Western Michigan University. Jeffrey, S., and V. Shaffer. 2007. The motivational properties of tangible incentives. Compensation and Benefits Review 39 (3): 44–50. Kahneman, D. 2003. A perspective on judgment and choice. American Psychologist 58: 697–720. Kahneman, D., and A. Tversky. 1979. Prospect theory: An analysis of decision under risk. Econometrica 47: 263–291. Kahneman, D., and A. Tversky. 1984. Choices, values, and frames. American Psychologist 39 (4): 341– 350. Klein, H. 1991. Further evidence on the relationship between goal setting and expectancy theories. Organizational Behavior and Human Decision Processes 49: 230–257. Klein, H., and S. Lee. 2006. The effects of personality on learning: The mediating role of goal setting. Human Performance 19 (1): 43–66. Klein, H., M. Wesson, J. Hollenbeck, and B. Alge. 1999. Goal commitment and the goal-setting process: Conceptual clarification and empirical synthesis. Journal of Applied Psychology 84 (6): 885–896.
- 87. Klein, H., M. Wesson, J. Hollenbeck, P. Wright, and R. DeShon. 2001. The assessment of goal commitment: A measurement model meta-analysis. Organizational Behavior and Human Decision Processes 85 (1): 32–55. Kline, R. 2011. Principles and Practice of Structural Equation Modeling. 3rd edition. New York, NY: Guilford Press. Kreft, I., and J. De Leeuw. 1998. Introducing Multi-Level Modeling. London, U.K.: Sage Publications. Lazear, E. 2000. The power of incentives. American Economic Review 90 (2): 410–414. Locke, E., and G. Latham. 1990. A Theory of Goal Setting and Task Performance. Englewood Cliffs, NJ: Prentice Hall. Locke, E., and G. Latham. 2002. Building a practically useful theory of goal setting and task motivation. American Psychologist 57 (9): 705–717. The Effects of Reward Type on Employee Goal Setting, Goal Commitment, and Performance 1829 The Accounting Review September 2013 http://dx.doi.org/10.1111/j.1937-8327.2003.tb00287.x http://dx.doi.org/10.1509/jmkr.37.1.60.18718 http://dx.doi.org/10.1509/jmkr.37.1.60.18718 http://dx.doi.org/10.1016/j.jebo.2007.10.003 http://dx.doi.org/10.1016/j.jebo.2007.10.003
- 88. http://dx.doi.org/10.2308/jmar.2003.15.1.51 http://dx.doi.org/10.1016/0749-5978(92)90006-S http://dx.doi.org/10.1016/0749-5978(92)90006-S http://dx.doi.org/10.1037/0021-9010.72.2.212 http://dx.doi.org/10.1037/0021-9010.74.1.18 http://dx.doi.org/10.2308/accr.2008.83.2.351 http://dx.doi.org/10.1016/j.aos.2010.09.004 http://dx.doi.org/10.1080/08959280902743659 http://dx.doi.org/10.1080/08959280902743659 http://dx.doi.org/10.1177/0886368707302528 http://dx.doi.org/10.1177/0886368707302528 http://dx.doi.org/10.1037/0003-066X.58.9.697 http://dx.doi.org/10.2307/1914185 http://dx.doi.org/10.1037/0003-066X.39.4.341 http://dx.doi.org/10.1016/0749-5978(91)90050-4 http://dx.doi.org/10.1207/s15327043hup1901_3 http://dx.doi.org/10.1037/0021-9010.84.6.885 http://dx.doi.org/10.1006/obhd.2000.2931 http://dx.doi.org/10.1006/obhd.2000.2931 http://dx.doi.org/10.1257/aer.90.2.410 http://dx.doi.org/10.1037/0003-066X.57.9.705 Long, R., and J. Shields. 2010. From pay to praise? Non-cash employee recognition in Canadian and Australian firms. International Journal of Human Resource Management 21 (8): 1145–1172. Luft, J., and M. Shields. 2003. Mapping management accounting research: Graphics and guidelines for theory-consistent empirical research. Accounting, Organizations and Society 28:169–249. McGraw, A. P., E. Shafir, and A. Todorov. 2010. Valuing
- 89. money and things: Why a $20 item can be worth more and less than $20. Management Science 56 (5): 816–830. Nunnally, J. C. 1994. Psychometric Theory. New York, NY: McGraw-Hill. O’Curry, S. 1999. Income Source Effects. Working paper, DePaul University. O’Curry, S., and M. Strahilevitz. 2001. Probability and mode of acquisition effects on choices between hedonic and utilitarian options. Marketing Letters 12 (1): 37– 49. Peltier, J., D. Schultz, and M. Block. 2005. Awards Selection Study Phase I: Preliminary Insights from Managers. Prepared for The Forum for People Performance Management and Measurement, Northwestern University. Peterson, M. 2008. Estimating standard errors in finance panel data sets: Comparing approaches. The Review of Financial Studies 22 (1): 435–480. Peterson, S., and F. Luthans. 2006. The impact of financial and nonfinancial incentives on business unit outcomes over time. Journal of Applied Psychology 91 (1): 156–65. Prelec, D., and G. Lowenstein. 1998. The red and the black:
- 90. Mental accounting of savings and debt. Marketing Science 17 (1): 4–28. Prendergast, C. 1999. The provision of incentives in firms. Journal of Economic Literature 37 (3): 7–63. Serino, B. 2002. Noncash awards boost sales compensation. Workspan 45 (8): 24–27. Shaffer, V., and H. Arkes. 2009. Preference reversals in evaluations of cash versus non-cash incentives. Journal of Economic Psychology 30: 859–872. Stevens, J. 1996. Applied Multivariate Statistics For the Social Sciences. 3rd edition. Hillsdale, NJ: Erlbaum Associates. Thaler, R. 1985. Mental accounting and consumer choice. Marketing Science 4: 199–214. Thaler, R. 1999. Mental accounting matters. Journal of Behavioral Decision Making 12: 183–206. Trochim, W. M., and J. P. Donnelly. 2008. The Research Methods Knowledge Base. 3rd edition. Mason, OH: Thompson Learning—Atomic Dog. Waldfogel, J. 1993. The deadweight loss of Christmas. American Economic Review 83: 1328–1336. Webb, A., S. Jeffrey, and A. Schulz. 2010. Factors affecting goal difficulty and performance when
- 91. employees select their own performance goals: Evidence from the field. Journal of Management Accounting Research 22 (1): 209–232. Webley, P., and R. Wilson. 1989. Social relationships and the unacceptability of money as a gift. The Journal of Social Psychology 129 (1): 85–91. Wright, P. 1992. An examination of the relationships among monetary incentives, goal level, goal commitment, and performance. Journal of Management 18: 677– 693. APPENDIX A Questionnaire Items Panel A: Goal Commitment Itemsa 1. It’s hard to take this goal seriously.* 2. Quite frankly, I don’t care if I achieve this goal or not. * 3. I am strongly committed to pursuing this goal. 4. It wouldn’t take much for me to abandon this goal.* 5. I think this is a good goal to shoot for. (continued on next page) 1830 Presslee, Vance, and Webb
- 92. The Accounting Review September 2013 http://dx.doi.org/10.1080/09585192.2010.483840 http://dx.doi.org/10.1016/S0361-3682(02)00026-0 http://dx.doi.org/10.1287/mnsc.1100.1147 http://dx.doi.org/10.1023/A:1008115902904 http://dx.doi.org/10.1093/rfs/hhn053 http://dx.doi.org/10.1093/rfs/hhn053 http://dx.doi.org/10.1037/0021-9010.91.1.156 http://dx.doi.org/10.1287/mksc.17.1.4 http://dx.doi.org/10.1257/jel.37.1.7 http://dx.doi.org/10.1016/j.joep.2009.08.001 http://dx.doi.org/10.1287/mksc.4.3.199 http://dx.doi.org/10.1002/(SICI)1099- 0771(199909)12:3<183::AID-BDM318>3.0.CO;2-F http://dx.doi.org/10.2308/jmar.2010.22.1.209 http://dx.doi.org/10.2308/jmar.2010.22.1.209 http://dx.doi.org/10.1080/00224545.1989.9711702 http://dx.doi.org/10.1080/00224545.1989.9711702 http://dx.doi.org/10.1177/014920639201800405 APPENDIX A (continued) Panel B: Mental Accounting and Hedonic Experience Itemsa Mental Accounting 1. I will consider the rewards earned as separate from other income. (Separate) Hedonic Experience 2. I will think frequently about my reward. (Think)