2. cash and tangible rewards commonly cited as contributing to dif-
ferences in reward distinctiveness between cash and tangible re-
wards (Alonzo, 1996; Balk, 2017; Flanagan, 2006; Jeffrey & Shaffer,
2007; Luckey, 2009; Next Level Performance n.d.). The four attri-
bute differences are:
1. Fungibility (More versus Less): As with their salary, employees
can more easily use cash rewards to obtain desired goods/ser-
vices; by definition, tangible rewards are restricted in use.
2. Hedonic Nature (Utilitarian versus Hedonic Consumption): As with
their salary, employees tend to use (spend) cash rewards in
more utilitarian ways, while tangible rewards are often hedonic
in nature, and represent “wants” instead of “needs.”
3. Novelty (Less versus More Novel): Novelty is the quality of being
new or surprising (Novelty, 2022). Employees tend to view cash
rewards as being less novel because they quickly develop an
expectation for the opportunity to earn cash rewards and view
the opportunity as being a “built-in” component of their
compensation, much like their salary. In contrast, employees are
less likely to develop such expectations for the opportunity to
earn tangible rewards because these rewards are often unex-
pected, i.e., feel more novel.
4. Discrete Framing (Joint versus Discrete): With respect to
employee rewards, firms adopt practices that jointly frame cash
rewards with employees' salary, but frame tangible rewards
discretely from employees' salary. For example, firms often pay
employees their salary and cash rewards in a lump-sum, but
must pay tangible rewards separately from salary.
The preceding discussion highlights three empirical questions
related to proponents' claims about the motivational benefits of
tangible rewards compared to cash rewards; we present these
questions as testable links in our conceptual model (Fig. 1). First, do
employees perceive differences between cash and tangible rewards
in the aforementioned four attributes? Second, do perceived dif-
ferences in these reward attributes affect reward distinctiveness?
Third, do differences in reward distinctiveness affect employee
effort? Examining these questions can shed light on the validity of
proponents’ claims, which is particularly important because the
traditional economic perspective implies cash rewards generate
greater expected utility than do tangible rewards because cash is
more fungible (Waldfogel, 1993). Thus, tangible rewards may not
motivate greater effort, even when all four attribute differences are
present and employees assess tangible rewards to have greater
reward distinctiveness. Notably, this implies the greater fungibility
of cash rewards produces two competing effects on effort, a point
which prior research on tangible rewards has not examined.
We test our conceptual model across four studies. In Study 1,
participants view tangible rewards to be less fungible, more he-
donic in nature, and more novel than cash rewards. They also
indicate tangible rewards have greater reward distinctiveness than
cash rewards. Notably, path analysis results are consistent with the
predicted links between these reward attributes and reward
distinctiveness. In Study 2, participants rate rewards that are more
hedonic in nature or more novel to be more motivating. They also
rate rewards that are more fungible to be more motivating. Thus,
the results of Study 1 and 2 support the notion that the greater
fungibility of cash rewards generates two competing effects. In
Study 3, we conduct an experiment in which we manipulate reward
distinctiveness and find greater reward distinctiveness motivates
greater effort. We manipulate reward distinctiveness in Study 3 by
framing the reward either jointly with salary or separately from
salary (discrete framing). Thus, the results of Study 3 complement
those from Study 1 and 2 by highlighting the importance of discrete
framing as an important attribute difference between cash and
tangible rewards.
Since understanding how potential differences in reward attri-
butes between cash and tangible rewards affect effort via differ-
ences in reward distinctiveness is the primary contribution of our
paper, and the results of Studies 1e3 form the basis of that
contribution. In Study 4, we seek to complement the prior three
studies and offer evidence of the “net” effects of the four reward
attributes we examine. Specifically, we integrate the results of the
prior three studies and examine the effects of cash versus tangible
rewards on effort in an experimental setting using a holistic
manipulation that varies all four reward attributes. Examining
whether tangible rewards motivate greater effort than cash re-
wards when the two types of rewards differ along all four reward
attributes is intriguing in light of the competing effects of fungi-
bility observed in Studies 1 and 2. Consistent with proponents'
claims, we find tangible rewards motivate greater effort; partici-
pants’ performance on a computerized real-effort task is higher
when they are offered a tangible reward, both in terms of “raw”
performance as well as performance goal attainment.
By focusing on reward attribute differences between cash and
tangible rewards, we complement prior research (e.g., Bareket-
Bojmel et al., 2017; Jeffrey, 2009; Kelly et al., 2017; Mitchell et al.,
2021; Presslee et al., 2013; Shaffer & Arkes, 2009) by going
beyond whether tangible rewards motivate greater effort than cash
rewards and digging deeper into when and why tangible rewards
can motivate greater effort. We find differences in discrete framing,
hedonic nature, and novelty each contribute to the motivational
benefits of tangible rewards. Further, we find each of these differ-
ences affect effort (motivation) both individually (Study 2e3) and
collectively (Study 4). Our results also confirm the greater fungi-
bility of cash rewards generates competing effects that can offset
the motivational benefits of tangible rewards. Thus, a contribution
of our paper is that we inform firms interested in motivating em-
ployees using tangible rewards that they are best served to offer
tangible rewards that have these attributes, leading employees to
perceive greater reward distinctiveness. Moreover, while we do not
seek to reconcile the mixed empirical evidence on the motivational
benefits of tangible rewards, we believe our results can inform the
debate about the motivational benefits of tangible rewards in that
our results highlight how differences in reward attributes can be a
useful lens for understanding the mixed empirical evidence
regarding the motivational effect of tangible rewards versus cash
rewards.
Finally, although we focus on how differences in reward attri-
butes between cash and tangible rewards lead to differences in
employee motivation, we believe the implications of our paper
extend beyond cash versus tangible rewards, and reinforce a more
fundamental point about performance-based rewards. Specifically,
rewards are simply constellations of attributes, and firms can alter
these attributes to improve the effectiveness of using rewards to
motivate employee performance. In the context of our paper, for
example, cash rewards are rated as less novel than tangible re-
wards, but firms could deliver the cash rewards in a manner that
makes them feel more novel (e.g., at a company-wide event pub-
licly recognizing employee performance and achievements). Thus,
J. Choi and A. Presslee Accounting, Organizations and Society 104 (2023) 101389
2
3. at a broad level, our emphasis on reward attributes is consistent
with Baker, Jensen, and Murphy's (1987) framework that de-
composes reward attributes along three dimensions: level (how
much to pay), functional form (how to pay) and composition (what
to pay), and with Merchant and Van der Stede's (2017) criteria for
evaluating the features of performance-contingent rewards (e.g.,
valued, timely, and durable).
2. Background and theory
2.1. The motivational benefits of tangible rewards
Proponents argue tangible rewards are more motivating than
cash rewards because employees perceive the two reward types
differently. Specifically, employees tend to perceive cash rewards as
simply “more salary,” but tangible rewards as being distinct from
salary (Flanagan, 2006; Odell, 2005). That is, employees assess
tangible rewards to have greater reward distinctiveness.
Mental accounting theory (Thaler, 1985, 1999) provides a
foundation for understanding this claim (Kelly et al., 2017; Presslee
et al., 2013). According to mental accounting theory, people cate-
gorize outcomes (including financial gains and losses) into various
topical mental accounts (e.g., “bills,” “retirement,” or “entertain-
ment”) using a similarity-based categorization process in which
outcomes perceived to be similar are categorized into the same
category or mental account (Henderson & Peterson, 1992; Rosch &
Mervis, 1975). This categorization affects how people subjectively
value prospective and realized gains and losses. Of particular
relevance to our study is that outcomes exhibit diminishing mar-
ginal value: the positive (negative) marginal value of gains (losses)
is diminishing for each additional gain (loss) that is categorized into
a given mental account. Consequently, individuals perceive greater
subjective value for two gains that are categorized into separate
mental accounts than when the same two gains are categorized
into the same mental account (Thaler & Johnson, 1990).1
Applied to our setting, mental accounting theory predicts
tangible rewards can motivate greater effort when tangible rewards
are viewed as being more distinct from salary than are cash re-
wards. That is, when employees assess tangible rewards have
greater reward distinctiveness, these rewards are less susceptible to
the diminishing marginal value associated with gains, making them
more motivating than cash rewards. The contributions of our study
lie in understanding how potential differences in reward attributes
between cash and tangible rewards contribute to differences in
reward distinctiveness.
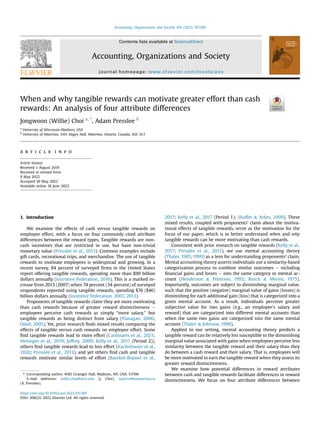
Fig. 1. Conceptual Model
Note: Link 1 reflects the following research question: Do employees perceive differences in fungibility, hedonic nature, novelty, and discrete framing? Link 2 reflects the following
research question: Do perceived differences in these reward attributes affect reward distinctiveness? Link 3 reflects the following research question: Do differences in reward
distinctiveness affect employee effort? Collectively, the three links culminate in the hypothesis that tangible rewards will lead to greater effort than cash rewards because dif-
ferences between cash and tangible rewards in fungibility, hedonic nature, novelty, and discrete framing facilitate differences in employees' mental accounting of the two types of
rewards.
1
More generally, suppose there are two gains, X and Y, and v(X), v(Y), and
v(X þ Y) capture the subjective value of X, Y, and the combined “total” gain of X and
Y, respectively. Research finds v(X) þ v(Y) > v(X þ Y) because gains are subject to
diminishing marginal value (Thaler, 1985; Thaler & Johnson, 1990).
J. Choi and A. Presslee Accounting, Organizations and Society 104 (2023) 101389
3
4. 2.2. Four commonly cited attribute differences between cash and
tangible rewards
Both prior research and proponents of tangible rewards point to
several potential attribute differences between cash and tangible
rewards as possible reasons for why tangible rewards can motivate
greater effort (e.g., Alonzo,1996; Balk, 2017; Flanagan, 2006; Jeffrey
& Shaffer, 2007; Luckey, 2009; Mitchell et al., 2021; Next Level
Performance n.d.; Presslee et al., 2013). However, whether cash
and tangible rewards tend to differ in attributes and if so, whether
these differences actually affect employees’ mental accounting of
the reward and their effort, remain empirical questions.
We investigate the effects of four commonly cited attribute
differences that prior research and proponents argue will affect
how employees subjectively value the reward, and in turn, their
motivation to earn it: (1) fungibility (more versus less), (2) hedonic
nature (utilitarian versus hedonic consumption), (3) novelty (less
versus more novel), and (4) discrete framing (joint versus discrete).
Beyond being commonly cited, these differences also offer more
generalizable implications regarding the motivational benefits of
tangible rewards, as they apply to a broader set of tangible rewards
than do other mentioned differences.2
2.2.1. Fungibility (more versus less)
Fungibility refers to the ease with which people can use the
reward to obtain desired goods and services. By definition, tangible
rewards are less fungible (more restricted in use) than cash re-
wards. This difference in fungibility can have two countervailing
effects. On the one hand, proponents and recent studies argue the
restricted use attribute of tangible rewards lead employees
perceive tangible rewards to have greater reward distinctiveness
(Jeffrey & Shaffer, 2007; Presslee et al., 2013). Conversely, cash re-
wards have less reward distinctiveness because cash is equally
fungible. Thus, all else equal, tangible rewards are less fungible but
more distinct from salary than cash rewards are from salary, which
mental accounting theory suggests would lead tangible rewards to
be more motivating than cash rewards.
On the other hand, the traditional economic perspective sug-
gests the greater fungibility of cash rewards will generate greater
expected utility and thus, be more motivating than tangible re-
wards because cash can be more easily be used to obtain desired
goods and services (Waldfogel, 1993). Consistent with this
reasoning, individuals express a clear preference for cash rewards
over tangible rewards when given a choice between the two types
of rewards, as the difference in fungibility becomes quite salient
(Jeffrey, 2009; Shaffer & Arkes, 2009). Thus, differences in fungi-
bility between tangible rewards and cash are expected to have two
countervailing effects on effort, and the net effect of these coun-
tervailing forces is unclear.
2.2.2. Hedonic nature (utilitarian versus hedonic consumption)
Hedonic nature refers to the extent to which the reward can be
used to obtain goods and services that are relatively more practical
and necessary in nature (utilitarian) or relatively more fun and
exciting in nature (hedonic). Proponents and recent studies argue
tangible rewards are more motivating than cash rewards due to
differences in how the two types of rewards are spent or consumed
(Balk, 2017; Flanagan, 2006; Jeffrey & Shaffer, 2007; Kelly et al.,
2017; Luckey, 2009). Proponents argue employees find it difficult
to justify spending cash rewards in a fun or frivolous way, and
instead spend them in a more utilitarian fashion by paying off bills,
buying groceries, and meeting other basic “needs” (Adams, 2021;
Statista, 2012). In contrast, tangible rewards are often hedonic
goods and services, representing “wants” that people find difficult
to justify purchasing on their own.
These differences in how employees consume cash and tangible
rewards are notable because employees use the bulk of their salary
on utilitarian expenses like housing, food, healthcare, trans-
portation, and taxes (Frankel, 2018).3
Thus, cash rewards are more
likely to have less reward distinctiveness because both salary and
cash rewards are typically spent in similarly utilitarian ways. In
contrast, tangible rewards are more likely to have greater reward
distinctiveness because salary and tangible rewards are less likely
to be spent or consumed in similar ways.
Recent studies provide preliminary support for the motivational
benefits of offering hedonic rather than utilitarian rewards. First, in
a field experiment using a repeated (two sequential) tournament
setting with home furnishing retailers, Kelly et al. (2017) find re-
tailers offered a hedonic tangible reward outperform retailers
offered a cash reward in the second tournament because retailers
who lost in the first tournament pursuing hedonic tangible rewards
subsequently outperformed those who lost while pursuing cash
rewards. Second, using a free-sort task, Mitchell et al. (2021) find
support for the effects of hedonic nature on mental accounting, as
they find salary is more commonly categorized with utilitarian
items than with hedonic items. Mitchell et al. (2021) also conduct a
laboratory experiment in which participants perform a computer-
ized real-effort task under a piece-rate incentive compensation
scheme, and find participants offered a hedonic tangible reward
outperform participants offered a utilitarian tangible reward.
2.2.3. Novelty (less versus more novel)
Novelty is the quality of being new or surprising (Novelty, 2022).
Proponents argue tangible rewards are more motivating because
tangible rewards are perceived to be more novel, and perceptions of
novelty reflect the degree to which employees develop an expec-
tation of the reward. In particular, employees can quickly treat cash
rewards as an expected source of compensation, much like their
salary (Balk, 2017; Flanagan, 2006; Luckey, 2009). In contrast,
tangible rewards feel more unexpected (a surprise). This phe-
nomenon likely relates to differences in fungibility and hedonic
nature discussed earlier. For example, according to Michael Dermer,
President and CEO of IncentOne, a rewards management company,
Employees view cash incentives and awards as part of their
annual compensation. Because those dollars just become part of
what you take home, there’s nothing special about them. [The
money] tends to get spent paying bills, and you don’t really do
anything that’s memorable, so there’s no lasting effect relative
to the dollars that you’re putting into those incentive schemes. It
just becomes part of that fungible pile of money that you find a
way to spend every month and every year (Flanagan, 2006).
Consequently, employees often feel as if their salary has been
cut when they fail to attain the cash reward or the cash reward
incentive pay program is discontinued (Flanagan, 2006; Odell,
2005). In contrast, employees are less likely to develop a similar
2
For example, some proponents suggest tangible rewards may be more moti-
vating because they have greater “trophy value” (Jeffrey & Shaffer, 2007). However,
arguments about the motivational effects of trophy value apply only to material
tangible rewards (a TV) and not to experiential rewards (a vacation). In contrast, the
differences we examine apply to both material and experiential tangible rewards.
3
This is consistent with the popular “50-30-20” financial rule of thumb which
recommends spending 50 percent of (after-tax) income on “needs” like paying bills
and buying groceries, spending 30 percent on “wants” like shopping and other
entertainment, and allocating 20 percent on savings and retirement (Pant, 2018).
J. Choi and A. Presslee Accounting, Organizations and Society 104 (2023) 101389
4
5. expectation for tangible rewards because the use of tangible re-
wards is more novel (Balk, 2017).
2.2.4. Discrete framing (joint versus discrete)
Discrete framing reflects the practices firms adopt that frame
rewards jointly with salary versus discretely from salary.4
Pro-
ponents argue tangible rewards are more motivating because
tangible rewards are more likely to be presented as being distinct
from an employee's salary than are cash rewards (Balk, 2017;
Flanagan, 2006; Jeffrey & Shaffer, 2007; Luckey, 2009; Odell, 2005).
How firms pay compensation to employees may facilitate differ-
ences in the framing of the reward. For example, firms often pay
cash rewards together with salary in a lump-sum, but must pay
tangible reward separately from salary. Thus, employees may view
cash rewards as merely generating a slightly higher paycheck, and
not as a separate gain earned for outstanding job performance. That
is, employees may view their salary and cash reward as one slightly
bigger gain rather than as two separate gains. In contrast, em-
ployees may be more likely to view their salary and tangible re-
wards as two separate gains rather than as one larger gain because
tangible rewards cannot be paid in a lump-sum and must be paid
separately from an employee's salary. Such framing effects have
likely strengthened over time, as technological innovations like
direct deposit have made it easier for cash rewards to be lumped in
with salary and other cash-based income (Flanagan, 2006).
2.3. Hypothesis and testing approach
The preceding discussion highlights three empirical research
questions comparing the motivational benefits of cash versus
tangible rewards. First, do employees perceive differences between
cash and tangible rewards in the aforementioned four attributes?
Second, do perceived differences in these reward attributes affect
reward distinctiveness? Third, do differences in reward distinc-
tiveness affect employee effort? In Fig. 1, we present these three
research questions as testable links in our conceptual model. Links
1, 2, and 3 in our conceptual model correspond to the first, second,
and third research questions, respectively. Based on the preceding
discussion, the three links in our conceptual model culminate in the
hypothesis that tangible rewards will lead to greater effort than
cash rewards via the four attribute differences (fungibility, hedonic
nature, novelty, and discrete framing) that facilitate differences in
employees’ mental accounting of the reward.
We use four studies to test for theoretical mediation as shown
by our conceptual model (Asay et al., 2019; Spencer et al., 2005).5
We use multiple studies and test for theoretical mediation as
opposed to traditional statistical mediation for three reasons. First,
asking participants questions about their perceptions of reward
attributes and mental accounting prior to completing a real effort
task can inflate both type 1 and type 2 errors by priming partici-
pants to view the rewards and their attributes in specific ways
(Mitchell et al., 2021). Indeed, prior mental accounting research
relies almost exclusively on decisions and behavior to provide ev-
idence of mental accounting as opposed to measuring the mental
accounting process within the same study. Second, asking partici-
pants questions about their perceptions of reward attributes and
mental accounting after completing a real effort task can introduce
noise because extraneous factors such as performance on the task,
whether a reward was earned, and the type of reward (if earned),
could affect participants’ responses. Third, participants may simply
view any earnings from a laboratory study as windfall gains or in
other ways that depress any perceived differences between earn-
ings that reflect salary versus earnings that reflect performance-
based rewards (Arkes et al., 1994; Milkman & Beshears, 2009).
Given multiple theoretical mediating variables (as in our concep-
tual model), this reduces the effectiveness of using a single exper-
iment to detect differences in effort between participants pursuing
cash rewards and those pursuing tangible rewards. In fact, this may
at least partially explain the mixed results related to the perfor-
mance effects of cash versus tangible rewards between laboratory
and field studies (Kelly et al., 2017). Thus, using theoretical medi-
ation reduces the risk of type 2 errors of failing to reject an incorrect
null hypothesis.
In Study 1, we examine whether cash and tangible rewards
differ in terms of fungibility, hedonic nature, and novelty, and
whether these differences affect reward distinctiveness (Fig. 1,
Links 1 and 2). We do not examine the attribute of discrete framing
in Study 1 because doing so would involve explicitly informing
participants about the different ways that the reward can be framed
relative to salary, and framing effects largely disappear when par-
ticipants are explicitly made aware of the different possible frames
(Cheng & Wu, 2010). However, we return to discrete framing in
Section V when discussing Study 3. In Study 2, we examine whether
differences in reward attributes affect effort intentions (Fig. 1, Links
2 and 3). In Study 3, we examine whether reward distinctiveness,
manipulated through discrete framing, affects motivation (Fig. 1,
Link 3).6
Finally, in Study 4, we build on the insights from the previous
three studies to examine whether tangible rewards motivate
greater effort than do cash rewards when differences in all four
attributes are all present. Since the primary contribution of our
paper lies in understanding how potential differences in reward
attributes between cash and tangible rewards affect effort via dif-
ferences in reward distinctiveness, Studies 1e3 serve as the pri-
mary tests of our conceptual model. That said, Study 4 offers an
opportunity to provide evidence on the “net effects” of the four
reward attributes we examine in our paper. To do so, we use a
holistic manipulation of reward type in Study 4 that varies all four
reward attributes.7
3. Section III. Study 1 method and results
3.1. Participants
We recruit 155 participants from Amazon's Mechanical Turk
(MTurk) to complete Study 1. MTurk participants are more repre-
sentative of the general population than traditional laboratory
participants (Buhrmester et al., 2011). Moreover, Farrell et al. (2017)
find MTurk participants and traditional laboratory participants
exhibit similar performance on a variety of accounting tasks.
We require MTurk participants to meet four criteria: (1) be
located in the U.S., (2) be at least 18 years old, (3) have completed
over 1000 MTurk tasks (HITs), and (4) have at least a 95% approval
rating on prior HITs. Ninety-seven participants (63 percent) are
4
Discrete framing differs from reward distinctiveness in that discrete framing
reflects firms' practices related to how they present or deliver employee rewards,
while reward distinctiveness reflects employees' perceptions of the reward in
response to firm practices for presenting or delivering the reward.
5
We obtained IRB approval for all four studies.
6
We conducted Studies 3 and 4 prior to 2020 such that COVID-related issues and
precautions did not apply.
7
In contrast to Studies 1e3, in which we can isolate effects of each individual
reward attribute, the holistic manipulation we use in Study 4 limits our ability to
isolate how each individual reward attribute contributes to any observed difference
in effort between cash and tangible rewards. We discuss this issue further in Sec-
tion VI, and we highlight opportunities for future research to address this issue in
Section VII.
J. Choi and A. Presslee Accounting, Organizations and Society 104 (2023) 101389
5
6. male, and participants’ average age is 36.1 years. Participants
receive $2 USD for completing the study, and on average, partici-
pants complete the study in just under 6 min.
3.2. Procedures and measures
We administer the study using Qualtrics. After providing their
informed consent, participants receive the following definitions of
cash and tangible rewards:
Cash Rewards: Cash rewards are monetary payments for good
performance at work.
Tangible Rewards: Tangible rewards are non-monetary pay-
ments for good performance at work. The payments are
restricted in use, but have financial value. Examples of tangible
rewards include redeemable points, gift cards, trips/travel, and
merchandise. Notably, tangible rewards are not tokens of
appreciation or non-financial recognition (e.g., thank you note).
Then, participants receive the following definitions of the three
reward attributes and reward distinctiveness:
Fungibility: the reward can easily be used to obtain goods and
services.
Hedonic in nature: the reward is used to consume “wants”
instead of “needs.”
Novelty: the reward is novel and unique.
Distinctiveness: the reward feels distinct from salary, and not
simply “more salary.”
Then, participants indicate how likely they think cash and
tangible rewards are to have each attribute and the reward
distinctiveness of each type of reward (eight likelihood assess-
ments total). Participants respond using a 7-point scale with end-
points of 3 (very unlikely) and þ3 (very likely). We
counterbalance whether participants assess cash or tangible re-
wards first. By and large, our results are inferentially similar across
the two orders; thus, we do not include order as a variable in our
analyses.8
Finally, participants provide demographic information.
3.3. Results
We analyze participants' assessments using paired t-tests and
path analysis. We use participants’ assessments to create four
measures: Fungibility, Hedonic Nature, Novelty, and Distinctiveness.
Table 1, Panel A reports descriptive statistics and Table 1, Panel B
reports the path analysis results. We report one-tailed p-values
unless stated otherwise.
Untabulated pairwise t-tests of each measure are consistent
with expectations. First, Fungibility is higher for cash rewards than
for tangible rewards (p 0.01). Second, Hedonic Nature is higher for
tangible rewards than for cash rewards (p 0.01). Third, Novelty is
higher for tangible rewards than for cash rewards (p 0.01). Finally,
Distinctiveness is higher for tangible rewards than for cash rewards
(p 0.01).
Path analysis results are also consistent with our expectations.
Our path analysis simultaneously tests the associations between
Reward Type (0 ¼ cash rewards, 1 ¼ tangible rewards) and Fungi-
bility, Hedonic Nature, and Novelty, and between these three attri-
butes and Distinctiveness (Kline, 2011). We allow Fungibility,
Hedonic Nature, and Novelty to co-vary, and bootstrap the standard
errors in the path analysis model using 10,000 replications (Hayes,
2018). We also cluster standard errors by participant to address the
potential for correlated error terms due to multiple observations
from the same participant. The path model fits the data well:
CFI ¼ 0.98; SRMR ¼ 0.03 (Kline, 2011).
Consistent with our paired t-test results, Fungibility is higher for
cash rewards (p 0.01) while Hedonic Nature and Novelty are
higher for tangible rewards (p 0.01 for both measures). Impor-
tantly, Fungibility is negatively associated with Distinctiveness
(p ¼ 0.02), while Hedonic Nature and Novelty are positively associ-
ated with Distinctiveness (p 0.01 for both attribute measures).
Collectively, these results are consistent with our expectations for
Links 1 and 2 and corroborate proponents’ claims regarding those
links.
4. Section IV. Study 2 method and results
4.1. Overview
The results of Study 1 are consistent with proponents’ claims
about the difference in attributes between cash and tangible re-
wards, and how these differences affect reward distinctiveness. In
Study 2, we build on the results of Study 1 and examine whether
fungibility, hedonic nature, and novelty affect effort intentions
(Fig. 1, Links 2 and 3).
4.2. Participants
We recruit 441 participants from MTurk. We require partici-
pants to meet the same four criteria as in Study 1, and we prohibit
Study 1 participants from completing Study 2. One hundred eighty-
four participants (42 percent) are female, and the average age is
36.6 years. Participants receive $1 USD for their participation and
on average, participants complete the study in just under 6 min.
4.3. Procedures, independent variables, and dependent variable
We administer the study using Qualtrics. After providing their
informed consent, we ask participants to imagine they are an
employee of a company that offers them a reward for good job
performance in addition to their salary. We use a 3 x 2 between-
participants design in which we vary fungibility, hedonic nature,
and novelty, each at two levels, and randomly assign participants to
one of the six conditions. We describe the reward in each condition
as follows:
Fungibility:
(1) Less Fungible: “The reward cannot easily be used to obtain
goods or services.”
(2) More Fungible: “The reward can easily be used to obtain
goods or services.”
Hedonic Nature:
(1) Utilitarian: “The reward can only be used to obtain goods and
services that are necessary and practical.”
(2) Hedonic: “The reward can only be used to obtain goods and
services that are fun and exciting.”
8
In untabulated pairwise t-tests, participants do not assess tangible rewards as
being more likely to be hedonic in nature when participants provide their assess-
ments for cash rewards first (Meancash ¼ 5.30, Meantangible ¼ 5.23, t ¼ 0.31,
p ¼ 0.76). Notably, our path analysis results regarding this attribute are robust to
the order in which participants provide their assessments. The difference in sta-
tistical significance between tests likely reflects the noisiness of the underlying data
due to both individual differences (repeated measure) and associations between
measured variables; path analysis is more effective in controlling for these sources
of noise.
J. Choi and A. Presslee Accounting, Organizations and Society 104 (2023) 101389
6
7. Novelty:
(1) Less Novel: “The reward is ordinary and common.”
(2) More Novel: “The reward is novel and unique.”
Then, using a 7-point scale with endpoints of þ1 (not motivating
at all) and þ7 (highly motivating), participants indicate how
motivating they would find working towards earning the reward
(Effort). Finally, participants provide demographic information.
4.4. Results
We test the motivational effects of each attribute using t-tests.
Table 2 reports descriptive statistics and t-test results comparing
the two levels for each of the three reward attributes. We find re-
sults consistent with our expectations. First, Effort is higher in the
More Fungible condition than in the Less Fungible condition (two-
tailed p ¼ 0.01), suggesting rewards that are more fungible are
more motivating.9
This result is notable because the increased
motivation arising from greater fungibility acts as a countervailing
force against the motivating effects of greater distinctiveness. That
is, although cash rewards are more fungible, and thus, assessed to
have less reward distinctiveness (see Study 1 results), greater
fungibility increases the flexibility in how the reward can be used,
which acts as a strong motivator, consistent with the discussion in
Section II. Second, Effort is higher in the Hedonic condition (more
hedonic) than in the Utilitarian condition (less hedonic) (p ¼ 0.02),
suggesting rewards that are more hedonic in nature are more
motivating. This result is consistent with those reported by Mitchell
et al. (2021). Finally, Effort is higher in the More Novel condition
than in the Less Novel condition (p ¼ 0.01), suggesting rewards that
are more novel are more motivating.
5. Section V. Study 3 method and results
5.1. Overview
In Study 3, we direct our focus to Link 3 in Fig. 1 and examine
Table 1
Study 1 results.
Panel A: Mean (Standard Deviations)
Order 1 (N ¼ 77) Order 2 (N ¼ 78) Overall (N ¼ 155)
Cash Tangible Cash Tangible Cash Tangible
Fungibility 2.32 (1.01) 0.59 (1.71) 2.20 (1.21) 1.25 (1.29) 2.25 (1.12) 0.92 (1.55)
Hedonic Nature 1.30 (1.60) 1.23 (1.39) 0.60 (1.45) 1.37 (1.35) 0.91 (1.45) 1.34 (1.47)
Novelty 0.26 (1.91) 1.39 (1.32) 0.32 (2.12) 1.34 (1.34) 0.02 (2.03) 1.37 (1.32)
Distinctiveness 1.12 (1.49) 1.94 (1.13) 0.46 (1.74) 1.51 (1.63) 0.79 (1.65) 1.72 (1.41)
Panel B: Path Analysis
Unstandardized
Estimates
Standard Errors z-stat p-value
Reward Type / Fungibility 1.33 0.15 9.00 0.01
Reward Type / Hedonic Nature 0.42 0.16 2.62 0.01
Reward Type / Novelty 1.40 0.17 8.36 0.01
Fungibility / Distinctiveness 0.13 0.06 2.08 0.02
Hedonic Nature / Distinctiveness 0.26 0.07 3.88 0.01
Novelty / Distinctiveness 0.23 0.06 3.77 0.01
Note: Fungibility, Hedonic Nature, and Novelty are participants' ratings of the likelihood that cash and tangible rewards have each attribute; participants provide their ratings
using a 7-point scale with endpoints of 3 (Very Unlikely) and þ3 (Very Likely). Distinctiveness is participants' ratings of the likelihood that cash and tangible rewards feel
distinct from salary and not simply “more salary.” Participants provide their ratings using a 7-point scale with endpoints of 3 (Very Unlikely) and þ3 (Very Likely). Order 1
asks about Cash then Tangible, whereas Order 2 asks about Tangible then Cash. In the path analysis, Reward Type is equal to 0 for cash rewards and 1 for tangible rewards.
Standard errors are bootstrapped using 10,000 replications (Hayes, 2018). We cluster standard errors by participant to address the potential for correlated error terms due to
multiple observations from the same participant. All reported p-values are one-tailed.
Table 2
Study 2 results.
Panel A: Fungibility Mean (Standard Deviation)
Low [N ¼ 74] High [N ¼ 72] t-stat p-value
Fungibility 0.14 (2.19) 2.02 (1.07) 6.60 0.01
Panel B: Hedonic Nature Mean (Standard Deviation)
Utilitarian [N ¼ 74] Hedonic [N ¼ 74] t-stat p-value
Hedonic Nature 1.16 (1.69) 1.66 (1.33) 1.99 0.02
Panel C: Novelty Mean (Standard Deviation)
Less [N ¼ 71] More [N ¼ 76] t-stat p-value
Novelty 0.99 (1.74) 1.58 (1.29) 2.36 0.01
Note: Fungibility, Hedonic Nature, and Novelty are participants' ratings of how motivating they would find a reward with the given attribute. Participants provide their ratings
using a 7-point scale with endpoints of 3 (Not Motivating At All) and þ3 (Highly Motivating). We vary the level of each attribute, and participants provide their rating for one
level of one attribute. All reported p-values are one-tailed except for Fungibility, because of the countervailing motivational effects of Fungibility.
9
The reported p-value is two-tailed due to the expected countervailing effects of
greater fungibility.
J. Choi and A. Presslee Accounting, Organizations and Society 104 (2023) 101389
7
8. whether greater reward distinctiveness motivates greater effort.
Two aspects of Study 3 are worth noting. First, Study 3 comple-
ments the results of Study 2 by using a real-effort task to measure
effort. Second, we manipulate reward distinctiveness through
discrete framing, which is one of the other commonly cited attri-
bute differences between cash and tangible rewards (see Section II).
This complements the focus in Study 1 and 2 on fungibility, hedonic
nature, and novelty.
5.2. Task
Participants complete a computerized version of Chow's (1983)
decoding task, which requires participants to translate three-digit
numbers into letters using a provided translation key (Kelly
Presslee, 2017). Participants receive a different translation key in
each round. The computer screen displays the translation key,
participants' performance (number of correct translations), and the
time remaining in the round (see Appendix A). Task performance is
a suitable proxy for effort because the task is designed to be easily
understood by participants without requiring specialized knowl-
edge (low task complexity) and task performance is sensitive to
effort (Choi et al., 2021).
5.3. Procedures
We conduct the experiment at a large university in the United
States. At the start of the experiment, participants provide their
informed consent and read an initial set of instructions explaining
the decoding task. Then, participants perform the task in a 2-min
practice round to familiarize themselves with the task. Partici-
pants do not receive any compensation for their practice round
performance. After the practice round, participants receive addi-
tional instructions about the experiment, and must pass a short
quiz to ensure they understand the instructions. After successfully
completing the quiz, participants perform the decoding task for
eight additional rounds, each lasting 2 min. In all eight rounds, we
assign participants a moderately difficult performance goal of 25
correct translations.10
Importantly, there is no performance-contingent compensation
during the first four rounds. This design choice allows us to capture
the effects of performance-contingent compensation in our setting,
which we introduce before the fifth round. Specifically, at the start
of the fifth round, participants learn that in the remaining four
rounds they would earn additional compensation in each round
that they achieved the assigned performance goal of 25 correct
translations. Following the eighth round, participants complete a
post-experimental questionnaire and receive their compensation
from one randomly selected round as payment for participating in
the study.
5.4. Reward distinctiveness manipulation
We manipulate reward distinctiveness by varying how we frame
participants’ compensation across conditions. Our manipulation
varies both the labels and the numerical presentation of compen-
sation components, while holding the compensation structure
constant across conditions. In the Low Distinctiveness condition,
we inform participants they will receive a $25 wage in each round,
and in rounds 5e8, can instead earn a $35 wage in each round that
they achieve the performance goal. Thus, in the Low Distinctiveness
condition, we frame all compensation components using a more
general term (wage), which can easily be used to describe changes
in compensation, and describe the compensation in terms of the
aggregate payoff (either $25 or $35). In the High Distinctiveness
condition, we inform participants they will receive a $25 salary in
each round, and in rounds 5e8, can also earn a bonus of $10 cash in
each round that they achieved the performance goal.
Two aspects of our manipulation merit discussion. First, varying
either the labels or the numerical presentation (but not both)
would likely not generate the necessary difference in distinctive-
ness across conditions (Thaler Johnson, 1990). For example, even
if we use the label “wage” to describe compensation in both con-
ditions, separating the fixed and performance-contingent pay as we
do in the High Distinctiveness condition ($25 fixed pay plus $10
performance-contingent pay) would still prompt participants to
view these as two distinct compensation components even in the
Low Distinctiveness condition. Second, while we acknowledge
participants likely perceive a wage increase differently from earn-
ing a bonus, the goal of our manipulation is to create differences in
reward distinctiveness, and framing the performance-contingent
compensation as a wage increase versus earning a bonus helps
achieve this goal. Relatedly, the framing we use in the two condi-
tions builds on proponents’ claims that cash and tangible rewards
differ in terms of discrete framing such that employee view
performance-contingent cash rewards as simply “more salary”
(Flanagan, 2006; Odell, 2005). Therefore, Study 3 allows us to test
this claim.
5.5. Dependent measures
We capture effort using two measures of participants' task
performance. First, we consider participants' Post-Performance,
which is the average number of correct translations in a round
over the last four rounds (i.e., post-manipulation). Second, we
consider participants' Post-Attainment, which is the number of
times participants attain the performance goal in the last four
rounds. In our analysis, we control for participants’ performance
in the first four rounds because prior performance is highly pre-
dictive of future performance on real-effort tasks (Bonner
Sprinkle, 2002; Kelly et al., 2015). Specifically, when analyzing
Post-Performance, we control for Pre-Performance, which is the
average number of correct translations in the first four rounds.
When analyzing Post-Attainment, we control for Pre-Attainment,
which is the number of times a participant attains the perfor-
mance goal in the first four rounds.11
5.6. Results
We recruit 66 participants from an experimental economics
lab participant pool to complete Study 3. Thirty-two participants
(48 percent) are male, and their average age is 20.4 years. We do
not include age or gender in our analyses, as neither variable
differs by condition, nor are they correlated with Post-Performance
or Post-Attainment (both two-tailed p 0.14). We administer one
randomly assigned condition in each experimental session, and
each session lasts about 45 min. We do not include session in our
analyses, as our results are inferentially similar when controlling
for session.
10
The goal is based on the results of a pilot test in which participants perform the
task in a 2-min round and receive piece-rate compensation ($0.10 USD per correct
translation); the mean and median performance level is 25 correct translations.
Participants from the pilot test could not participate in the experiment.
11
While prior performance is highly predictive of future performance, such an
effect is unlikely to cause inferential issues as we find no difference between
conditions in practice round performance, Pre-Performance, or Pre-Attainment (all
two-tailed p 0.70).
J. Choi and A. Presslee Accounting, Organizations and Society 104 (2023) 101389
8
9. Analysis of participants' responses to post-experimental
questionnaire items indicate a successful manipulation of
reward distinctiveness. In the Low Distinctiveness condition,
participants rate their agreement with the following statement: “I
consider the wage increase for achieving the performance goal in
rounds 5e8 as being separate from my $25 wage.” In the High
Distinctiveness condition, participants rate their agreement with
the following statement: “I consider the bonus of $10 cash for
achieving the performance goal in rounds 5e8 as being separate
from my salary.” In both conditions, participants respond using an
11-point scale with endpoints of 5 (strongly disagree) and þ5
(strongly agree), and we use participants’ responses to these two
items to create our measure, Distinctiveness. Table 3, Panel A,
presents descriptive statistics for Distinctiveness and the other
measures of interest by condition. In untabulated tests, we find
Distinctiveness is higher in the High Distinctiveness condition
(t ¼ 4.28, p 0.01).
Consistent with our expectations, we find greater distinc-
tiveness leads to greater effort. As shown in Table 3, Panels B and
C, Post-Performance is higher in the High Distinctiveness condi-
tion (p ¼ 0.02), and Post-Attainment is also higher in the High
Distinctiveness condition (p ¼ 0.07). By and large, we continue to
find greater distinctiveness leads to greater effort in untabulated
tests using alternative measures of distinctiveness and effort.
6. Section VI. Study 4 method and results
6.1. Overview
In Study 4, we integrate the results of the prior three studies and
examine the full set of links shown in Fig. 1. Notably, the design of
Study 4 allows us to examine whether tangible rewards motivate
greater effort in a setting in which all four commonly cited differ-
ences between cash and tangible rewards are present. This is non-
trivial, as the results of Study 2 indicate cash rewards can motivate
greater effort because cash is more fungible, yet we hold fungibility
constant in Study 3 when examining the effect of reward distinc-
tiveness on effort.12
6.2. Task
Participants perform a computerized version of Gill and
Prowse's (2012) slider task for one practice round and twelve
Table 3
Study 3 results.
Panel A: Mean (Standard Deviation) Results by Condition
Measure Conditions
Low Distinctiveness [n ¼ 33] High Distinctiveness [n ¼ 33]
Distinctiveness 0.58 (2.89) 3.21 (2.04)
Pre-Performance 24.44 (5.30) 24.63 (4.20)
Post-Performance 24.92 (4.96) 26.14 (4.28)
Performance Change 0.47 (2.25) 1.51 (1.91)
Pre-Attainment 1.97 (1.70) 2.12 (1.49)
Post-Attainment 2.06 (1.50) 2.52 (1.25)
Attainment Change 0.09 (1.10) 0.39 (1.17)
Panel B: Analysis of Post-Performance
Model: Post-Performance ¼ b0 þ b1 (Distinctiveness Condition) þ b2 (Pre-Performance) þ εi
Coef. S.E. t-stat p-value1
Intercept 4.55 1.34 3.39 0.01
Distinctiveness Condition 0.53 0.25 2.14 0.02
Pre-Performance 0.88 0.05 16.65 0.01
Adjusted R2
¼ 81.2%
Panel C: Analysis of Post-Attainment
Model: Post-Attainment ¼ b0 þ b1 (Distinctiveness Condition) þ b2 (Pre-Attainment) þ εi
Coef. S.E. t-stat p-value1
Intercept 1.20 0.23 5.17 0.01
Distinctiveness Condition 0.18 0.12 1.51 0.07
Pre-Attainment 0.62 0.08 8.23 0.01
Adjusted R2
¼ 51.6%
Note: Distinctiveness is a post-experimental questionnaire item capturing participants' agreement with the following statement: “I consider [the bonus of $10 cash/wage
increase] for achieving the performance goal in rounds 5e8 as being separate from my [$25 salary/$25 wage].” Participants respond using an 11-point scale, with endpoints
of 5 (strongly disagree) and þ5 (strongly agree). Pre-Performance is the average number of correct translations in a round over the first four rounds. Pre-Attainment is the
number of times a participant attains the performance goal in the first four rounds. Post-Performance is the average number of correct translations in a round over the last four
rounds. Post-Attainment is the number of times a participant attains the performance goal in the last four rounds. Performance Change is equal to Post-Performance e Pre-
Performance. Attainment Change is equal to Post-Attainment e Pre-Attainment. Distinctiveness Condition is equal to 0 for the Low Distinctiveness condition and 1 for the High
Distinctiveness condition. The reported p-values for Distinctiveness Condition, Pre-Performance, and Pre-Attainment are one-tailed. All other reported p-values are two-tailed.
12
To the extent that greater fungibility generates competing effects, one may
reason that tangible rewards must lead to greater effort compared to cash rewards.
However, such reasoning requires assumptions about effect sizes such that incre-
mental effects of differences in hedonic nature, novelty, and discrete framing are
larger than the net effect of differences in fungibility. We are unaware of any theory
or empirical evidence to validate that assumption. Thus, whether tangible rewards
motivate greater effort than do cash rewards in Study 4 is unclear ex ante.
J. Choi and A. Presslee Accounting, Organizations and Society 104 (2023) 101389
9
10. production rounds. For this task, the computer screen presents a
series of sliders with endpoints of 0 and 100, and each slider has a
slider box that is initially set at 0. The objective is to use the com-
puter mouse and drag the slider box to the midpoint of the slider
(50). In each round, participants receive real-time information
regarding their performance (number of correctly positioned slider
boxes) and the time remaining in that round (see Appendix B). Task
performance is a suitable proxy for effort because the task is
designed to be easily understood by participants without requiring
specialized knowledge (low task complexity) and task performance
is sensitive to effort (Choi et al., 2021).
6.3. Procedures
We conduct the experiment at a large university in the United
States that is different from the university where we conducted
Study 3. We recruit individuals from an interdisciplinary behavioral
research lab participant pool to participate in one of seven sessions.
Participants sit at individual private computer terminals upon
arrival at the lab. After providing their informed consent, partici-
pants receive initial instructions about the slider task. Then, par-
ticipants proceed to the practice round, which lasts 2 min.
Participants do not receive any compensation for the practice
round, and practice round performance does not differ between
conditions (two-tailed p ¼ 0.16).
After the practice round, participants receive additional in-
structions about the experiment, and must pass a short quiz to
ensure they understand the instructions. Specifically, participants
learn they will perform the slider task for twelve production
rounds, each lasting 2 min. Further, participants have a difficult, but
attainable, performance goal of correctly positioning 39 slider
boxes in each round.13
In all conditions, participants receive fixed pay of $20 in each of
the twelve production rounds, and this compensation represents
their salary in each round. To mimic how employees typically spend
their salary on more serious expenses (Frankel, 2018), we ask par-
ticipants to imagine they plan to spend the $20 on utilitarian items
that are “necessary and helpful things, like paying bills and buying
groceries.” Participants also can earn additional compensation for
attaining their assigned goal, and the additional compensation is
either a cash or a tangible reward, which varied by condition. At the
end of each round, participants receive feedback about their per-
formance and the compensation they earned in the round.
Following the last production round, participants complete a post-
experimental questionnaire and receive their earnings from one
randomly selected round.
6.4. Reward type and attribute manipulation
We manipulate reward type and the four reward attribute dif-
ferences between sessions. We use a holistic manipulation that
varies reward type and ensures the cash and tangible rewards differ
in all four reward attributes (see Appendix C), which is important
considering the prior discussion about how participants may view
all earnings from a laboratory study as windfall gains (Arkes et al.,
1994; Milkman Beshears, 2009). As noted earlier, the goal of this
holistic manipulation is to integrate the results of Studies 1e3 and
test the “net” effect of the four reward attributes. The holistic
manipulation ensures we achieve this goal. In addition, we use a
real-effort task to test whether these net effects extend to a more
generalizable setting.
First, we manipulate whether participants earn a cash reward
($10) or a tangible reward ($10 AMC movie theater gift card) for
attaining the performance goal in a round. Second, we manipulate
fungibility by using a $10 AMC movie theater gift card to oper-
ationalize the tangible reward; the gift card can only be spent at an
AMC movie theater and is limited to purchasing movie tickets and
concessions. These limitations do not apply to the cash reward.
Third, we manipulate the hedonic nature of the reward (Cash
Reward condition: utilitarian; Tangible Reward condition: hedon-
ic). Recall we ask all participants to imagine they plan to spend their
$20 fixed pay in each round on utilitarian items. We ask partici-
pants in the Cash Reward condition to imagine they also plan to
spend the reward on “necessary and helpful things, like paying bills
and buying groceries.” In contrast, we ask participants in the
Tangible Reward condition to imagine they plan to spend the
reward “to buy movie tickets and buy concession items (i.e., snacks,
candy, and drinks).” This difference in planned consumption re-
flects how employees tend to spend cash rewards on utilitarian
items (“needs”), while tangible rewards are hedonic in nature
(“wants”).
Fourth, we manipulate novelty using participants' expectations
regarding the opportunity to earn the reward. Prior to round 1,
participants in the Cash Reward condition learn they can earn the
reward for attaining the performance goal in all twelve production
rounds. Prior to round 9, participants in the Tangible Reward con-
dition learn they can earn the reward in rounds 9e12; these par-
ticipants do not have an opportunity to earn the reward in the
previous eight rounds. Since we test the hypothesis using partici-
pants’ performance and goal attainment in rounds 9e12, this dif-
ference in the (un)expected opportunity to earn the reward reflects
how employees tend to develop an expectation for the opportunity
to earn cash rewards, whereas the opportunity to earn tangible
rewards feels more novel.14
Finally, as in Study 3, we manipulate discrete framing of the
reward by framing it jointly with fixed pay (Cash Reward condition)
or separately from fixed pay (Tangible Reward condition). In the
Cash Reward condition, we frame the reward jointly with fixed pay
by informing participants they will earn “$30” for goal attainment.
In the Tangible Reward condition, we frame the reward separately
from fixed pay by informing participants they will earn “$20 and an
additional $10 AMC gift card” for goal attainment. This difference in
framing reflects how cash rewards are often paid together with an
employee's salary in a lump-sum payment, but tangible rewards
are not.
6.5. Dependent measures
We consider two measures of task performance. First, we
consider Post-Performance, which is the average number of
correctly positioned sliders in a round over the last four rounds.
Second, we consider Post-Attainment, which is the number of times
a participant achieves the performance goal in the last four rounds.
Similar to our approach in Study 3, we control for participants’
performance in the four rounds prior to introducing tangible
13
In a pilot study in which participants perform the slider task for eight rounds
and earn $0.05 for each correctly positioned slider box, approximately 30 percent of
participants correctly position 39 slider boxes in at least one round. We recruit pilot
study participants from the same participant pool as those participating in the
experiment, but participants from the pilot study did not participate in the
experiment.
14
We use a surprise to operationalize novelty. As Barto et al. (2013, p. 2) explain,
“one cannot say with certainty whether experimental results [in general] provide
evidence for novelty or for surprise.” That is, the two constructs produce similar
outward reactions. The authors also note “surprise often e perhaps always e ac-
companies novelty” (9).
J. Choi and A. Presslee Accounting, Organizations and Society 104 (2023) 101389
10
11. rewards in round 9 because prior performance is highly predictive
of future performance on real-effort tasks (Bonner Sprinkle,
2002; Kelly et al., 2015). Specifically, when analyzing Post-Perfor-
mance, we control for Pre-Performance, which is the average num-
ber of correctly positioned sliders in rounds 5e8. When analyzing
Post-Attainment, we control for Pre-Attainment, which is the num-
ber of times a participant attains the performance goal in rounds
5e8.15
6.6. Results
Eighty-two participants complete Study 4. Forty-one (50
percent) participants are female, and the average age is 21.4 years.
We do not consider age or gender in our analyses, as our results are
inferentially similar when we control for these variables.16
We
administer one randomly assigned condition in each experimental
session, and each session lasts 45 min. We do not include session in
our analyses; we find similar results after controlling for session.
Participants' responses to a post-experimental questionnaire
item indicate a successful manipulation. If our manipulation is
successful, then we should observe differences in reward distinc-
tiveness between conditions. We capture participants' assessments
of reward distinctiveness relative to the $20 fixed pay they receive
in each round using a validated approach developed in psychology
research (Aron et al., 1992) and subsequently used in extant ac-
counting and marketing research (e.g., Bauer, 2015; Chernev et al.,
2011). We present participants with seven pairs of circles, with one
circle in each pair representing the $20 fixed pay and the other
circle representing the reward (see Appendix D). The seven pairs of
circles vary in the degree of overlap between the circles, which
reflects the perceived similarity between the $20 fixed pay and the
reward (greater degree of overlap indicates greater perceived
similarity). We ask participants to choose one pair of circles that
best captures how they perceive the degree of similarity between
the two forms of compensation. To create our measure, Distinc-
tiveness, we convert participants’ choices using a numerical scale
with endpoints of 1 and 7 (higher values indicate greater distinc-
tiveness). Table 4, Panel A, presents descriptive statistics by con-
dition for Distinctiveness and our measures of interest. Participants
view the reward as being more similar (i.e., Distinctiveness is
higher) in the Cash Reward condition than in the Tangible Reward
condition (t (80) ¼ 3.61, p 0.01, untabulated).
Consistent with the hypothesis, we find a tangible reward leads
Table 4
Study 4 results.
Panel A: Mean (Standard Deviation) Results by Condition
Measure Reward Type
Cash [N ¼ 42] Tangible [N ¼ 40]
Distinctiveness 3.64 (1.91) 5.05 (1.60)
Pre-Performance 35.87 (7.07) 35.20 (7.76)
Post-Performance 35.65 (9.04) 37.98 (7.19)
Performance Change 0.22 (5.28) 2.77 (3.41)
Pre-Attainment 1.73 (1.82) 1.80 (1.60)
Post-Attainment 1.95 (1.77) 2.48 (1.66)
Attainment Change 0.21 (0.68) 0.68 (1.12)
Panel B: Analysis of Post-Performance
Model: Post-Performance ¼ b0 þ b1(Reward Type) þ b2 (Pre-Performance) þ εi
Coef. S.E. t-stat p-value1
Intercept 0.61 2.91 0.21 0.84
Reward Type 2.95 0.99 2.99 0.01
Pre-Performance 0.93 0.07 13.78 0.01
Adjusted R2
¼ 70.5%
Panel C: Analysis of Post-Attainment
Model: Post-Attainment ¼ b0 þ b1(Reward Type) þ b2 (Pre-Attainment) þ εi
Coef. S.E. t-stat p-value
Intercept 0.01 0.32 0.01 0.99
Reward Type 0.47 0.20 2.38 0.01
Pre-Attainment 0.86 0.06 14.90 0.01
Adjusted R2
¼ 73.3%
Note: Distinctiveness is participants' responses to a post-experimental questionnaire item in which participants see seven pairs of circles, with one circle in each pair rep-
resenting the participant's $20 fixed pay and the other circle representing the reward. The seven pairs of circles vary in the degree of overlap between the circles, with greater
overlap indicating greater perceived similarity between the two forms of compensation. Participants choose one pair of circles that best captures how they perceive the
similarity between the two forms of compensation. We convert participants' choices using a numerical scale with endpoints of 1 and 7 (higher values reflect greater perceived
distinctiveness). Pre-Performance is the average number of correct translations in rounds 5e8. Pre-Attainment is the number of times a participant attains the performance goal
in rounds 5e8. Post-Performance is the average number of correct translations in rounds 9e12. Post-Attainment is the number of times a participant attains the performance
goal in rounds 9e12. Performance Change is equal to Post-Performance e Pre-Performance. Attainment Change is equal to Post-Attainment e Pre-Attainment. Reward Type is equal
to 0 for the Cash Reward condition and 1 for the Tangible Reward condition. The reported p-values for Reward Type, Pre-Performance, and Pre-Attainment are one-tailed. All
other reported p-values are two-tailed.
15
Neither Pre-Performance nor Pre-Attainment differ between conditions (both
two-tailed p-values 0.68).
16
Gender does not differ by condition (two-tailed p ¼ 0.52), while age is higher in
the Cash Reward condition (two-tailed p ¼ 0.07). Age is not correlated with either
Post-Performance or Post-Attainment (two-tailed p ¼ 0.38), while Post-Performance
and Post-Attainment are greater for men than for women (two-tailed p 0.05).
J. Choi and A. Presslee Accounting, Organizations and Society 104 (2023) 101389
11
12. to greater performance than a cash reward.17
We test this hy-
pothesis using similar analyses to those used in Study 3; we
compare Post-Performance and Post-Attainment across conditions
while controlling for Pre-Performance and Pre-Attainment, respec-
tively. We present the results in Table 4, Panel B (Post-Performance)
and Panel C (Post-Attainment). Both Post-Performance (p 0.01) and
Post-Attainment (p ¼ 0.01) are higher in the Tangible Reward con-
dition. Thus, when differences in all four reward attributes are
present, we find tangible rewards are more motivating than cash
rewards, consistent with proponents’ claims.18
As noted earlier, this
is notable given the countervailing motivational effects of cash
rewards due to their greater fungibility.19
7. Conclusion
Many firms offer tangible rewards in lieu of cash rewards to
motivate their employees. Using four studies, we examine four
attribute differences between cash and tangible rewards commonly
cited by proponents of tangible rewards: (1) fungibility, (2) hedonic
nature, (3) novelty, and (4) discrete framing. We find three main
results. First, consistent with proponents’ claims, cash and tangible
rewards do indeed differ in these four attributes (Study 1). Second,
these attribute differences lead people to assess greater reward
distinctiveness for tangible rewards, which in turn, strengthens the
motivational effects of tangible rewards; this applies to the attri-
bute differences both individually (Study 2 and 3) and collectively
(Study 4). Finally, we find the greater fungibility of cash rewards can
counteract the motivational effects of tangible rewards, even
though greater fungibility leads people to assess cash rewards to
have less reward distinctiveness. This suggests a multitude of
attribute differences between cash and tangible rewards may be
necessary for the motivational benefits of tangible rewards to
materialize. Overall, by focusing on reward attribute differences
between cash and tangible rewards, our paper complements prior
research by going beyond whether tangible rewards motivate
greater effect than cash rewards and examining when and why
tangible rewards can motivate greater effort (attribute differences).
Future research can build on our paper in several ways. First,
while the four differences we examine apply to both material and
experiential tangible rewards, future research could examine other
differences, including those that only apply to either material or
experiential tangible rewards (e.g., tangible rewards with trophy
value). Second, future research could examine whether increasing
the fungibility of tangible rewards (e.g., offering an Amazon gift
card or allowing employees to choose from a menu of tangible
reward options) could serve to neutralize the counteracting moti-
vational effects of cash rewards. Third, while the holistic manipu-
lation we use in Study 4 limits our ability to tease apart how the
four reward attributes interact to affect effort, it also highlights the
need to better understand how reward attributes work together (or
not) to affect effort. Future research could examine these in-
teractions. Fourth, our results suggest reward attributes mediate
the effect of reward type on effort. In Study 3, for example, we find
cash rewards can be framed as more or less discrete, which affects
effort. However, whether and how firms can frame cash rewards to
mimic other common attributes of tangible rewards (e.g., hedonic
nature and novelty) while retaining the benefit of fungibility re-
mains an empirical question. For example, firms could send mes-
sages to their employees encouraging them to spend their cash
rewards on hedonic items/experiences (e.g., “We encourage you to
purchase something fun and exciting”) or by encouraging em-
ployees to share about the hedonic item/experience they pur-
chased. This may help explain why firms offer holiday bonuses, as
employee spending around holidays typically involve hedonic
items/experiences. Firms could also increase the novelty of a cash
reward program by changing the program interval (e.g., 1 month vs.
3 months) or by changing the program name (e.g., the 2021 reward
program). Finally, future research could examine other claims
regarding the benefits of using tangible rewards. For example,
consultants claim discontinuing a rewards program is less damaging
for tangible rewards than for cash rewards because employees
develop less of an expectation for the tangible reward (Flanagan,
2006).
Acknowledgments
We thank Ranjani Krishnan (Editor), two anonymous Account-
ing, Organizations and Society reviewers, Jacob Birnberg, Alex
Brüggen, Nicole Cade, Jim Cannon, William Dilla, Jeremy Douthit,
Anne Farrell, Laura Feustel, Jeff Hales, Kip Holderness, Khim Kelly,
Jeremy Lill, Cardin Masselink, Greg McPhee, Timothy Mitchell,
Drew Newman, Brad Pomeroy, Steve Salterio, Ashley Sauciuc, Ivo
Tafkov, Todd Thornock, Nate Waddoups, Alan Webb, Sara Wick,
Michael Williamson, conference participants at the 2015 ABO
Conference, 2016 MAS Conference, 2016 Global Management Ac-
counting Research Symposium, 2016 USC Mini-Conference, 2019
Emory Accounting Conference, and 2019 Tilburg Mini-Conference,
and workshop participants at the College of William and Mary,
Iowa State University, Kent State University, Miami University,
Nanyang Technical University, Ohio State University, University of
Nebraska-Lincoln, University of South Carolina, University of Wa-
terloo, and West Virginia University for constructive feedback. We
thank Conor Brown, Jeff Clark, and Brian Knox for research assis-
tance, Sarah Chan and Garren Wood for programming assistance,
and Elise Boyas, the Pittsburgh Experimental Economics Lab, and
the University of Wisconsin-Madison BRITE Lab for access to par-
ticipants and lab space. Support for this research was provided by
the Office of the Vice Chancellor for Research and Graduate Edu-
cation at the University of Wisconsin-Madison with funding from
the Wisconsin Alumni Research Foundation. We also acknowledge
financial support from the Ben L. Fryrear Faculty Fellowship, the
Central Development Research Fund, and the Dean's Small
Research Grant Program, all at the University of Pittsburgh, and
from the Centre for Sustainability Reporting and Performance
Management at the University of Waterloo.
Appendix A
Decode Task Screenshot
17
Given the goal-based compensation scheme, we expect the effect of reward
type on performance will operate through goal commitment. To measure partici-
pants' goal commitment, we ask the following question immediately before round
9: “How committed are you to correctly positioning at least 39 sliders in a 2-min
round?” Participants respond using a 7-point scale with endpoints of 1 (Not
Committed) and 7 (Very Committed). Consistent with our expectations, we find
goal commitment is higher in the Tangible Reward condition (Mean ¼ 6.15, Stan-
dard Deviation ¼ 1.29) than in the Cash Reward condition (Mean ¼ 5.67, Standard
Deviation ¼ 1.49) (t ¼ 1.56, p ¼ 0.06).
18
When we define Pre-Attainment and Pre-Performance as performance/goal
attainment in rounds 1e8 and not rounds 5e8, we continue to find directional
support for both Post-Performance and Post-Attainment (p ¼ 0.01).
19
A confounding wealth effect is unlikely for two reasons. First, we pay partici-
pants their compensation from one randomly selected round. Second, we assign
participants a difficult goal whereby only 30% of them attain the goal.
J. Choi and A. Presslee Accounting, Organizations and Society 104 (2023) 101389
12
13. Note: We adapt Chow's (1983) decode task for Study 3. Partic-
ipants translate numbers into letters using a translation key, which
is provided at the bottom of the screen. Participants receive a new
translation key at the start of each round. Each correct translation
increases performance by one. During the round, participants
receive real-time information regarding their performance (num-
ber of correct translations) and the time remaining in the round.
Appendix B
Slider Task Screenshot
J. Choi and A. Presslee Accounting, Organizations and Society 104 (2023) 101389
13
14. Note: We adapt Gill and Prowse's (2012) slider task for Study 4.
Participants see a series of sliders with endpoints of 0 and 100, and
each slider has a slider box initially set at 0. The objective is to use
the computer mouse and drag the slider box to the midpoint of the
slider (50). During the round, participants receive real-time infor-
mation regarding their performance (number of correctly posi-
tioned slider boxes) and the time remaining in the round.
Appendix C
Reward Type Manipulation in Study 4
Appendix D
Post-Experimental Questionnaire Item Capturing Distinctiveness
Cash Reward Condition
Below are two circles, one representing the $20 and the other
representing the increase to $30 you would earn for achieving the
performance goal. The greater the overlap between the two circles,
the more similar those items are to one another. Which picture
below best describes how you think about the two items?
Tangible Reward Condition
Below are two circles, one representing the $20 and the other
representing the additional $10 AMC gift card you would earn for
achieving the performance goal. The greater the overlap between
the two circles, the more similar those items are to one another.
Which picture below best describes how you think about the two
items?
Difference Between Cash and
Tangible Rewards
Cash Reward Condition ($10 Cash for Goal Attainment) Tangible Reward Condition ($10 AMC Gift Card for Goal
Attainment)
Fungibility (More vs. Less) More: Cash Less: Gift card is redeemable only at AMC movie theaters.
Hedonic Nature (Utilitarian vs.
Hedonic Consumption)
Utilitarian: Reward spent on “necessary and helpful things, like
paying bills and buying groceries.”
Hedonic: Rewards spent on “movie tickets and to buy concession
items (i.e., snacks, candy, and drinks).”
Novelty (Less vs. More Novel) Less: Immediately before round 1, participants learn about
opportunity to earn the reward in rounds 1e12.
More: Immediately before round 9, participants learn about
opportunity to earn the reward in rounds 9e12.
Discrete Framing (Joint vs.
Discrete)
Joint: Instead of $20, participants earn “$30” for goal attainment Discrete: Instead of $20, participants earn “$20 and an additional
$10 AMC gift card” for goal attainment.
Note: In Study 4, we use a holistic manipulation emphasizing all four differences discussed in Section II: (1) fungibility (more versus less), (2) hedonic nature (utilitarian versus
hedonic consumption), (3) novelty (less versus more novel), and (4) discrete framing (joint versus discrete).
J. Choi and A. Presslee Accounting, Organizations and Society 104 (2023) 101389
14
15. Note: We create our measure, Distinctiveness, using participants'
responses to this post-experimental questionnaire item. We pre-
sent participants with seven pairs of circles, with one circle in each
pair representing the participant's $20 fixed pay (salary), and the
other circle representing the $10 reward. The seven pairs of circles
vary in the degree of overlap between the circles, with a greater
degree of overlap indicating greater perceived similarity. Partici-
pants choose one pair of circles that best captures how they
perceive the degree of similarity between the two forms of
compensation. We convert participants' choices using a numerical
scale with endpoints of 1 and 7 (higher values indicate greater
distinctiveness).
References
Adams, R. D. (2021). How will you spend your bonus? A new survey boils down
response data across industries. Available at: https://www.techrepublic.com/
article/how-will-you-spend-your-bonus-a-new-survey-boils-down-response-
data-across-industries/. (Accessed 7 May 2022).
Alonzo, V. (1996). The trouble with money. Incentive, 170(2), 26e31.
Arkes, H., Joyner, C. A., Pezzo, M. V., Nash, J. G., Siegel-Jacobs, K., Stone, E. (1994).
The psychology of windfall gains. Organizational Behavior and Human Decision
Processes, 59, 331e347.
Aron, A., Aron, E. N., Smollan, D. (1992). Inclusion of other in the self scale and the
structure of interpersonal closeness. Journal of Personality and Social Psychology,
63(4), 596e612.
Asay, S., Guggenmos, R., Kadous, K., Koonce, L., Libby, R. (2019). Theory testing and
process evidence in accounting experiments. Working Paper, University of Iowa,
Cornell University, Emory University, and The University of Texas at Austin.
Baker, G. P., Jensen, M. C., Murphy, K. J. (1987). Compensation and incentives:
Practice and theory. The Journal of Finance, 43(3), 593e616.
Balk, R. (2017). 10 ways gift cards boost employee morale. Ejgifts.com. Available at:
https://ejgifts.com/10-ways-gift-cards-boost-employee-morale/. (Accessed 26
November 2018).
Bareket-Bojmel, L., Hochman, G., Ariely, D. (2017). It's (not) all about the Jacksons:
Testing different types of short-term bonuses in the field. Journal of Manage-
ment, 43(2), 534e554.
Barto, A., Mirolli, M., Baldassarre, G. (2013). Novelty or surprise? Frontiers in
Psychology, 4(907), 1e15.
Bauer, T. D. (2015). The effects of client identity strength and professional identity
salience on auditor judgments. The Accounting Review, 90(1), 95e114.
Bonner, S. E., Sprinkle, G. B. (2002). The effects of monetary incentives on effort
and task performance: Theories, evidence, and a framework for research. Ac-
counting, Organizations and Society, 27(4e5), 303e345.
Buhrmester, M. D., Kwang, T., Gosling, S. D. (2011). Amazon's mechanical Turk: A
new source of inexpensive, yet high quality data. Perspectives on Psychological
Science, 6(1), 3e5.
Cardinaels, E., Dierynck, B., Hu, W. (2021). Rejection, reward type, and employee
creativity: When chocolate is better than cash. Working paper. Tilburg University
and Georgia Institute of Technology.
Cheng, F.-F., Wu, C. S. (2010). Debiasing the framing effect: The effect of warning
and involvement. Decision Support Systems, 49, 328e334.
Chernev, A., Hamilton, R., Gal, D. (2011). Competing for consumer identity: Limits
to self- expression and the perils of lifestyle branding. Journal of Marketing,
75(May), 66e82.
Choi, J., Clark, J., Presslee, A. (2021). Designing real-effort tasks to study motivation:
Conceptual guidance and practical application. Working Paper. University of
Wisconsin-Madison, Indiana University, and University of Waterloo.
Chow, C. W. (1983). The effects of job standard tightness and compensation scheme
on performance: An exploration of linkages. The Accounting Review, 58(4),
667e685.
Farrell, A. M., Grenier, J. H., Leiby, J. (2017). Scoundrels or stars? Theory and ev-
idence on the quality of workers in online labor markets. The Accounting Review,
92(1), 93e114.
Flanagan, W. (2006). Avoiding the cash trap: Why cash kills motivation. Incentive,
180(11), 24e28.
Frankel, M. (2018). How does the average American spend their paycheck? See how
you compare. USA Today. May 8. Available at: https://www.usatoday.com/story/
money/personalfinance/budget-and-spending/2018/05/08/how-does-average-
american-spend-paycheck/34378157/.
Gill, D., Prowse, V. (2012). A structural analysis of disappointment aversion in a
real effort competition. The American Economic Review, 102(1), 469e503.
Hayes, J. B. (2018). Introduction to mediation, moderation, and conditional process
analysis: A regression-based approach. New York, NY: The Guilford Press.
Henderson, P., Peterson, R. (1992). Mental accounting and categorization. Orga-
nizational Behavior And Human Decision Processes, 51, 92e117.
Heninger, W. G., Smith, S. D., Wood, D. A. (2019). Reward type and performance:
An examination of organizational wellness programs. Management Accounting
Research, 44, 1e11.
Incentive Federation. (2007). Federation study 2007: A study of the incentive
merchandise and travel marketplace. Westfield, NJ: GFK.
Incentive Federation. (2013). Incentive market study: October 2013. Falls Church, VA:
Aspect Market Intelligence.
Incentive Federation. (2016). Incentive marketplace estimate research study. West-
field, NJ: GFK.
Jeffrey, S. A. (2009). Justifiability and the motivational power of tangible noncash
incentives. Human Performance, 22, 143e155.
Jeffrey, S. A., Shaffer, V. (2007). The motivational properties of tangible incentives.
Compensation Benefits Review, 39(3), 44e50.
Kachelmeier, S. J., Williamson, M. G., Zhang, X. (2020). Cash vs. noncash rewards:
Motivational effect of reward type across individual and group-based tournaments.
Working paper. University of Texas at Austin, University of Illinois at Urbana-
Champaign, and Cornell University.
Kelly, K. O., Presslee, A. (2017). Tournament group identity and performance: The
moderating effect of winner proportion. Accounting, Organizations and Society,
56, 21e34.
Kelly, K. O., Presslee, A., Webb, R. A. (2017). The effects of tangible rewards versus
cash rewards in consecutive sales tournament: A field experiment. The Ac-
counting Review, 92(6), 165e185.
Kelly, K. O., Webb, R. A., Vance, T. (2015). The interactive effects of ex post goal
adjustment and goal difficulty on performance. Journal of Management Ac-
counting Research, 27(1), 1e25.
Kline, R. (2011). Principles and practice of structural equation modeling (3rd ed.). New
York: Guilford Press.
Luckey, M. (2009). Non-cash rewards are best for performance improvement.
February: Maritz.
Merchant, K. A., Van der Stede, W. A. (2017). Management control systems: Per-
formance measurement, evaluations and incentives (4th ed.). Pearson.
Milkman, K. L., Beshears, J. (2009). Mental accounting and small windfalls: Evi-
dence from an online grocer. Journal of Economic Behavior Organization, 71,
384e394.
Mitchell, T., Presslee, A., Schulz, A., Webb, R. A. (2021). Needs versus wants:
Which motivates more effort? Journal of Management Accounting Research (in
press).
Next Level Performance. Choosing the most effective incentive rewards: Cash or
non-cash? White paper. n.d, Available at: https://nxlperformance.com/
resource/choosing-effective-incentive-rewards-cash-non-cash/.
Novelty. (2022). In Merriam-Webster.com. Retrieved, from https://www.merriam-
webster.com/dictionary/novelty. (Accessed 5 January 2022).
Odell, P. (2005). Motivating the masses. Promotion, 18(10), 39e50.
Pant, P. (2018). The 50/30/20 rule of thumb for budgeting. Available at: https://
www.thebalance.com/the-50-30-20-rule-of-thumb-453922. (Accessed 26
December 2018).
Presslee, A., Vance, T., Webb, R. A. (2013). The effects of reward type on employee
goal setting, goal commitment and performance. The Accounting Review, 88(5),
1805e1831.
Rosch, E., Mervis, C. B. (1975). Family resemblances: Studies in the internal
structure of categories. Cognitive Psychology, 7, 573e605.
Shaffer, V., Arkes, H. (2009). Preference reversals in evaluations of cash versus
non- cash incentives. Journal of Economic Psychology, 30, 859e872.
Spencer, S., Zanna, M., Fong, G. (2005). Establishing a causal chain: Why exper-
iments are often more effective than mediational analyses in examining psy-
chological processes. Journal of Personality and Social Psychology, 89(6),
845e851.
Statista. (2012). What will you spend the majority of your year-end bonus on?.
Available at: https://www.statista.com/statistics/220971/how-americans-
spend-their-year-end-bonus/. (Accessed 7 May 2022).
Thaler, R. H. (1985). Mental accounting and consumer choice. Marketing Science, 4,
199e214.
Thaler, R. H. (1999). Mental accounting matters. Journal Of Behavioral Decision
Making, 12, 183e206.
Thaler, R. H., Johnson, E. J. (1990). Gambling with the house money and trying to
break even: The effects of prior outcomes on risky choice. Management Science,
36(6), 643e660.
Waldfogel, J. (1993). The deadweight loss of Christmas. The American Economic
Review, 83, 1328e1336.
J. Choi and A. Presslee Accounting, Organizations and Society 104 (2023) 101389
15