More Related Content
Similar to bp-energy-outlook-2023-region-insight-eu.pdf
Similar to bp-energy-outlook-2023-region-insight-eu.pdf (20)
bp-energy-outlook-2023-region-insight-eu.pdf
- 1. © BP p.l.c. 2023 | bp.com/energyoutlook
bp Energy Outlook – 2023
Insights from the Accelerated, Net Zero and New Momentum scenarios – EU
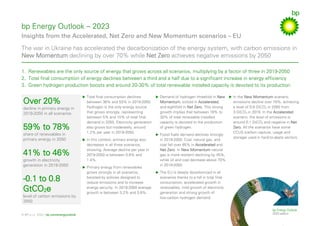
The war in Ukraine has accelerated the decarbonization of the energy system, with carbon emissions in
New Momentum declining by over 70% while Net Zero achieves negative emissions by 2050
1. Renewables are the only source of energy that grows across all scenarios, multiplying by a factor of three in 2019-2050
2. Total final consumption of energy declines between a third and a half due to a significant increase in energy efficiency
3. Green hydrogen production boosts and around 20-30% of total renewable installed capacity is devoted to its production
Over 20%
decline in primary energy in
2019-2050 in all scenarios
Total final consumption declines
between 36% and 53% in 2019-2050.
Hydrogen is the only energy source
that grows strongly, representing
between 5% and 10% of total final
demand in 2050. Electricity generation
also grows but moderately, around
1.2% per year in 2019-2050.
In this context, primary energy also
decreases in all three scenarios,
showing. Average decline per year in
2019-2050 is between 0.8% and
1.4%.
Primary energy from renewables
grows strongly in all scenarios,
boosted by policies designed to
reduce emissions and to increase
energy security. In 2019-2050 average
growth is between 3.2% and 3.6%.
Demand of hydrogen threefold in New
Momentum, sixfold in Accelerated,
and eightfold in Net Zero. This strong
growth implies that between 18% to
30% of total renewable installed
capacity is devoted to the production
of green hydrogen.
Fossil fuels demand declines strongly
in 2019-2050. Coal, natural gas, and
coal fall over 85% in Accelerated and
Net Zero. In New Momentum natural
gas is more resilient declining by 45%,
while oil and coal decrease above 70%
in 2019-2050.
The EU is deeply decarbonized in all
scenarios thanks to a fall in total final
consumption, accelerated growth in
renewables, mild growth of electricity
generation and strong growth of
low-carbon hydrogen demand.
In the New Momentum scenario
emissions decline over 70%, achieving
a level of 0.8 GtCO2 in 2050 from
3 GtCO2 in 2019. In the Accelerated
scenario, the level of emissions is
around 0.1 GtCO2 and negative in Net
Zero. All the scenarios have some
CCUS (carbon capture, usage and
storage) used in hard-to-abate sectors.
59% to 78%
share of renewables in
primary energy in 2050
41% to 46%
growth in electricity
generation in 2019-2050
-0.1 to 0.8
GtCO2e
level of carbon emissions by
2050
- 2. © BP p.l.c. 2023 | bp.com/energyoutlook
bp Energy Outlook – 2023
Insights from the Accelerated, Net Zero and New Momentum scenarios – EU
Level in 2050 Shares in 2050 (%) Change 2019-2050 (% p.a.)
2019 Accelerated
Net
Zero
New
Momentum
2019 Accelerated
Net
Zero
New
Momentum
Accelerated
Net
Zero
New
Momentum
Primary energy consumption by fuel (EJ)
Total 65 45 42 51 100 100 100 100 -1.2 -1.4 -0.8
Oil†
23 3.1 1.3 6.9 35 6.9 3.1 13 -6.3 -8.9 -3.8
Natural gas 14 1.2 1.2 7.7 21 2.6 2.8 15 -7.7 -7.7 -1.9
Coal 7.3 0.1 0.1 0.7 11 0.3 0.3 1.3 -12 -13 -7.4
Nuclear 6.8 3.2 3.4 2.5 10 7.2 8.2 5.0 -2.4 -2.2 -3.1
Hydro 2.8 3.2 3.2 3.0 4.3 7.0 7.7 5.9 0.4 0.4 0.2
Renewables (incl. biofuels) 11 34 33 30 17 76 78 59 3.6 3.4 3.2
Primary energy consumption (native units)
Oil†
(Mb/d) 11 1.6 0.7 3.3
Natural gas (Bcm) 389 32 33 215
Total final consumption by sector (EJ)
Total 50 26 24 32 100 100 100 100 -2.1 1.3 2.3
Transport 16 11 9.9 11 32 41 42 34 -1.3 -1.5 -1.2
Feedstocks 3.8 1.4 1.1 2.2 7.6 5.5 4.8 6.8 -3.1 -3.9 -1.8
Buildings 16 8.5 7.8 11 32 33 33 33 -2.0 -2.3 -1.3
Industry 14 5.3 4.8 8.4 29 20 20 26 -3.2 -3.5 -1.7
Generation
Power (TWh) 2,880 4,209 4,047 4,215 1.2 1.1 1.2
Hydrogen (Mt) 5.7 20 24 12 4.1 4.8 2.5
Production
Oil† (Mb/d) 0.7 0.4 0.2 0.3 -1.9 -3.8 -2.3
Natural gas (Bcm) 61 3.2 3.2 19 -9.1 -9.1 -3.7
Coal (EJ) 4.4 0.1 0 0.3 -12 -14 -8.3
Emissions
Carbon emissions (Gt of CO₂e) 3.0 0.1 -0.1 0.8 -9.6 - -4.0
CCUS (Mt of CO₂) 0 118 217 62
EJ = = exajoules
† Oil supply includes crude oil, shale oil, oil sands, natural gas liquids, liquid fuels derived from coal and gas, and refinery gains, but excludes biofuels. Oil demand includes consumption of all liquid
hydrocarbons but excludes biofuels. †† Carbon emissions include CO2 emissions from energy use, industrial processes, natural gas flaring, and methane emissions from energy production.