SlideShare a Scribd company logo
1 of 430
CITY OF CEDAR FALLS, IOWA
Comprehensive Annual
Financial Report
For the Fiscal Year Ended
June 30,20 13
Prepared by:
Finance/Public Records Division
of
Department of Administrative Services
Jennifer Rodenbeck, CPA, CPFO
Finance Manage/City Clerk
City of Cedar Falls, Iowa
Gomprehensive Annual Financial Report
For the Fiscal Year Ended June 30,2013
Table of Contents
INTRODUCTORY SECTION
Letter of Transmittal. .
GFOA Certificate of Achievement .
Organizational Charts . . . .
Principal Officials.
FINANCIAL SECTION
I ndependent Auditor's Report
Management's Discussion and Analysis
Basic Financial Statements:
Government-wide Financíal Statements:
Statement of Net Position
Statement of Activities. . . .
Fund Financial Statements:
Balance Sheet- Governmental Funds . . . .
Statement of Revenues, Expenditures, and Changes ín Fund
Balances - Governmental Funds. . . . . . .
Reconciliation of the Statement of Revenues, Expenditures,
and Changes in Fund Balances of Governmental Funds to
the Statement of Activities
Statement of Net Position - Proprietary Funds.
Statement of Revenues, Expenses, and Changes in Fund Net
Assets - Proprietary Funds.
Statement of Cash Flows - Proprietary Funds.
Notes to Financial Statements. . . .
Required Supplementary lnformation :
Budgetary Comparison Schedule - Function Budget
Notes to Required Supplementary lnformation
Schedule of Funding Progress
Other Supplem entary I nformation :
Combining Fund Statements and Schedules:
Combining Balance Sheet - Nonmajor Governmental Funds .
Combining Statement of Revenues, Expenditures, and
Changes in Fund Balances - Nonmajor Governmental
Funds
Paqe
1
11
12
14
15
18
31
33
81
83
86
35
37
39
40
42
44
46
87
91
Combining Statement of Net Position - lnternal Service Funds.
Combining Statement of Revenues, Expenses, and Changes
in Fund Net Position - lnternal Service Funds
Combining Statement of Cash Flows - lnternal Service Funds.
Capital Assets Used in the Operation of Governmental Funds:
Comparative Schedules by Source.
Schedule by Function and Activity
Schedule of Changes by Function and Activity.
STATISTICAL SECTION
Financial Trends:
Net Position by Component
Changes in Net Position.
Fund Balances, Governmental Funds
Changes in Fund Balances, Governmental Funds
Revenue Capacity:
Assessed and Taxable Value of Property. . . .
Property Tax Rates - Direct and Overlapping Governments. . .
Principal Property Taxpayers
Property Tax Levies and Collections.
Debt Capacity:
Ratios of Outstanding Debt by Type.
Ratios of General Bonded Debt Outstanding
Direct and Overlapping Debt.
Legal Debt Margin lnformation. . .
Revenue Bond Coverage - Sewer Authority.
Sales History and Total Sewer Charges.
Water Meters by Rate Class.
Largest Sewer Customers
Demographics on Economic lnformation:
Demographic and Economic Statistics
Principal Employers . . . .
Full-Time Equivalent City Government Employees by
Function/Department
Operating I nformation :
Operating lndicators by Function. . . .
Capital Asset Statistics by Function . . . .
95
97
99
101
102
104
106
108
112
114
116
118
120
122
124
126
128
129
131
133
134
135
136
137
139
141
143
DEPARTMENT OF ADMINISTRATIVE SERVICES
CITY OF CEDAR FALLS, IOWA
220 CLAY STREET
CEDAR FALLS, IOIVA 50613
PHONE: 319-273-8600
FAX: 319-268-5126
www.cedarfalls,comw
October 1,2013
To Mayor Crews, Members of the City Council and citizens of
the City of Cedar Falls:
I am pleased to submit to you the comprehensíve Annual
Financial Report (CAFR) of the city of cedar Falls, lowa,for the
year ended June 30, 2013. This is the eleventh CAFR completed
in compliance with the Governmental
Accountíng standards Board Statement No. 34 (GASB 34).
Responsibility for both the accuracy of the data andthe
completeness and fairness of the presentation, including all
disclosures, rests with the city. To the best of ourknowledge and
belief, the enclosed data is accurate in all material respects and
is reported in a manner designedto present fairly the financíal
position and results of operations of the city. All disclosures
necessary to enable thereader to gain an understanding of the
city's financial activities have been included.
GAAP require that management provide a narrative
introduction, overview, and analysis to accompany the
basicfinancial statements in the form of Management's
Discussion and Analysis (MD&A). This letter of transmittal
isdesigned to complement MD&A and should be read in
conjunction with it. The city of cedar Falls, MD&A can befound
immediately following the report of the independent auditors.
The city is required to undergo an annual single audit in
conformity with the provisions of the u.s. office ofManagement
and Budget (oMB) circular A-133, "Audits of states, Local
Governments, and Nonprofitorganizations'" lnformation to
comply with oMB circular A-133, "Audits of states, Local
Governments, andNonprofit organizations," and "Government
Auditing standards" is included in another report under a
separate
cover.
The city of cedar Falls provides many municipal services
including fire and police protection, streets, garbage
collection, parks, recreation, cultural arts, planning, zonihg,
g"n"r"i a¿m¡n¡stråtion, and sewer and storm waterservices' For
financial reportíng purposes, all funds, agencies, boards,
commissions, trusts and authoritiesinvolved in the provision of
these services are included íf the city is financially accountable.
Financial
accountability is determined by several different factors,
including fiscal dàpendence, ability to impose will upon
theentity's governlng body, provision of specific financial
burdens or benefits and separate legal entity status. Aftercareful
evaluation of these factors, the city has included in this
financíal report the cedar Falls Electric utílity, Gasutility, water
utility, and communícations utility, as well as all funds of the
cíty. The utilities are each reported asdiscretely presented
component units.
1
"OUR CITZENS ARE OUR BUSINESS"
GOVERNMENTAL STRUCTURE
The City has operated under the mayor-council form of
government since incorporation. Policy-making and
legislative authority are vested in the governing council, which
consists of seven members. The City Council is
responsible, among other things, for passing ordinances,
adopting the budget, setting goals, and approving mayor-
appointed committees. The full-time mayor is responsible for
carrying out the policies and ordinances of the City
Council, for overseeing the day{o-day operations of the City,
and for appointing department directors. The mayor
and Council are elected on a nonpartisan basis. The Council
consists of two council members elected at large and
one council member elected from each of the five wards as
established by ordinance, elected for terms of four
years. The mayor is elected at large and to a two-year term.
ECONOM¡C CONDITION AND OUTLOOK
The City, incorporated in 1854, is located in the northeastern
part of the state, has a land area of 28.9 square miles
and a population of 39,260. The City is empowered to levy a
property tax on both real and personal property
located within its boundaries, and has the power by state statute
to extend its corporate limits by annexation, which
is seldom done, but will be done when deemed appropriate by
the City Council.
The economic condition and outlook of Cedar Falls continues to
be strong. The Cedar Falls economy was insulated
from many of the impacts created by the recent recession due to
the growth and stability of the University of
Northern lowa and a diverse service business sector.
The Greater Cedar Valley Alliance was formed in the metro area
to organize the human resources and generate
needed development capital to attract new business and industry
to the area and to encourage expansion of
businesses already in the area. As a result, many new businesses
have located offices and plants in the metro
area. Target Corporation constructed a distribution center with
an assessed value of approximately $¿S million in
FY02 and in FY08 completed a second refrigeration center. The
Cedar Falls lndustrial and Technology Park
continues to show tremendous expansion.
The increase in new businesses and expansion of established
firms has had a positive effect on employment and
the City's tax base. Historically, Cedar Falls' unemployment rate
has closely followed the State trends, which are
significantly lower than the nation's unemployment rate (See
Attachment A). This is due to the strong service
employment base supported by the state university located in
Cedar Falls. Since the devaluation of property in
l9B6-1988, Cedar Falls has had steady growth in property
values. Assessed values increased in FY14 by $gZ
million, and taxable values increased by $229 million (See
Attachment B) due to the increase in assessed
valuations and the residential rollback.
The City of Cedar Falls maintains a comparatively low tax rate.
Cedar Falls has the fifth lowest tax rate per capita
of the twenty largest cities in the state of lowa (See Attachment
C). Thís low rate can be attributed to the efforts of
the City to streamline operations over the past twenty years.
This has been accomplished by maintaining the
approximate same number of employees, even when demand for
service has increased. Cedar Falls had one of
the lowest number of full{ime employees per 1,000 residents in
FY12. (See Attachment D).
Over the past ten years Cedar Falls' residential housíng sales
prices have significantly increased. ln 2002, the
average sales price reported was $153,312. ln2012, the average
sales pricewas $206,773, which is a thirty-five
(35) percent increase in the past ten years (See Attachment E).
These statistics indicate that Cedar Falls' local
economy is sound and there is a strong market for Cedar Falls
homes.
2-
Housing values have surged from the recession and devaluation
of the mid-1980's to values that once again place
the homeowners living in Cedar Falls in an advantageous
market position. This market growth is a credit to
businesses, the school system, utilities, and quality of City
services in Cedar Falls. Each entity has worked
together to strengthen the local economy, create jobs, and
improve Cedar Falls' quality of life.
MAJOR INITIATIVES
Disinfection Project: ln August 2009, the Public Works
department presented to council information on an
Ultraviolet Light (UV) Alternatives Evaluation Workshop. This
is a process to treat bacteria at the Water
Reclamation Facility. The Environmental Protection Agency
(EPA) has directed a new standard of treatment. The
advantage of UV over other disinfectants is it can inactivate
hard to control organisms, such as E.coli, without
chemical additions to the final product and without producing a
harmful disinfection by-product. Using UV is a
better and safer way to disinfect and there are no residuals.
ln FY11, the Public Works department solicited bids for the
construction of the Water Reclamation Facility UV
Disinfection and Biosolids Handling Facilities lmprovements
Project (Disinfection Project). Construction of the
project began in FY12 and a majority of the construction has
occurred during FY13. Completion is expected in
FY14. The total project cost will be approximately 921.8
million.
This project will have a significant impact on the City's sewer
fund. The City Council did approve a So/o increase on
sewer rates each year for five years beginning in FY12. The
council also decided not to finance the project in a
traditional way of selling sewer bonds. lnstead the City has
opted to self-finance the project. Cash reserves from
the City's Capital lmprovements Fund and Hospital Fund
havefinanced the project. Through June 30,2013, these
funds have foaned the sewer fund $15.9 million. Self-financing
has allowed these funds to earn interest at a rate
greater than earnings on traditional investments and the sewer
fund benefits by paying interest costs lower than
bond rates.
Bluff Street Lift Station: ln 1962, the Bluff Street Lift Station
was constructed below the 1Oo-year flood elevation.
During the Flood of 2008, the entire basement (pump room)
filled with water and the control room had five feet of
standing water in it. Due to its location, the station was not
accessible for several days and out of service for about
two weeks because of the significant damage to the mechanical
equipment in the station as well as to the backup
generator. Because of the dry well/wet well configuration of the
station, conventional flood protection was not
practical, therefore the City applied for a Community
Development Grant (CDBG) Disaster Recovery Grant to
construct the new station at a higher elevation and that is not
subject to flooding and is completely accessible in a
high water event.
ln FY10, design on the new lift station started and the Public
Works Department solicited bids for the New Bluff
Street Lift Station project. Construction began in FY12 and
continued in FY13. Completion will occur in FY14. The
total project cost will be approximately $Z.g million. The
CDBG grant will fund $3.g million of the cost. The
remaining cost will be financed with sewer bonds and self-
financing options. Sewer rates increases described
above also were needed to help finance this project as well.
3
ACCOUNTING SYSTEMS AND BUDGETARY CONTROL
ln developing and evaluating the City's accounting control
system, consideration is given to the adequacy of
internal accounting controls. Accounting control comprises the
plan of organization and the procedures and
records that are concerned with the safeguarding of assets and
the reliability of financial records and consequen¡y
are designed to provide reasonable assurance that:
¡ Transactions are executed in accordance with management's
general or specific authorizations.
' Transactions are recorded as necessary(1)to permit preparation
of financial statements in conformitywith
generally accepted accounting principles or any other criteria,
such as finance-related legal and contractual
compliance requirements applicable to such statements, and (2)
to maintain accountability for assets.
. Access to assets is permitted only in accordance to
management's authorization.
' The recorded accountability for assets is compared with the
existing assets at reasonable intervals and
appropriate action is taken with respect to any differences.
The definition of accounting control comprehends reasonable,
but not absolute, assurance that the objectives
expressed in it will be accomplished by the system. The concept
of reasonable assurance recognizes that the cost
of internal controls should not exceed the benefits. The benefit
consists of reductions in the risk of failing to
achieve the objectives implicit in the definition of accounting
control.
All internal controf evaluations occur within the above
framework. We believe that the City's internal accounting
controls adequately safeguard assets and provide reasonable
assurance of proper recording of financial
transactions.
ln accordance with the State of lowa, the City has formally
established budgetary accounting control for its
operating funds. Budgetary control is maintained at the function
level (Public Safety, Public Works, Health and
Social Services, Culture and Recreation, Community and
Economic Development, General Government, Debt
Service, Capital Projects, and Business-Type activities). The
City has adhered to these budgetary laws.
INDEPENDENT AUDIT
Eide Bailly, LLP, a firm of independent public accountants has
audíted the financial records, books of account and
transactions of the City for the fiscal year ended June 30, 2013,
and their opinion is included in the Financial
Section of this report. The financial statements are the
responsibility of the City. The responsibility of the
independent public accountants is to express an opinion on the
City's fínancial statements based on their audit. An
audit is conducted in accordance with U.S. generally accepted
auditing standards. Those standards require that
the audit be planned and performed in a manner to obtain a
reasonable assurance as to whether the financial
statements are free of material misstatement.
AWARDS
The Government Finance Officers Association of the United
States and Canada (GFOA) awarded a Certificate of
Achievement for Excellence in Financial Reporting to the City
of Cedar Falls for its comprehensive annual financial
report (CAFR) for the year ended June 30, 2012. The Certificate
of Achievement is a prestigious national award
recognizing conformance with the highest standards for
preparation of state and local government financial reports.
4
ln order to be awarded a Certificate of Achievement, a
government unit must publish an easily readable and
efficiently organized comprehensive annual financial report,
whose contents conform to program standards. The
CAFR must satisfy both accounting principles generally
accepted in the United States of America and applicable
legal requirements.
A Certificate of Achievement is valid for a period of one year
only. The City of Cedar Falls has received a
Certificate of Achievement for the last twenty-three consecutive
years (fiscal years ended 1990-2012). We believe
our current report continues to conform to the Certificate of
Achievement program requirements, and we are
submitting it to GFOA.
ACKNOWLEDGMENTS
The preparation of this report could not be accomplished
without the efficient and dedicated service of the entire
staff of the Finance/Public Records Division, particularly Lisa
Roeding, Deputy Finance Manager and Cathy
Niebergall, Financial Technician. Each member of the division
has my sincere appreciation for the contributions
made in the preparation of this report. I would also like to thank
the members of the City Council for their continued
interest and support in planning and conducting the financial
operations of the City in a responsible and prudent
manner.
Sincerely,
enbeck, CPA, CPFO
nce Manager/City Clerk
5
Unempl
ATTACHMENT A
Unemployment Rates
Cedar Falls, Waterloo, lowa & U.S.
Unemployment Rates
Gedar Falls, Waterloo, lowa & U.S.
9.00
8.00
7.00
c)
o)
o
c
c)o
L
o
fL
6.00
5.00
4.00
3.00
2.00
July Aug Sep Oct Nov Dec Jan Feb Mar Apr May June
tCedarFalls +Waterloo +lowa +U.S.
Month
12-13
Cedar Falls
(ln %)
Waterloo
(ln %)
lowa
(ln %)
U.S.
(ln o/o)
July
Aug
sep
Oct
Nov
Dec
Jan
Feb
Mar
Apr
May
June
4.O
4.4
3.2
3.5
3.1
3.5
3.8
3.3
3.1
3.0
3.1
3.9
6.6
6.8
5.7
5_8
5.8
6.8
7.6
6.6
5.8
5.4
5.4
5.7
5.3
5.5
5.2
5.1
4.9
4.9
5.0
5.0
4.9
4.7
4.6
4.6
8.3
8.1
7.8
7.9
7.7
7.8
7.9
7.7
7.6
7.5
7.6
7.6
Average 3.5 6.2 5.0 7.8
Cedar Falls has consistently
remained below Waterloo and
the nation's unemployment
rates.
Historically Cedar Falls'
unemployment rate has closely
followed the State trends.
Cedar Falls is insulated from
many of the economic problems
in the Metro area due to a strong
service employment base
supported by UNI.
6
ATTACHMENT B
taxvaluel4
Taxable Valuations FY04-FY 14
City of Cedar Falls
3,000,000,000
2,500,000,000
2,000,000,000
1,500,000,000
1,000,000,000
500,000,000
0
FYO4 FYOs FYO6 FYOT FYOS FYO9 FYIO FY11 FY12 FY13
FY14
rTaxable Value trAssessed Value
Year
Taxable
Value
Assessed
Value
FYO4
FYOs
FYO6
FYOT
FYOS
FYO9
FYlO
FY11
FY12
FY13
FY14
817,996,990
903,439,479
920,739,030
985,250,969
1 ,018,530,694
1,098,295,277
1 ,150,079,051
1 ,1 85,969,161
1,254,921,347
1,393,51 1,204
1,622,962,335
1,427,127,146
1,673,902,007
1,737 ,456,552
1,931 ,759,494
2,013,912,356
2,252,421,925
2,336,646,915
2,402,107,961
2,459,320,459
2,618,319,943
2,650,433,900
The last ten years have provided a
steady growth trend ín assessed
valuations. ln addition, FY08 was the first
year that assessed values exceeded
$2 billion and taxable values exceeded
$1 billion.
For FY14, assessed values increased
by $32,t 14,057. However, taxable
values increased by $229,35 1 ,191
due to the change in the residential
rollback factor to 52.82% for Fy14 and the
release of the TIF increment.
7
Citytaxr
900.00
800.00
700.00
600.00
500.00
400.00
300.00
200.00
Property Tax Per Capita (FY13)
20 Largest lowa Cities
ATTACHMENT C
Property Tax Per Gapita (FY13)
20 Largest Gities
WDM IC CR BE CB DA WA CL UR AN DI4 FD MC MA SC
CF AM MA DU BU
C¡ty
2010 Abbre-
Population viation
FYI3
Tax Per
Person
West Des Moines
lowa City
Cedar Rapids
Bettendorf
Council Bluffs
Davenport
Waterloo
Clinton
Urbandale
keny
Des Moines
Fort Dodge
Mason City
Marion
Sioux City
Cedar Falls
Ames
Marshalltown
Dubuque
Burlington
800.53
749.90
685.03
675.82
673.97
664.56
609.53
570.61
550.35
548.16
535.64
493.31
486.57
480.96
448.28
435.53
407.26
402.19
394.58
385.09
56,609
67,862
126,326
33,217
62,230
99,685
68,406
26,885
39,463
45,582
203,433
25,206
28,079
34,768
82,684
39,260
58,965
27,552
57,637
25,663
WDM
tc
CR
BE
CB
DA
WA
CL
UR
AN
DM
MC
MA
SC
CF
AM
MA
DU
BU
FD
Averaqe 549.89
For over two decades Cedar Falls' local
government has operated at one of the lowest per
capita property tax rates among the 20 largest
cities in lowa.
At a cost of $435.53 per person, the City is sub-
stantially below the average rate of $549.89. This
rate can be attributed to the City's concerted efforts
to streamline operations over the past 20 years.
lf the City of Cedar Falls operated at the state
average property tax per capita, an additional 4.S
million dollars would be devoted to operations.
This would be an increase of 26% of taxes levied
in FY13.
lncluded in Cedar Falls' population are university
students who live in campus housing and do not
pay property taxes. Thís results in an even greater
property tax burden on the citizens.
I
ATTACHMENT D
Full-Time Employees Per 1,000 Residents
Comparison of 20 Largest Cities
12
10
I
6
4
oe 9ù o
"so
as
"$
Eo gù 9h .$Þ oQ (a & ow $*.$o$ o( È¡Þùe
City
FY12
Employees
2010
Population
Employees
Per 1,000
Cedar Rapids
Dubuque
lowa City
Mason City
Des Moines
Ames
Sioux City
Burlington
Davenport
Waterloo
Council Bluffs
Fort Dodge
Bettendorf
Clinton
Marshalltown
W. Des Moines
Gedar Falls
Ankeny
Marion
Urbandale
1293.0
550.0
626.0
250.0
1750.0
503.0
684.0
205.0
773.0
516.0
441.O
177.0
230.0
184.0
174.0
337.0
215.0
212.0
160.0
180.0
126,326
57,637
67,862
28,079
203,433
58,965
82,694
25,663
99,695
68,406
62,230
25,206
33,217
26,895
27,552
56,609
39,260
45,592
34,769
39,463
10.24
9.54
9.22
8.90
8.60
8.53
8.27
7.99
7.75
7.54
7.09
7.O2
6.92
6.84
6.31
5.95
5.48
4.65
4.60
4.56
Average 7.30
Among the top twenty largest cities in the State of lowa, the
City of Cedar Falls
continues to have one of the lowest number of employees per
capita. The
pressures of new construction growth, road development, and
societal values
have placed greater demands on existing staff. ln the near
future, the City
Council wíll need to prioritize services or focus on key services
to address thé
over extension of City staff.
Cedar Falls city government
continued to have one of the
lowest number of employees
per 1,000 capita comparing
the top 20 largest cities.
Cedar Falls has 1.82
employees per 1,000 capita
less than the state average,
which is equivalent to 71
fewer fu ll{ime employees.
Employment reductions have
been implemented over the
last 10 years, which has
streamlined Cedar Falls'
employment.
9
Resalel2
ATTACHMENT E
The average sale price of residential properties in
Cedar Falls has grown by 35% between 2OO2- 2012
from $153,31 2 to $206,773.
However, in2O11 the average sale price declined slighfly
Average Residential Sales Price (Annual)
Cedar Falls, lowa
220,000
210,000
200,000
190,000
180,000
170,000
160,000
150,000
140,000
130,000
120,000
110,000
100,000
90,000
80,000
2002 2003 2004 2005 2006 2007 2008 2009 2010 2011 2012
Year
Average
Sales
Price
2002
2003
2004
2005
2006
2007
2008
2009
2010
2011
2012
153,312
163,637
168,599
181,310
190,929
195,090
192,154
207,754
199,318
197,576
206,773
Average 186,g3g
- 10 -
Government Finance Officers Association
Certificate of
Achievement
for Excellence
in Financial
Reporting
Presented to
City of Cedar FaIIs
fowa
For its Comprehensive Annual
Financial Report
for the Fiscal Year Ended
June 30,2012
ØrtrÊtu-
Executive Director/CEO
-11 -
City of Cedar Falls, lowa
Organizational Chart
Operations and
Maintenance
Water
Reclamation
Public
Works
lnvestigat¡ons
School Reserve
Officer & Crossing
Guard Program
Police
Department
Patrol
Code Enforcement
lnspections
Suppression
Prevent¡on
Fire
Department
City Council
Mayor
Citizens of
Cedar Falls
Cultural Services
Library*
Parks
Recreation
Visitor & Tourism
Services
Community Ctr&
Senior Services
Human & Leisure
Services
Community
Services
Engineering
& Storm Water
lnspect¡on
Services
Planning and
Zoning
Developmental
Services
Legal Services
Finance/Public
Records & Parking
lnformation
Systems
Cable W
Administrative
Services
I
A
I)
t
city division org.doc
January 29,2013
Financial Services
*The Library is governed by the Library Board of Trustees'
which are appointed by the Mayor & City Council. The Library
is shown under the Human & Leisure Services Department
since that department is the Board's liaison.
City of Cedar Falls, lowa
Boards and Commissions
I
J
(¡)
I
Board of Electrical
Examiners
Comm Ctr & Senior
Services Board
Park & Recreation
Commission
Historic Preservation
Commission
Board of
Appeals
Civil Service
Commission
Library Board
of Trustees
Visitors & Tourism
Board
City
Council
Jon Crews
Mayor
Board of
Adjustment
Cedar Falls Health
Trust Board
Human Rights
Commission
Utilities Board
of Trustees
Art & Culture
Board
Board of Plumbing
Examiners
Housing
Commission
Planning & Zoning
Commission
Finance Division
January 25,2011City boards & commissions.doc
CITY OF CEDAR FALLS, ¡OWA
PRINCIPAL OFFICIALS
June 30,2013
Title
Mayor
Council Member- 1't Ward
Council Member - 2nd Ward
Council Member - 3'd Ward
Council Member - 4th Ward
Council Member- Sth Ward
Council Member - At Large
Administrative Services Director
Developmental Services Director
Human & Leisure Services Director
Fire Chief
Police Chief
Public Works Director
City Attorney
Finance Manager/City Clerk
lnformation Systems Manager
Cable TV Manager
City Engineer
City Planner
Community Services Manager
lnspection Services Manager
Acting Cultural Services Manager
Recreation Division Manager
Visitors & Tourism Manager
Cedar Falls Public Library Director
Operations and Maintenance Manager
Water Reclamation Manager
Cedar Falls Utilities General Manager
Name
Jon Crews
Tom Hagarty
Susan deBuhr
John Runchey
Mare Madsen Schmidt
Frank Darrah
Nick Taíber
Dave Wieland
Richard L. McAlister
Ron Gaines
Mark Ripplinger
John Schilling
Jeff Olson
Bruce Sorensen
Steve Moore
Jennifer Rodenbeck
Laurene Saathoff
Denny Bowman
Randy Lorenzen
Marty Ryan
Robert Seymour
Craig Witry
Emily Drennen
Bruce Verink
Kimberly Manning
Sheryl McGovern
Brian Heath
Lyle Krueger
Jim Krieg
-14-
dar Falls
Visitor 8. Tourism Center
.¿>
EideBailly.
CPAs & BUSINESS ADVISORS
Independent Auditor's Report
To the Honorable Mayor and
Members of the City Council
City of Cedar Falls, Iowa
Report on the Financial Statements
We have audited the accompanying financial statements of the
governmental activities, the business-type
activities, the aggregate discretely presented component units,
each major fund, and the aggregate
remainingfundinformationoftheCityofCedarFalls,Iowaasofandfor
theyearended Jine30,2013,
and the related notes to the financial statements, which
collectively comprise the City's basic financial
statements as listed in the table of contents.
Management's Responsibility for the Financial Statements
Management is responsible for the preparation and fair
presentation of these financial statements in
accordance with accounting principles generally accepted in the
United States of America;this includes
the design, implementation, and maintenance of internal control
relevant to the preparation and fair
presentation of financial statements that are free from material
misstatement, whether due to fraud or
e1Tor.
Auditor's Responsibility
Our responsibility is to express opinions on these financial
statements based on our audit. We did not
audit the financial statements of the Cedar Falls Utilities, which
represent the entire assets, net position,
and revenues of the aggregate discretely presented component
units. Those financial statements were
audited by other auditors whose report thereon has been
furnished to us, and our opinion, insofar as it
relates to the amounts included for the Cedar Falls Utilities, is
based on the report of the other auditors.
We conducted our audit in accordance with auditing standards
generally accepted in the United States of
America and the standards applicable to financial audits
contained in Government Auditing Standards,
issued by the Comptroller General of the United States. Those
standards require that we plan and perform
the audit to obtain reasonable assurance about whether the
financial statements are free from mateiial
misstatement.
An audit involves performing procedures to obtain audit
evidence about the amounts and disclosures in
the financial statements. The procedures selected depend on the
auditor's judgment, including the
assessment of the risks of material misstatement of the financial
statements, whether due to fiaud or error.
In making those risk assessments, the auditor considers intemal
control relevant to the entity's preparation
and fair presentation of the financial statements in order to
design audit procedures that ur" upprop.iate in
the circumstances, but not for the purpose of expressing an
opinion on the effectiveness of thè-entìty,s
internal control. Accordingly, we express no such opinion. An
audit also includes evaluating the
appropriateness of accounting policies used and the
reasonableness of significant accounting estimates
made by management, as well as evaluating the overall
presentation of the financial statements.
l5
www.eidebqilly.com
3999PennsylvonioAve.,Ste 100 | Dubuque,lAS2oo2-2273 I
Tsó3.55ó t79o I Fs63.5577942 ) EoE
We believe that the audit evidence we have obtained is
sufficient and appropriate to provide a basis for
our audit opinions.
Opinions
In our opinion, based on our audit and the report of other
auditors, the financial statements referred to
above present fairly, in all material respects, the respective
financial position of the governmental
activities, the business-type activities, the aggregate discretely
presented component units, each major
fund, and the aggregate remaining fund information of the City
of Cedar Falls, Iowa, as of June 30,2013,
and the respective changes in financial position and, where,
applicable, cash flows thereof for the year
then ended in accordance with accounting principles generally
accepted in the United States of America.
Other Matters
Re quir e d Supp le me ntary Informat ion
Accounting principles generally accepted in the United States of
America require that the management's
discussion and analysis and the other required supplementary
information listed in the table of contents be
presented to supplement the basic financial statements. Such
information, although not a part of the basic
financial statements, is required by the Governmental
Accounting Standards Board, who considers it to be
an essential part of financial reporting for placing the basic
financial statements in an appropriate
operational, economic, or historical context. We have applied
certain limited procedures to the required
supplementary information in accordance with auditing
standards generally accepted in the United States
of America, which consisted of inquires of management about
the methods of preparing the information
and comparing the information for consistency with
management's responses to our inquires, the basic
financial statements, and other knowledge we obtained during
our audit of the basic financial statements.
We do not express an opinion or provide any assurance on the
information because the limited procedures
do not provide us with sufficient evidence to express an opinion
or provide any assurance.
Other Inþrmation
Our audit was conducted for the purpose of forming opinions on
the financial statements that collectively
compromise the City of Cedar Falls, Iowa's financial
statements. The introductory section, combining
nonmajor fund financial statements, capital asset schedules, and
statistical section are presented for
purposes of additional analysis and are not a required part of the
financial statements.
The combining nonmajor fund financial statements and capital
asset schedules are the responsibility of
management and were derived from and relate directly to the
underlying accounting and other records
used to prepare the basic financial statements. Such information
has been subjected to the auditing
procedures applied in the audit of the basic financial statements
and certain additional procedures,
including comparing and reconciling such information directly
to the underlying accounting and other
records used to prepare the basic financial statements or to the
basic financial statements themselves, and
other additional procedures in accordance with auditing
standards generally accepted in the United States
of America. In our opinion, the combining nonmajor fund
financial statements and capital asset schedules
are fairly stated, in all material respects, in relation to the basic
financial statements as a whole.
The introductory and statistical sections have not been
subjected to the auditing procedures applied in the
audit of the basic financial statements and, accordingly, we do
not express an opinion or provide any
assurance on them.
l6
Other Reporting Required by Government Auditing Standards
In accordance with Government Auditing Standards, we have
also issued a report, under separate cover,
dated September 27,2013, on our consideration of the City of
Cedar Falls, Iowa's internal control over
financial reporting and on our tests of its compliance with
certain provisions of laws, regulations,
contracts, grant agreements, and other matters. The purpose of
that report is to describe the scope of our
testing of intemal control over financial reporting and
compliance and the results of that testing, and not
to provide an opinion on the intemal control over financial
reporting or on compliance.
õ*,4 z¿/
Dubuque, Iowa
September 27,2013
I7
MANAGEMENT'S DISCUSSION AND ANALYSIS
Our discussion and analysis of the City of Cedar Falls' financial
performance provides an overview of the City's
financial activities for the fiscal year ended June 30, 2013.
Please read it in conjunction with the transmittal letter
found on pages 1 - 10 of this report.
2013 FINANCIAL H¡GHLIGHTS
year 2013. Property taxes increased $893,816 for all activities.
from fiscal year 2012. Public Safety expenses increased by
$t,029,534 and Public Works expenses
decreased by $1,061,71 0.
amount, the net position of the governmental activities
increased by $8,113,574 and the net position of the
business-type activities increased by $3,804,534.
USING THIS ANNUAL REPORT
The annual report consists of a series of financial statements
and other information as follows:
o Management's Discussion and Analysis introduces the basic
financial statements and provides an analytical
overview of the City's fínancial activities.
o Government-wide Financial Statements consist of a Statement
of Net Position and a Statement of Activities.
These provide ínformation about the activities of the City as a
whole and present an overall view of the City's
finances.
The Fund Financial Statements tell how governmental activities
were financed in the short term as well as
what remains for future spending. Fund fínancial statements
report the City's operations in more detail than
the government-wíde statements by providing information about
the City's most significant funds.
Notes to Financial Statements provide additional information
essential to a full understanding of the data
provided in the basic financial statements.
Required Supplementary lnformation further explains and
supports the financial statements with a comparison
of the City's budget for the year.
Other Supplementary lnformation provides detailed information
about the nonmajor Special Revenue and
Capital Projects Funds and the lnternal Service Funds.
REPORTING THE CITY'S FINANCIAL ACTIV¡TIES
Government-wide Financial Statements
One of the most important questions asked about the City's
finances is, "ls the City of Cedar Falls in a better financial
position at the end of the fiscal year, compared to last year?"
The Statement of Net Position and the Statement of
Activities report information about the City as a whole and
about its activities in a way that helps answer this question.
These statements include all assets and liabilities using the
accrual basis of accounting, which is similar to the
a
a
a
a
-18-
accounting used by most private-sector companies. All of the
current year's revenues and expenses are taken into
account regardless of when cash is received or paid.
The Statement of Net Position presents all of the City's assets
and liabilities, with the difference between the two
reported as "net position". Over time, increases or decreases in
the City's net position are one indicator of whether its
financial health is improving or deteriorating. A person will
need to consider other non-financial factors, however, such
as changes in the City's property tax base and the condition of
the City's infrastructure, to assess the overall health of
the City.
The Statement of Activities presents information showing how
the City's net position changed during the most recent
fiscal year. All changes in net position are reported as soon as
the change occurs, regardless of the timing of related
cash flows. Thus, revenues and expenses are reported in this
statement for some items that will not result in cash
flows untilfuture fiscal periods.
The Statement of Net Position and the Statement of Activities
report two kinds of activities:
. Governmental activities - Most of the City's basic services are
reported here, including the general
administration, streets, fire, police, parks, recreation, library,
and housing and block grant assistance. Property
taxes, local option sales taxes, road use taxes, and federal and
state grants finance most of these activities.
¡ Business-type activities - The City of Cedar Falls charges a
fee to customers to help it cover all or most of the
cost of certain services it provides. The City's sewer, refuse,
and storm water are reported in this section.
The Government-wide financial statements can be found on
pages 31 - 34 of this report.
Fund Financial Statements
The Fund financial statements provide detailed information
about the most significant funds, not the City as a whole.
Some funds are required to be established by State law or by
bond requirements. The City has two kinds of funds:
. Governmental Funds - Most of the City's basic services are
reported in governmental funds, which focus on
how money flows into and out of these funds and the balances
left at year-end that are available for spending.
These funds are reported using an accounting method called the
"modified accrual basis" of accounting, which
measures cash and all other financial assets that can readily be
converted to cash. The governmental fund
statements provide a detailed short-term view of the City's
general government operations and the basic
services it provides. Governmental fund information helps you
determine whether there are more or fewer
financial resources that can be spent in the near future to
finance City programs.
The required financial statements for governmental funds
include a balance sheet and a statement of
revenues, expenditures, and changes in fund balances. We
describe the relationship between governmental
activities (reported in the Statement of Net Position and the
Statement of Activities) and governmental funds in
a reconciliation at the bottom of the fund financial statements.
The City maintains 21 individual governmentalfunds.
lnformation is presented separately in the governmental
fund balance sheet and in the governmental fund statement of
revenues, expenditures, and changes in fund
balance for the General Fund, Hospital Fund, TIF Fund, Street
Repair Fund, Street Construction Fund, Debt
Service Fund, FEMA Fund, and Bond Fund, all of which are
considered to be major funds. Data from the
. other twelve governmentalfunds are combined into a single,
aggregated presentation. lndividual fund data for
each of these non-major governmental funds is provided in the
form of combining statements located in the
supplementary information section of this report.
Ïhe basic Governmental Fund Financial Statements can be found
on pages 35 - 39 of this report.
-19-
a Proprietary Funds - When the City charges customers for the
service it provides, these services are generally
reported in proprietary funds. The City maintains two different
types of proprietary funds. Enterprise funds are
used to report the same functions presented as businessìype
activities in the government-wide financial
statements. The City uses enterprise funds to account for its
sewer, refuse and storm water activities.
lnternal Service Funds are used to accumulate and allocate costs
internally. The City uses internal service
funds for its information systems, vehicle maintenance, and
various risk management activities. Because
these services predominantly benefit governmental rather than
business-type functions, they have been
included within governmental activities in the government-wide
financial statements.
Proprietary funds provide the same information as the
government-wide financial statements, only in more
detail. The proprietary fund financial statements provide
separate information for the Sewer Fund, Refuse
Fund, and Storm Water Fund, all of which are considered major
funds. lnternal Service Funds are combined
into a single, aggregated presentation in the proprietary fund
financial statements. lndividual fund data for
internal service funds is provided in the form of combining
statements located in the supplementary
information section of this report.
The basic Proprietary Fund Financial Statements can be found
on pages 40 - 45 of this report.
-20 -
GOVERNMENT.WIDE FINANCIAL ANALYSIS
As noted earlier, net position may serve over time as a useful
indicator of financial position. The analysis that follows
focuses on the change in the net position for governmental and
business-type activities.
Governmental activities Business-type activities Total
2013 2012 2013 2012 2013 2012
g 107,527,954 $
163,936,827
106,608,386 $
162,574,422
(4,381,386) $
83,715,207
1,255,950 $
74,092,070
103,146,568
247,652,034
$ 107,864,336
236,666,492
Current and
other assets
Capital assets
Total assets
Long-term debt
Other liabilities
Total liabilities
271,464,781
8,622,236 $
28,488,990
269,182,808
11,345,500 $
31,597,327
79,333,821
3,152,973 $
2,114,941
75,348,020
3,763,871 $
1,322,776
$
350,798,602
11,775,209 $
30,603,931
344,530,828
15,109,371
32,920,103
$ sz,r 11,226 g 42,942,827 $ 5,267,914 $ 5,086,647 $
42,379,140 $ 48,029,474
Net assets:
Net investment
in capital assets $
Restricted
Unrestricted
155,314,591 $
24,150,307
54,888,657
151,130,097 $
24,405,828
50,704,056
79,677,940 $
9,500
(5,621,533)
70,328,202 $
9,500
(76,32s)
234,992.531
24,159,807
49,267,124
s 221,458,299
24,415,328
50,627,727
Total net position $ 234,353,555 $ 226,235,981 $ 74,065,907 $
70,261,373 $ 308,419,462 $ 296,s01,3S4
Net position of governmental activities increased from FY12 by
approximately $A.t million, or 3.59%. This increase
was due primarily to the continued strength of the property tax
base and the small amount of general obligation debt
outstanding by the City. Net position of business-type activities
increased from FY12by approximately $g.g million, or
5.41%. This increase was due to new assets constructed or being
constructed. These assets include the new Public
Works complex, the disinfection project and the Bluff Street
liftstation. ln addition, this was the seventh year that storm
water fees were collected. The largest portion of the City's net
position is the net investment in capital assets (e.g.,
land, infrastructure, buildings, and equipment). The debt related
to the investment in capital assets is liquidated with
sources other than capital assets. Restricted net position
represent resources that are subject to external restrictions,
bond covenants, constitutional provisions or enabling
legislation on how they can be used. Unrestricted net position,
the part of net position that can be used to finance day{o-day
operations are approximately $49 million at the end of
the year.
-21 -
For the year ended June 30, 2013, net position changed as
follows
Governmental Activities Business e Activities Total
2013 2012 2013 2012 2013 2012
Revenues
Program Revenues
Charges for
servrces
Operating grants
and contributions
Capital grants and
contributío ns
General Revenues
Property taxes
Local Option Sales Tax
Hotel/Motel Tax & Other
Use of money and
property
lntergovernm ental
Miscellaneous
Gain on Sale of assets
Utility contribution
Total revenues
Expenses
Public safety
Public works
Health and social
servrces
Culture and
recreation
Community and
economrc
development
General government
Debt service
Sewer
Refuse
Storm Water
Total expenses
$ 4,911,766 $ 5,099,756$ 8,461,470$ 8,469,215$ 13,373,236$
13,568,971
2,098,639 1 ,695,1 1 7 2,098,639 1,695,117
6,479,932 1 1,529,905 577,411 140,450 7,O57,343 1 1 ,670,355
24,695,940
4,793,027
7 51,577
1,268,202
4,405,345
1,375,437
23,802,124
5,062,220
692,486
1,275,402
4,296,073
1,014,890
6,606
1,625,000
24,695,940
4,793,027
751,577
1,307,088
4,405,345
1,375,437
23,802,124
5,062,220
692,486
38,886 36,1 37 1 ,311,539
4,296,073
'1,014,890
6,606
1,625,0001,637,000 1,637,000
$ 52,416,865 $ 56,099,579 $ S,OZZ,767 g 8,645,802 $
61,494,632 $ 64,745,381
$ 9,491,677 $
11,909,568
$ $
320,864
7,262,'t 10
8,357,058
4,890,409
228,173
8,462,143 $
12,971,278
316,339
7,098,908
7,815,848
4,333,403
452,378
9,491,677 $
11,909,568
320,864
7,262,110
8,462,143
12,971,278
31 6,339
7,098,908
3,617,688
2,770,264
728,713
3,336,990
2,492,305
722,991
8,357,058
4,890,409
228,173
3,617,688
2,770,264
728,713
7,815,848
4,333,403
452,378
3,336,990
2,492,305
722,991
$ 42,459,85s $ 41,450,297 $ 7,1 16,665 $ 6,552,286 $
49,576,524 $ 48,002,s83
$ 9,957,006
(1,843,432)
8 14,64s,282 $ 1,961,102 $
1,843,432
2,093,516 $
8, 91 9,1 54
11,918,108 $ 16,742,758
9,154)
lncrease in net position
before transfers
ïransfers
lncrease in net position
Net position, beginning
Net position, ending
8,113,574 $
226,239,981
5,730J28 $
220,509,853
3,804,534 $
70,261,373
11,012,670 $
59,248,703
11,91 8,108 $
296,501,354
16,742,798
279,758,556
$
$ 74,065,907 $ 70,261,373$ 234,353,555 $ 226,239,981
22
$ 308,419,462 $ 296,501,354
Property taxes increased by approximately $893,000 from FY12
due to increased taxable valuations. FEMA grants for
property buyouts related to the 2008 Flood received in FY12,
caused capital grants and contributions to decreasefor
FY1 3.
INDIVIDUAL MAJOR FUND ANALYSIS
Governmental Fund Highlights
As of the end of the current fiscal year, the City's governmental
funds reported combined ending fund balances of
$64,696,852. $548,225 is nonspendable for inventory.
$25,435,109 is restricted for TlF, debt service, road use tax
funds, local option sales tax, employee retirement systems, bond
proceeds and various grants. $16,551,115 is
committed for the City's health trust fund and parking fund.
$16,376,887 is assigned for recreational capital funds,
police forfeiture funds, economic development and capital
improvements. Thís leaves $5,785,516 for unassigned fund
balances in the governmental funds.
The Governmental fund balances increased by $4,880,073, or
8.160/0. This increase was due in part to the increase in
the FEMA Fund.
The General Fund is the chief operating fund of the City of
Cedar Falls. At the end of the current fiscal year,
unassigned fund balance of the General Fund was $6,978,807,
while the total fund balance totaled $9,037,503. As a
measure of the General Funds liquidity, it may be useful to
compare both unreserved fund balances and total fund
balances to total fund expenditures. Unassigned fund balance
represents 33.51% of the total General Fund
expenditures, while the total fund balance represents 43.39% of
that same amount.
The following fund balances in the other major funds, which
comprise the Total Governmental Funds are listed below:
FY13 FY12 lncrease
Amount Amount (Decrease)
Hospital Fund
TIF Fund
Street Repair Fund
Street Construction Fund
Debt Service Fund
FEMA Fund
Bond Fund
Other Governmental Funds
15,718,951 $
15,435
12,609,671
6,012,776
318,846
(529,170)
(644,688)
22,157,628
$ 443,930
(3,767)
(1,061,578)
891,363
56,970
3,749,701
(595,880)
1,311,285
$ 15,274,921
19,202
13,671,249
5,121,413
261,976
(4,278,871)
(48,808)
20,846,343
The FEMA Fund had the largest increase in fund balance due to
the reimbursements received for projects related to
the 2008 Flood.
The Street Repair Fund had a decrease in fund balance due to
many projects being able to be completed during FY13
The Hospital Fund had an increase in fund balance due to the
fewer projects being funded by the Health Trust Board
The Street Construction Fund had an increase in fund balance
due to the increase in road use taxes received. Road
use tax funds have increased due to the population increase in
Cedar Falls which causes the formula to be revised.
23
The Bond Fund had a decrease in fund balance due to bond
proceeds received in prior years being spent out on
various projects.
The Other Governmental Funds had an increase in fund balance
due to the increase in the Capital lmprovements
Fund. This increase was the result of the Fund being paid back
for cashflowing various Capital Projects.
-24 -
The following schedule presents a summary of the governmental
fund revenues for the fiscal year ended June 30,
2013 and June 30, 2012.
Revenues
FY13
Amount
Percent
of Total
FY12
Amount
lncrease
(Decrease)
from FY12
Percent of
lncrease
(Decrease)
Property taxes and
assessments
Other city taxes
Licenses and permits
Use of money and property
lntergovernm ental
Charges for services
Fines and forfeitures
Miscellaneous
Utility contribution in lieu of
taxes
$ 24,696,783
5,519,022
1 ,076 ,1 86
1,268,202
12,599,954
3,386,415
449j65
1 ,358,192
$ 23,766,846
5,755,920
1 ,162,401
1,275,402
18,920,930
3,507,339
430,016
1,052,265
$ 929,937
(236,8e8)
(86,215)
(7,200)
(6,320,976)
(120,s24)
19,149
305,927
12,000
47.50 o/o
10.62
2.07
2.44
24.23
6.51
0.86
2.61
16.89 %
(4.30)
(1.57)
(0.13)
(114.82)
(2.20)
0.35
5.56
0.221,637,000 3.16 1,625,000
$ 51,990,919 100.00 % 57,496,119 _q_(5,50529q_ j_qo.oo %_
The most significant decrease in revenues was in
intergovernmental. The decrease was due to the receipt of
FEMA
disaster assistance payments and IJOBS grant revenues for the
new Public Works Complex in FY12. The most
significant increase was in property taxes. The increase was due
to increased property tax valuation due to the
change in the residential rollback factor.
Governmental Revenues
FY13
Other City Taxes
10.620/o
Licenses & Permits
2.07%
Use of Money &
Property
2.44o/o
Property Taxes
47.50%
Utility Contributions
3j6%
Fines & Forfeitures
0.86%
lntergovernmental
24.23%
Charges for Services
6.51%
Miscellaneous
2.61o/o
-25 -
The following schedule presents a summary of governmental
expenditures for the fiscal years ended June 30, 2013
and June 30,2012.
Public Safety
Public Works
Health & Social Services
Culture & Recreation
Cummunity and Economic
Development
General Government
Debt Service
Capital Projects
$ 8,999,942
10,089,252
172,284
6,449,626
2,646,490
4,684,063
2,956,009
9,544,629
Expenditures
FY13
Amount
Percent
of
Total
19.76 %
22.15
0.38
14.16
5.81
10.29
6.49
20.96
FY12
Amount
lncrease
(Decrease)
from FY12
Percent of
lncrease
(Decrease)
$ 8,375,158
10,810,336
167,759
6,410,049
2,447,212
4,775,981
3,918,383
11,390,660
624,784
(721,084)
4,525
39,577
199,278
(e1,e18)
(962,374
( 1 ,846,031 )
22.69 %
(26.1e)
0.16
1.44
7.24
(3.34)
(34.e5)
(67.05)
$
$ 45,542,295 100.00 % $ 48,295,538 $ (2,753,243) 100.00 %
The most significant decrease in expenditures occurred in the
capital projects function. This was due to several
projects occurring during FY12, including disaster recovery
expenditures.
The most significant increase in expenditures occurred in Public
Safety. This was due to increased pension costs as
set by the State of lowa.
Governrnental Expend itures
FY13
Capital Projects
20.960/o
Debt Service
6.49o/o
General Govemment
10.29o/o
Community and
Economic
Development
5.81o/o
Public Safety
19.760/o
Public Works
22.15o/o
Culture and
Recreation
14.160/o
Health & Social
Services
0.38%
-26 -
Proprietary Funds
City of Cedar Falls proprietary funds provide the same type of
information found in the government-wide financial
statements, but in more detail.
Net position of the Sewer, Refuse and Storm Water funds at the
end of the year amounted to $74,065,907. There are
net position in the Governmental Activities lnternal Service
fund of $15,126,691 .
These funds were established for the City operations that are
financed and operated in a manner similar to private
business enterprises. The cost of providing the services to the
general public is recovered, in whole or in part, through
user charges.
The City's enterprise operations are comprised of three separate
and distinct activities: Sewer, Refuse and Storm
Water. Results of operations for these funds for the years ended
June 30, 2013 and June 30, 2012 are as follows:
Sewer Refuse Storm Water
2013 2012 2013 2012 2013 2012
Operating Revenues
Operating Expenses
Non-Operating Rev (Exp)
CapitalContributions
O perating Transfers, net
Change in Net Position
4,574,181 $
3,208,163
(387,334)
178,978
1,633,090
2,790,752
$ 2,996,396
2,770,264
9,712
$ 3,328,306 $
2,488,868
6,079
$ 4,313,923
2,856,740
(460,314)
77,480
5,028,445
6,102,794
210,342
446,186
4,143,060
4,988,577
890,893 $
728,713
6,983
398,433
567,596
826,986
722,991
6,68 5
62,970
(252,351)
(78,701)
5,000,000
4,000,000
3,000,000
2,000,000
1,000,000
0
Proprietary Fund Operating Revenues & Expenses
FYI3
I
Sewer Refuse Storm Water
I Operating Revenue ü Operating Expenses
BUDGETARY HIGHLIGHTS
Over the course of the year, the City Council revised the budget
two times. These amendments were done in January
and May 2013. The amendments were needed due to the City's
participation in the Jumpstart, Buyout, Demolition,
and Public Assistance Federal & State Programs. At the end of
the year, the City did not exceed the amended
budgeted amounts in any of its functions.
27
CAP¡TAL ASSET AND DEBT ADMINISTRATION
CapitalAssets
At the end of June 30, 2013, the City had approximately $Z¿g
million invested in capital assets including police and fire
equipment, public buildings, park facilities, roads, bike trails,
bridges, water treatment facilities, sanitary sewer lines,
and storm water improvements. (See Table following.) This
represents a net increase of approximately 911 million or
4.64% over last year.
City of Cedar Falts Capital Assets
(net of depreciation)
Gove rnm enta I activities Business activities Total
2013 2012 2013 2012 2013 2012
Land
Buildings
lmprovements
other than
buildings
Machinery and
equipment
lnfrastructure
Construction
in progress
$ 28,867,975
18,419,051
$ 30,480,556
36,407,208
$ 30,316,450
37,498,908
$ 28,703,869 $ 1,612,581 $ 1,612,581
19,077 ,238 17,988,157 18,421,670
8,195,797 8,666,142 8,195,797 8,666,142
6,674,726
90,353,811
6,954,815
86,908,330
5,324,374
30,831,125
5,457,929
30,874,644
11,999,100
121,184,936
12,412,744
117,782,974
11,425,467 12,264,028 27,958,970 17,725,246 39,384,437
29,989,274
Total $ 163,936,S27 $ 162,574,422 $ 83,715,207 ç 74,092,070 $
247,652,034 $ 236,666,492
Major capital asset events during the current fiscal year
included the following:
. Hwy 58 Pedestrian Bridge.
. Bluff Street Liftstation.
o Northern lndustrial Park.
. Ridgeway Avenue.
o TreatmentFacilityDisinfection.
More detailed information about the city's capital assets is
presented
statements.
tn Note 3 to the financial
Capital Assets Net of Depreciation
Land
12.310/o
Construction ln Progress
15.90%
Buildings
14.70Yo
lmprovements
3.31Yo
Machinery & Equipment
4.85%lnfrastructure
48.93Yo
-28 -
Debt
Atyear-
end,theCityhad$11,610,000ínoutstandingbondscomparedto$14,9
10,000¡astyear. Thatisadecreaseof
$3,300,000 or 22.13%.
Gity of Cedar Falls Outstanding Debt
General Obligation Debt
Govem rnental activities Total
2013 2012 2013 2012
Business-type activities
2013 2012
General obligation
bonds $
Tax increment
financing
Capital loan notes
1,125,000
10,210,000
$ $ 2,335,000 $ 2,755,000 $ 2,æ5,000 $ 2,755,000
575,000
8,075,000 625,000 920,000
575,000
8,700,000
1,125,000
11,030,000
Total $ 8,650,000 $ 11,335,000 $ 2,960,000 $ 3,575,000 $
11,610,000 $ 14,910,000
The City of Cedar Falls was upgraded to a Aa1 rating from
Moody's lnvestor Services for all general obligation
issuances. This was a result of Moody's recalibrating their U.S.
municipal rating scale.
State statutes limit the amount of general obligation debt a
government entity may issue to 5% of its total assessed
valuation. As of June 30, 2013, the City's legal debt margin was
$1 19,762,511 .
More detailed information about the City's long-term debt is
presented in Note 3 to the financial statements.
Gity of Cedar Falls Outstanding Debt
FY13
CapitalLoan Notes
75o/o
GO Bonds
20To
TIF Bonds
5%
-29-
ECONOMIC FACTORS AND NEXT YEAR'S BUDGETS AND
RATES
During the state legislative session in 2004, the legislature
permanently eliminated certain state funding to local
governments starting with FY2005 and will continue in all
future years. This along with the continuation of the state
rollback on residential properties greatly affects the City's
general operating fund.
Even with the State reductions, the City Council did establish a
balanced budget in the General Fund for Fyj4. The
tax levy rate per $1,000 of taxable valuation for FY14 is
provided below:
$ 8.10
2.76
.56
.21
.27
.10
.00
.02
$ 12.02
REQUESTS FOR INFORMATION
This financial report is designed to provide our citizens,
taxpayers, customers and creditors with a general overview of
the City's finances and to show the City's accountability for the
money it receives. The City's discretely presented
component units, Cedar Falls Utilities, have separately issued
financial statements. lf you have questions about this
report or need additional information, contact the Department of
Administrative Services, 220 Clay Street, Cedar Falls,
lowa 50613.
General levy
Trust and Agency levy
Debt Service levy
Transit levy
Library levy
Liability lnsurance levy
Emergency Management levy
Municipal Band levy
Total levy
30-
dar Falls
The Falls Aquatic Center
dar Falls
Veteran's Memorial
Park
CiÇ of Gedar Falls, lowa
Statement of Net Position
June 30, 2013
Primarv Government
ASSETS
Cash
Certificates of Deposit
Receivables, net of allowance for uncollectible amounts:
Property taxes
Other city taxes
Accrued interest
Special assessments
Notes from associated company
Customers
Human & Leisure services contributions
Other
Due from component unit
lnternal balances
Due from other governments
lnventories
Prepaids and other assets
Restricted assets:
Cash
Certificates of deposit
US government and agency securities
Capital assets:
Land
Land improvements
Buildings
Machinery and equipment
lnfrastructure
Construction in progress
Accum ulated depreciation
Total assets
LIABILITIES
Accounts payable
Accrued liabilities
Due to primary government
Note payable to associated company
Unearned revenue
Long-term liabilities:
Portion due or payable within one year:
Bonds payable
Compensated absences
Portion due or payable after one year:
Bonds payable
Compensated absences
Net OPEB liability
Total liabilities
NET POSITION
Net investment in capital assets
Restricted:
Streets
Debt service
Em ployee retirement system
TIF
Post closure costs
Unrestricted
Total net position
$ 61 ,017,101 S 9,732,421
21,855J75
979,860
64,720
44,163
11,977
3,925,645
959,113
850,000
15,340,000
1,615,165
877.012
28,867,975
13,155,356
27,818,640
I 7,1 53,865
163,497,944
11,425,467
(97,982,420
$ 271,464,781
1,145,520
(15,340,000)
68,69ô
23,933,783
7,964,022
45,857,843
27,958,970
(23,611,9921
$ 79,333,821
Governmental
Activities
Business-type
Activities Total
$ 70,749,522
21,855,175
979,860
76,697
44,163
3,925,645
2,104,633
850,000
1 ,61 5,1 65
945,708
30,480,556
13,155,356
51,752,423
25,117,887
209,355,787
39,384,437
(121,594,412
$ 350,798,602
1612,581
$ 2,624,404
't,028,432
21,789,027
2,775,O00
841,889
5,847,236
1,862,099
343, I 39
s 37,111,226
18,531,342
318,846
5,284,684
15,435
't,546,705
76,962
635,000
138,633
2,517,973
352,641
$ 4,171,109
1 ,'t 05,394
21,789,027
3,410,000
980,522
8,365,209
2,214,740
18,531,342
318,846
5,284,684
15,435
9,500
49.267.124
T--m6;413262-
$
343 139
$ 5.267 ,914 $ 42,379,140
$ 1s5,314,591 g 79,677,940 $ 234,ss2,531
54,888,657
$ 234,353,555
See notes to financial statements
-31 -
Component Units
Electric
Utility
Gas
Ut¡litv
Water
Utility
Communications
Utititv
$ 25,140,464
4,863,620
50,292
738,090
4J25,443
7,088,038
8,165,964
883,693
3,416,O21
6,719,750
2,743,250
1,326,855
4,683
25,745.195
20,862,151
145,179,355
19,422,336
(78,980,669)
$ 201,304,895
144,501
136,449
36,307
39,835
2,029,561
652,815
18,388,514
1,146,341
(9,824,603)
2 950 811
548,845-
72,035
1 10,378
24,687
63,466
838,873
376,977
28,285,949
572,606
(8,981,686)
$ 26,107,994
1 ,005,1 81
502,746
't,183,414
216,366
259,544
340,000
1,321,858
18,042,813
17,205,059
1,4'10,409
(7,431,0s8)
$ 38,11 1,68s
s 7,782,233 $ 3,704,010 $ 2,341 ,894
5,006 13
3,000,000
1,562,201 419,347 1,709,01 1
4 448
4456883641038
4947263,206
$$ 5,973,191
5,210,181
1,430,000
2,590,000
48,361,300
738,286
$ 1,267,263
567,454
685,821
'165,403
$ 2,685,941
624,408
115,210
2,217,831
584,733
3,738,090
1,595,000
14,119,021
1,047,349
154,492
145,026
$
526
484
86 664
4 $ 1.039.136 S
$ 87,762,796 S 12,432,463 $ 2t,156,185 $ 9,775,113
I 20852,
3 912 673
32-
City of Cedar Falls, lowa
Statement of Activities
For the Year Ended June 30, 2013
Proqram Revenues
Functions/Programs
Primary government:
Governmental activities:
Public safety
Public works
Health and social services
Culture and recreation
Community and economic development
General government
lnterest on long{erm debt and related fees
Total governmental activities
Business-Çpe activities:
Sewer
Refuse
Storm Water
Total business-type activities
Total primary government
Component units
Electric Utility
Gas Utility
Water Utility
Communications Utility
Total component units
Expenses
Charges for
Services
Operating
Grants and
Contributions
Capital
Grants and
Contributions
6,479,932
$g 9,491,677
11,909,568
320,864
7,262,110
8,357,058
4,890,409
673,860
204,592
2,400,747
1,632,567
$ 172,475 $
346,880
1,579,284
173
$
$ 3,617,688
2,770,264
728,713
$ 4,911,766 $ 2,098,639
4,574,181
2,996,396
890.893
ö$
$ 6,479,932
$ 178,978
398,433
$ 7,116,665 s 8.461.470 $ 577,411
s 49. 76.524 $ 13,373,235 $ 2,098,639 $7. ,343
$ 44,734,893
9,421,934
3,003,090
13,669,240
$ 70,829,157
52,331,653
10,318,526
3,91 8,126
14,574,001
$ $ $ 4,528,905
570,795
877,513
482,690
$ 81.142.306 $ $ 6,459,903
General revenues:
Property taxes and assessments
Local option sales tax
Hotel/motel taxes
Other c¡ty taxes
Use of money and property
lntergovernmental, not restricted to specific programs
Miscellaneous
Utility contribution in lieu of taxes
Transfers
Total general revenues and kansfers
Change in net position
Net position - beginning
Net position - ending
See notes to financial statements
-33-
Net (Exoense) Revenue and Chanqes in net oosition
Units
Governmental
Activities Activities
Electric
Total Utit¡ty
Gas Water Communications
Ut¡lityU
$ (8,645,342) $
(5,225,044)
(320,864)
(4,514,483)
(6,777,774)
(3,257,8421
e28.173
$ (8,645,342)
(5,225,044)
(320,864)
(4,514,483)
(6,777,774)
(3,257,842)
(228,173
$ (28,969,s22)$ (28,96e,522) $
s
$$ $ $
s $ s
$ 'lj35,471
226,132
560,613
$ $ $ $ $
s1 ,216 s s $
$ (28,969,522) s___1p22216 ß (27. 047.306) $ $ s $
$ $ $ $ 12,125,665 $ $ $
1,467,387
1,792,549
$ $ $ s 12 125.665 S I $ 1,792,549
1,387,451
$ 1,387,451,387
$ 24,695,940
4,793,027
64't,404
110,173
1,268,202
4,405,345
1,375,437
1,637,000
(1,843,432)
$ 37,08s,096
$ 8,1 1 3,574
226
$
38,886
24,695,940
4,793,027
641,404
110,173
1,307,088
4,405,345
1,375,437
1,637,000
$ $ $ $$
14 060100 790 243 6 006
$ 38,965,414 S '100,790 s 14.060 g 243
$ 1,792,792
23,276,066
$ 25,068,858
$ 6,006
$ 11,918,108
296,501,354
$ 308,419,462
$ 12,226,455
124,053,956
$ 1,481,447
21.7 83,423
$ 136,280,41 1s 234.353.555 $ ,907
-34 -
$
Gity of Cedar Falls, lowa
Balance Sheet
Governmental Funds
June 30, 2013
Special Revenue
General
Fund
Hospital
Fund
TIF
Fund
Street
Repair
Fund
ASSETS
Cash
Receivables, net of allowance
for uncollectible amounts:
Property taxes
Other city taxes
Accrued interest
Special assessments
Human & Leisure services contributions
Other
Due from component unit
Due from other funds
Advance to other funds
Due from other governments
lnventories
Total assets
LIABILITIES AND FUND BALANCES
LIABILITIES
Accounts payable
Accrued liabilities
Unavailable revenue
Due to other funds
Total liabilities
FUND BALANCES
Nonspendable
Restricted
Committed
Assigned
Unassigned
Total fund balances
Total liabilities and fund balances
$ 8,387,522 g 4,449,430 $
17,500,966
89,494
20,376
3,925,645
203,097
850,000
1 1,255,000
36,436
241,612
2,045,522
$ 12,357,526
800,872
14,811
192,967543 459
$et 148 $ 16.247 ,889 $ 2,045,522 $ 13,366,176
$ 386,168 $
368,260
21,463,217 529,03; 2,030,087
$ 707,862
48,643
$
$ 22,217,645 $ 529,038 $ 2,030,087 $ 7s6,505
12,609,671
$ 9,037,503 $ 15.718 ,851 $ 15,435 $ 12,609,671
$sl 148 $ r6,247,889 $ 2.045.522
Amounts reported for governmental activities in the statement
of net assets are different because:
Capital assets used in governmental activities are not financial
resources and, therefore, are not reported in the funds.
Other long-term assets are not available to pay for current-
period expenditures and, therefore, are deferred in the funds.
lnternal service funds are used by management to charge the
costs of fleet management, management information
systems and risk management activities to individual funds. The
assets and liabilities of the internal service funds
are included in governmental activities in the statement of net
position.
Accrued interest payable is not due and payable in the current
period and, therefore, is not
reported in the funds.
Accrued compensated absences and other postemployment
benefits, are not due and payable in the current period and,
therefore, are not reported in the funds.
Bonds payable are not due and payable in the current period
and, therefore, are not reported in the funds.
Net position of governmental activities
241,612
1,817,084
6,978,807
15,718,851
15,435
$l 176
See notes to financial statements
-35-
Special Revenue
Street
Construction
Fund
Capital Projects
Debt
Service
Fund
FEMA
Fund
Bond
Fund
Other
Governmental
Funds
Total
Governmental
Funds
$ 5,524,030 $ 315,949 $
960,463
321,513
283,206
$ $ 16,714,455 $
1,348,224
89,494
13,380
44,163
8,987
47,748,912
310,544 843,'t45
1,413,731
4,085,000
103,527
23,407
21,855,175
979,860
48,567
44,163
3,925,645
948,510
850,000
1,413,731
1s,340,000
1,615,165
548,225
$ 6,128 ,749 $ 1 ,276,412 $ 310,544 $ 843,145 $ $ 95,317,953
$ $81,671
34,302
957,566 49,042
392,035
93,162
1,000,904
167,28s $
10,016
1,488,647
20,792
2,135,390
412,578
26,659,402
1,413,731
$ 398,637 $ 393,767 $
$ r 15,973 S 957,566 $ 839,714 $ 1,487,833 $t 740 $ 30,621,101
283,206
5,729,570 318,846
23,407
6,761,587
832,264
14,559,803
(1e,433)
548,225
25,435,109
16,551 ,1 15
16,376,887
5,785,516(529,170) (644,688)
$ 6,012J76 $ 318,846 529 170 $
$ 6,128 ,749 $ I ,276,412 $ 310,544
$ 15722 628 $ 64,696,852
$ 843,145 $
161,247,257
4,870,375
15J26,691
(18,017)
(2,s47,367)
(8,622,236)
36
$ 234,353,555
City of Gedar Falls, lowa
statement of Revenues, Expenditures, and changes in Fund
Balances
Governmental Funds
For the Year Ended June 30, 2013
Special Revenue
General
Fund
Hospital
Fund
TIF
Fund
Street
Repair
Fund
Revenues:
Property taxes and assessments
Other city taxes
Licenses and permits
Use of money and property
lntergovernmental
Charges for services
Fines and forfeitures
Miscellaneous
Utility contribution in lieu of taxes
Total revenues
Expenditures:
Current:
Public safety
Public works
Health and social services
Culture and recreation
Community and economic development
General government
Debt service
Capital projects
Total expenditures
Excess (deficiency) of revenues over
(under) expenditures
Other financing sources (uses):
Transfers:
Transfers in
Transfers out
Total other financing sources (uses)
Net change ín fund balances
Fund balances, beginning
lncrease (decrease) in reserve for inventories
Fund balances, ending
$ 22,802,718 $ 601,464 $ 7.6 79,979 $ 5.455
$ 15,121 ,936
414,348
I ,076,186
79,054
829,802
3,337,424
283,084
23,884
1,637,000
$ 7,679,979 $$
600,922
542
4,793,027
46,875
615,890
,792
$$$ 7,665,379 $
1,464,790
14,750
6,094,248
903,259
4,684,063
5,702,990
157,534
$ 20, 826,489 $ r sz 534 S
$ 1,976,229 $ 443,930 $ 2.679,979 $
$ 633,942 $
(2,583,045)
$ 766,990 $
(8,450,736)
$ s,702,990
7,1 98)
(814,380)
949 103 $1 $ (7,683,746) $ 814,380)
$ 27,126 $
8,949,454
60,923
443,930 $
15,274,921
(3,767) $
19,202
(1,061,578)
13,671,249
$ 9,037,503
See notes to financial statements
-37 -
$ r 5,718,351 s 15,435 $ 12. 609,671
Special Revenue
Street
Construction
Fund
Capital Proiects
Debt
Service
Fund
FEMA
Fund
Bond
Fund
Other
Governmental
Funds
Total
Governmental
Funds
$ $ $ $845,493 $
3,736
1,049,375 $
307,911
538,132
1,643,577
48,991
166,081
637,588
24,696,783
5,519,022
1,076,186
1,268,202
12,599,954
3,386,415
449,165
1,358,192
1,637,000
3,804,757
3,346
4,464,326
3,219
1,857,492
76,942
$$
$
$
103 $'849,22994,464 ,326 $ 1,937,65s $ 4,391 ,655 $ st,990,919
$ $ 1,334,563 $
233,078
8,999,942
10,089,252
172,284
6,449,626
2,646,490
4,684,063
2,956,009
9,544,629
2,688,394
2,956,009
355,378
1,743,231
1,764,779 3,382,280 4,397,570
$ 2,688,394 $ 2,956,009 $ 1,764,779
$ 1,119,709 $ (2,106.780) $ 2,699,547
$ 3,382,280 $ 8, 063,820 $ 45,542,295
$ (1,444,627 $ (3,672,165) $ 6.448,624
$ 5,495 $ 2,163,750
(280,8e0)
$ 3,574,665 $
(2,524,511)
1,060,704 $
(211,957)
5,092,148 $
(111,350)
13,297,694
(14,976,86s)
$ (275,3e5) $ 2,1 63,750 $ 1 ,050,1s4 $ 848,747 $ 4,980,798 $
(1,679,175)
$ 844,314 $
5,121,413
47,049
$ 3,749,701 $
(4,278,871)
(5es,880) $
(48,808) 20,846,343
2,652
59,816,779
110,624
56,970
261,876
1,308,633 g 4,769,449
318,846 $ (529,170) $$ 6,012/76 $
-38
688) $ 22,t57,628 $ ,852
Net change in fund balances - total governmental funds
Amounts reported for governmental activities in the statement
of activities are
different because:
Government funds report capital outlays as expenditures while
governmental activities report depreciation expense to allocate
those
expenditures overthe life of the assets. capital ouflay
expenditures
exceeded depreciation expense in the current year, as follows:
Net acquisition of capital assets
Depreciation expense
Because some revenues will not be collected for several months
after the
City's year end, they are not considered available revenues and
are
deferred in the governmentalfunds, as follows:
Other
Proceeds from issuing long-term liabilities provide current
financial
resources to governmental funds, but issuing debt increases
long-term
liabilities in the Statement of net posítion. Repayment of long-
term
liabilities is an expenditure in the governmental funds, but the
repayment
reduces long-term liabilities in the Statement of net position.
current year
repayments exceeded issues, as follows:
Discount on general obligation bonds
Repaid
Accrued interest
some expenses reported in the statement of Activities do not
require the
use of current financial resources and, therefore, are not
reported as
expenditures in governmental funds, as follows:
Compensated absences
Other postemployment benefìts
Change in inventory
lnternal service funds are used by management to charge the
costs of
fleet management, management information systems and risk
management activities to individual funds. The net revenue of
certaín
activities of internal service funds is reported with
governmental activities
Change in net position of governmental activities
City of Gedar Falls, lowa
Reconciliation of the Statement of Revenues, Expenditures, and
Changes in Fund Balances -
Governmental Funds to the Statement of Activities
For the Year Ended June 30, 2013
8,392,833
16. 795,933)
1 926
38,262
2,685,000
4 572
1,194
(67,810)
110,623
$ +,t69,449
1,596,900
(183,926)
2,727,834
44,007
(840,6e0)
See notes to financial statements
-39-
$ 8,113.574
City of Gedar Falls, lowa
Statement of Net Position
Proprietary Funds
June 30, 2013
ASSETS
Current assets:
Cash
Receivables, net of allowance
for uncollectible amounts:
Accrued interest
Other
lnventories
Total current assets
Noncurrent assets:
Capital assets:
Land
Buildings
Machinery and equipment
lnfrastructure
Construction in progress
Accu mulated depreciation
Total noncurrent assets
Totalassets
LIABILITIES
Current liabilities:
Accounts payable
Accrued liabilities
Bonds payable - due within one year
Compensated absences - due within one year
Total current liabilities
Noncurrent liabilities:
Bonds payable- after one year
Advance from other funds
Compensated absences - after one year
Total noncurrent liabilities
Total liabilities
NET POSITION
Net investment in capital assets
Restricted for post closure costs
Unrestricted
Total net position
B usiness-type Activities -
Enterprise Fund
Sewer Fund Refuse Fund
$ 4,943,465 $ 2,740,373
6,921
741,598
40 937
5 73 921$g
2,916
366,850
27 759
137 898
$ zzs,aza
11,595,276
5,506,598
29,629,206
27,921,795
(16,716,752
$ 58,715,981
$ 64,448,902
$ 1,487,753
53,530
635,000
76,255
$ 2o4,B4s
12,338,507
2,457,434
14,666
(1,969 ,065)
$ 13.046 ,387
184 85
$ 46,596
19,291
1
55,451
2 252 538 $ 't21,338
$ 2,517,973
15,340,000
119,479
$
217,041
$ 17,977 ,452 $ 217,041
$ 20,229,990 $ 338,329
$ 54,678,714 $ 13,046,397
9,500
1 459 802 790 019
fi 44,218,912
See notes to financial statements
-40-
$ 15,845,906
Business-type Activities -
Governmental
Activities -
lnternal
Service Funds
Enterorise Fund
Storm Water Fund Total
fi 2,048,583 $ 9]32,qZt $ 13,268,189
2,140
37,072
I'1,977
1,145,520
68,696
16,153
10,603
328,787
$ 2,087,79s $ to, 958,614 $ 13,623,732
$ 627,858 $
90,302
7,649,361
16,229,637
22,519
(4,926,175
$ 11,952,839
$ 14,040,634
$ 12,356
4,141
$
$ 1,612,581
23,933,793
7,964,022
45,857,843
27,959,970
(23,611,992
$ 83,715,207
$ 94,673,821
(5,050,093)
$ 2,689,570
$ 16,313,302
1,546,705
76,962
635,000
138,633
489,014
597,837
$
$ 55,154
55 154
$ t,186,611
$
6,927
$
$ 23,424 397 300
$ 2,517,973
15,340,000
352,641
8 18,210,614
$ 20,607,914
16 12'l
$ 16,121
$ s9,s4s
$ 11,952,839
2,048,250
$ 14,001,089
$ 2,689,570
1 437 121
$ 15,126,691
-41 -
City of Cedar Falls, lowa
statement of Revenues, Expenses, and changes in Fund Net
position
Proprietary Funds
Forthe Year Ended June 30,2013
Business-type Activities -
Enterprise Funds
Sewer Fund Refuse Fund
Operating revenues:
Charges for services
Other
Total operating revenues
Operating expenses:
Personal services
Contractual services
Supplies and equipment
Depreciation
Total operating expenses
Operating income
Nonoperating revenues (expenses):
lnterest revenue
lnterest expense
Gain (loss) on disposal of equipment
Nonoperating revenues (expenses), net
lncome before contributions and transfers
Capital contributions
Transfers in
Transfers out
Contributions and transfers, net
Change in net position
Net position, beginning
Net position, ending
$ 4,572,082
2,099
$ 2,4s0,482
545,914
181 $ 2,996,3964 574
$ 1,192,506
782,117
279,469
954,072
$ 1,128,444
1,140,222
84,352
417,246
,264$ 3,208,163 $ 2]70
1 366 018 $ 226,132
$ 22,191
(409,525)
$ 9,712
$ (387 ,334) $ 9,712
$ 978,684 $ 235,844
$ 178,979
2,431,073
(797,983)
$
343,792
(133,450)
$ 1.812,068 $ 210,342
$ 2,790,752 $ 446,196
41,429,160 15,399,720
See notes to financial statements
-42-
_$ 44218,912 _qj_5,845,906
Storm Water Fund
Business-type Activities -
Enterprise Funds
Governmental
Activities-
lnternal
Service FundsTotal
$ 823,814
67,079
7,846,379
615,092
$ 6,311,468
204,351
$
$ 890,893 $ 8,461 ,470 $ 6,51s,819
$ 223,050
97,573
17,607
390,483
2,544,000
2,019,912
381,427
1,761,9O1
$ 1,413,994
4,235,561
1,147 ,335
41g,Og2
$
$ 728,713 $ 6,70r,140 $ 7,214,872
$ 162j80 $ 1 754 330 $ (699,053)
$ 6,993 $ 3g,gg6
(409,525)
$ s2,7s7
(30,137)
$ 6,983 $ (370,639) 22 620
$ 169,163 $ 1.383 $ (676,433),691
$ 398,433 $ 577,411 $
2,774,965
(931,433) (164,257)
$ 398,433 $ 2,420,943 164 257
$
$74
567,596$3,904,534$(940,690)
13,433,493 70,261,373 15,967,391
$ 15,126,691$ 14,001,099 065
-43-
City of Cedar Falls, lowa
Statement of Cash Flows
Proprietary Funds
For the Year Ended June 30,2019
CASH FLOWS FROM OPERATING ACTIVITIES
Receipts from customers and users
Receipts from interfund services
Payments to suppliers
Payments to employees
Net cash provided by operating activities
CASH FLOWS FROM NONCAPITAL FINANCING
ACTIVITIES
Transfers from other funds
Transfers to other funds
Net cash provided by (used for) noncapital financing activities
CASH FLOWS FROM CAPITAL AND RELATED FINANCING
ACTIVITIES
Net acquisition of property and equipment
Capital contributions
Advance from other funds
Principal paid on debt maturities
Payments on advance from other funds
lnterest paid
Net cash (used for) capital and related financíng activities
CASH FLOWS FROM INVESTING ACTIVITIES
Interest received on investments
Net increase (decrease) in cash
CASH BALANCES, Beginning
CASH BALANCES, Ending
Reconciliation of operating income to net cash provided by
operating activities:
Operating income (loss)
Adjustments to reconcile operating income
to net cash provided by operating activities:
Depreciation
Change in assets and liabilities:
(lncrease) decrease in:
Customer and other receivables
lnventories
lncrease (decrease) in accounts payable, accrued and other
liabilities
Net cash provided by operating activities
See notes to financial statements
Business-type
Activities -
Enterprise Funds
Sewer
Fund
$ 4,490,696
(323,299)
(.173.442 )
2 I 945
$ 2,431,013 .
(797,993)
$ 1.633 ,090
$ (10,622,149)
17g,g7B
7,700,000
(615,000)
(560,000)
(383 ,166)
$ (4,301.336
21 479$
$ 1,366,01g
954,072
(83,079)
3,406
753.527
-44-
$2 945
Busíness-type Activities -
Enterprise Funds
Governmental
Activities -
lnternal
Service Funds
6,290,399
(5,029,794)
(1.0 04,492
113
(164,257
Refuse
Fund
Storm Water
Fund Total
$ 2,957,493 $ 985,277 $ 8,333,456 $
(1,256,072) (1,697,960)
(1.107 ,889) 2 500 888
$ 210 342 $ $ 1,843,432 $ (164,257)
$ (243,002) $
(108,589)
(219,557
$ 593,532 $ 557,131 $ 4.144,608 $ 257
$ 343,792
(133,450)
$ $ 2,774,865 $
(931 ,433)
$(
(519,789)
398,433
243,002) $ (121,356)
I '156 $ 6,T04
$ 442,479
$ (11,384,939)
577,411
7,700,000
(615,000)
(560,000)
(383,166)
$ (4,665,694)
$ (213,717)
$eß ,717
$
$ s7o,o2g
2,170,345
$ 2,740,373
$
$
37,339 $ 52,608
606 1041
1,359,685
8,372,736
$ 9,732,421
$ (68,253)
13,336,442
$ 13,268,189$ 2,048,s83
$ 226,132 $ 162,180 $ 1,754,330 $ (699,053)
417,246 390,483 1,761,901 419,092
(52,442)
(3,702)
(5,616)
6 298 10 084
(141,136)
(2e6)
769,909
233,249
(92,015)
396 851
$ $ 4,144,609 $593 532 $ 557,131
-45-
257,113
dar Falls
Oveffnan Park
NOTE I
NOTE 2
CITY OF CEDAR FALLS, ¡OWA
NOTES TO FINANCIAL STATEMENTS
INDEX
SUMMARY OF SIGN¡FICANT ACCOUNTING POLICIES
A. Reporting Entity
B. Government-wideand Fund FinancialStatements
C. Measurement Focus, Basis of Accounting, and Financial
Statement Presentation
D. Assets, Liabilities, and Net position or Equity
STEWARDSHIP, COMPLIANCE, AND ACCOUNTABILITY
A. Budgetarylnformation
B. Deficit Fund Balances
NOTE 3. DETA¡L NOTES ON ALL FUNDS
A. Deposits and lnvestments
B. Receivable
C. CapitalAssets
D. Leases
E. Long{erm Debt
F. Long-termLiabilities
G. lnterfund Balances
H. lnterfundTransactions
NOTE 4. OTHER NOTES
A. Retirement Systems
B. Due To/From Component Unit
C. Related Party Transactions
D. Risk Management
E. Commitments and Contingencies
F. New GovernmentalAccounting Standards Board (GASB)
Standards
-46-
Note 1 Summary of Significant Accounting Policies
Reporting Entity
The City of Cedar Falls is a municipal corporation governed by
an elected mayor and seven-member
council. As required by accounting principles generally
accepted in the United States of America,
these financial statements present the City and its component
units, entities for which the City is
considered to be financially accountable. The discretely
presented component units are reported in a
separate column in the combined financial statements to
emphasize that they are legally separate
from the City. The discretely presented electric, gas, water, and
communications utilities each have a
December 31 year end.
Discretely Presented Component Unls. The electric, gas, water,
and communications utilities serve
all the citizens of the City and are governed by a five-member
board appointed by the mayor of the
City of Cedar Falls. The rates for user charges and bond
issuance authorizations are approved by the
City Council, and the legal liability for the general obligation
portion of the Utilities' debt remains with
the City.
Complete financial statements for the Utilities may be obtained
at the administrative offices
Cedar Falls Utilities
Utility Parkway
Cedar Falls, lowa 50613
Jointly Governed Organizations. The City also participates in
several jointly governed organizations
for which the City is not financially accountable or that the
nature and significance of the relationship
with the City are such that exclusion does not cause the City's
financial statements to be misleading or
incomplete. City officials are members of the following boards
and commissions: Black Hawk County
Consolidated Public Safety Communications Center, Black
Hawk County Solid Waste Management
Commission, Black Hawk County Criminal Justice lnformation
Systems and Metropolitan Transit
Authority.
Government-wide and Fund Financial Statements
The government-wide financial statements (i.e., the statement of
net position and the statement of
activities) report information on all of the activities of the
primary government and its component uníts.
For the most part, the effect of interfund activity has been
removed from these statements.
Governmental activities, which normally are supported by taxes
and intergovernmental revenues, are
reported separately from business{ype activities, which rely to a
significant extent on fees and
charges for support. Likewise, the primary government is
reported separately from certain legally
separate component units for which the primary government is
financially accountable.
The statement of net position presents the assets and liabilities,
with the difference reported as net
position. Net position are reported in three categories.
Net investment in capital assefs consists of capital assets, net of
accumulated depreciation and
reduced by outstanding balances for bonds, notes, and other
debt that are attributed to the
acquisition, construction, or improvement of those assets.
Restricted net position result when constraints placed on net
asset use are either externally
imposed or imposed by law through constitutional provisions or
enabling legislation.
A.
B.
-47 -
c.
Unrestricted net position consist of net position that do not meet
the definition of the two preceding
categories. Unrestricted net position often have constraints on
resources that are imposed by
management, but can be removed or modified.
The statement of activities demonstrates the degree to which the
direct expenses of a given function
or segment are offset by program revenues. Direct expenses are
those that are clearly identifiable
with a specific function or segment. Program revenues include
1) charges to customers or applicants
who purchase, use, or directly benefit from goods, services, or
privileges provided by a given function
or segment and 2) grants and contributions that are restricted to
meeting the operational or capital
requirements of a particular function or segment. Taxes and
other items not properly included among
program revenues are reported instead as general revenues.
Separate financial statements are provided for governmental
funds and proprietary funds. Major
individual governmental funds and major individual proprietary
funds are reported as separate
columns in the fund financial statements. All remaining
governmental funds are aggregated and
reported as other governmental funds.
Measurement Focus, Basis of Accounting, and Financial
Statement Presentation
The government-wide financíal statements are reported using
the economic resources measurement
focus and the accrual basis of accounting, as are the proprietary
fund financial statements. Revenues
are recorded when earned and expenses are recorded when a
liability is incurred, regardless of the
timing of the related cash flows. Property taxes are recognized
as revenues in the year for which they
are levied. Grants and similar items are recognized as revenue
as soon as all eligibility requirements
imposed by the provider have been met.
Governmental fund financial statements are reported using the
current financial resources
measurement focus and the modified accrual basis of
accounting. Revenues are recognized as soon
as they are both measurable and avaílable. Revenues are
considered to be available when they are
collectible within the current period or soon enough thereafter
to pay liabilities of the current period.
For this purpose, the government considers revenues to be
available if they are collected within 60
days of the end of the current fiscal períod. Expenditures
generally are recorded when a liability is
incurred, as under accrual accounting. However, debt service
expenditures, as well as expenditures
related to compensated absences and claims and judgments, are
recorded only when payment is
due.
Property taxes, franchíse taxes, licenses, interest, fines and
forfeitures, and special assessments are
susceptible to accrual. Sales taxes collected and held by the
state at year-end on behalf of the City
are also recognized as revenue. Other receipts and taxes become
measurable and available when
cash is received by the City and are recognized as revenue at
that time.
Entitlements and shared revenues are recorded at the time of
receipt or earlier if the susceptible to
accrual criteria are met. Expenditure-driven grants are
recognized as revenue when the qualifying
expenditures have been incurred, all other grant requirements
have been met, and the criteria for
accrual has been met.
The City reports the following major governmental funds:
The general fund is the City's primary operating fund. lt
accounts for all financial resources of the
general government, except those required to be accounted for
in another fund.
48-
The hospiúal fund accounts for the lease income derived from
Sartori Memorial Hospital.
The TIF fund accounts for property taxes received through tax
increment financing.
The sfreef repair fund accounts for local option sales tax
received from the state to be used to
repair streets.
The sfreef construction fund accounts for state revenues
allocated to the City to be used to
maintain and improve the City's streets.
The debf service fund accounts for the servicing of general
long-term debt not being financed by
proprietary funds.
The FEMA fund accounts for the proceeds and expenditures
related to disaster assistance and
recovery.
Ihe bond fund accounts for all bond proceeds not related to
proprietary funds and all the related
capital projects associated with the bond sales.
The City reports the following major proprietary funds:
The setøer fund accounts for the operations and maintenance of
the City's sanitary sewer system.
The refuse fund accounts for the operations and maintenance of
the City's garbage collection.
The sform water fund accounts for the operations and
maintenance of the city's storm water
system.
Additionally, the City reports the following fund type:
lnternal service funds account for operations that provide
services to other departments or
agencies of the City, or to other governments, on a cost-
reimbursement basis. These include
data processing, vehicle maintenance, health insurance, health
insurance severance, payroll, and
risk management activities.
As a general rule the effect of interfund activity has been
eliminated from the government-wide
financial statements. Exceptions to this general rule are
payments between the government's refuse
and sewer functions and various other functions of the
government. Elimination of the charges would
distort the direct costs and program revenues reported for the
various functions concerned.
Amounts reported as program revenues include 1) charges to
customers or applicants for goods,
services, or privileges provided, 2) operating grants and
contributions, and 3) capital grants and
contributions. lnternally dedicated resources are reported as
general revenues rather than as
program revenues. Likewise, general revenues include all taxes.
Proprietary funds distinguish operating revenues and expenses
from nonoperating items. Operating
revenues and expenses generally result from providing services
and producing and delivering goods
in connection with a proprietary fund's principal ongoing
operations. The principal operating revenues
of the refuse fund, sewer fund, and the government's internal
service funds are charges to customers
for services. Operating expenses for enterprise funds and
internal service funds include the cost of
services, administrative expenses, and depreciation on capital
assets. All revenues and expenses
not meeting this definition are reported as nonoperating
revenues and expenses.
When both restricted and unrestricted resources are available
for use, it is the government's policy to
use restricted resources first, then unrestricted resources as they
are needed.
-49-
D. Assets, Liabilities, and Net position or Equity
1. Deposr'fs and lnvestments
The City's cash and cash equivalents are considered to be cash
on hand, demand deposits, and
short-term investments with original maturities of three months
or less from the date of
acquisition.
State statutes authorize the City and the Utility to invest publíc
funds in obligations of the United
States government, its agencies and instrumentalities;
certificates of deposit or other evidences of
deposit at federally insured depository institutions approved by
the City Council; prime eligible
bankers acceptances; certain high-rated commercial paper;
perfected repurchase agreements;
certain registered open-end management investment companies;
certain joint investment trusts;
and warrants or improvement certificates of a drainage district.
lnvestments of the City and the
Utility are reported at fair value. Due to legal and budgetary
reasons, the General Fund is
assigned a portion of the investment earnings associated with
the other funds. These funds are
Street Construction, Debt Service, and the Cemetery Perpetual
Care Funds.
2. Receivables and Payables
Activity between funds that are representative of
lending/borrowing arrangements outstanding at
the end of the fiscal year are referred to as either "due to/from
other funds" (i.e., the current
portion of interfund loans).
All trade and property tax receivables are shown net of an
allowance for uncollectibles.
The County Treasurer bills and collects taxes for the City.
Taxes for the year ended June 30,
2013, were certified with the County during the preceding fiscal
year and were due in two equal
installments by September 30, 2012 and March 31,2013.
Property tax receivable is recognized
on the levy or lien date, which is the date the tax asking is
certified by the City to the County Board
of Supervisors. Any County collections on the 2012-2013 tax
levy remitted to the City within sixty
days subsequentto June 30,2013, are recorded as propertytax
revenues. Taxes notcollected
and remitted to the City within sixty days subsequent to June
30, 2013, are delinquent and have
been recorded as receivables and deferred revenue.
By statute, the City is required to certify its budget in March of
each year for the subsequent fiscal
year. However, by statute, the tax asking and budget
certification for the following fiscal year
becomes effective on the first day of that year. Although the
succeeding year property tax
receivable has been recorded, the related revenue is deferred
and will not be recognized as
revenue until the year for which it is levied.
3. Inventories and Prepaíd ltems
lnventories in the governmental fund types are valued at cost
using the first-in/first-out method.
The costs of governmental fund type inventories are recognized
as expenditures when purchased.
lnventories in the proprietary fund types and component unit are
valued at the lower of first-in/first-
out cost or market, except for fuel inventories of the Electric
Utility, which are valued at the lower
of last-in/first-out method cost or market. The cost of
proprietary fund type and component unit
inventories are recognized as expenses when consumed.
-50-
Certain payments to vendors reflect costs applicable to future
accounting periods and are
recorded as prepaid items in both government-wide and fund
financial statements.
4. Restricted Assefs
Certain assets of the component units are restricted because of
applicable bond provisions
5. Capital Assefs
Capital assets, which include property, plant, equipment, and
infrastructure assets (e.g., roads,
bridges, sidewalks, and similar items), are reported in the
applicable governmental or business-
type activities columns in the government-wide statement of net
position. Capital assets are
defined by the government as equipment with initial, individual
cost of $2,500 or greater or a
purchase of land, land improvements, building, or infrastructure
with a value of $5,000 or greater
and an estimated useful life of greater than one year. Such
assets are recorded at historical cost
or estimated historical cost if purchased or constructed. Donated
capital assets are recorded as
estimated fair market value at the date of donation.
The costs of normal maintenance and repairs that do not add to
the value of the asset or
materially extend asset lives are not capitalized.
Major outlays for capital assets and improvements are
capitalized as projects are constructed.
lnterest incurred during the construction phase of capital assets
of business{ype activities is
included as part of the capitalized value of the assets
constructed.
Capital assets are depreciated using the straight-line method
over the following estimated useful
lives:
Computer Equipment 5 years Streets 30 years
Equipment 10-30 years Buildings 40-50 years
Office Equipment 10-30 years Land lmprovements 20-40 years
Vehicles 10-20 years Storm Water 40 years
Parking Lots 15 years Bridges 45 years
Furniture 20 years Lift Stations 50 years
Large Vehicles 20-40 years Sewer 50 years
Traffic Signals 20 years Historic Buildings 100 years
6. Compensated Absences
City employees accumulate vacation, sick leave, and comp-time
hours for subsequent use or for
payment upon termination, death, or retirement. Earned vacation
pay and a maximum of one-half
of all unused sick leave may be paid upon termination of
employment.
All severance is accrued when incurred in the government-wide
and proprietary fund financial
statements. A liability for these amounts is reported in
governmental fund financial statements
51
only for employees that have resigned or retired. The
compensated absence liability has been
computed based on rates of pay in effect on June 30, 2013.
7. Long-term Obligations
ln the government-wide financial statements and proprietary
fund financiaf statements, long{erm
debt and other long{erm obligations are reported as liabilities in
the applicable governmental
activities, business-type activities, or proprietary fund type
statement of net position. Bond
premiums and discounts are deferred and amortized over the life
of the bonds using the straight-
line method. Bonds payable are reported net of the applicable
bond premium or discount.
ln the fund financial statements, governmentalfund types
recognize bond premium and discounts,
as well as bond issuance costs, during the current period. The
face amount of debt issued is
reported as other financing sources. Premiums on debt issuances
are reported as other financing
CITY OF CEDAR FALLS, IOWAComprehensive AnnualFinancial R.docx

More Related Content

Similar to CITY OF CEDAR FALLS, IOWAComprehensive AnnualFinancial R.docx

SRF Entries & T-accounts DUE FROMreference Account Ti.docx
SRF Entries & T-accounts     DUE FROMreference          Account Ti.docxSRF Entries & T-accounts     DUE FROMreference          Account Ti.docx
SRF Entries & T-accounts DUE FROMreference Account Ti.docxwhitneyleman54422
 
Item # 6 - Annual Comprehensive Financial Report FY 2021
Item # 6 - Annual Comprehensive Financial Report FY 2021Item # 6 - Annual Comprehensive Financial Report FY 2021
Item # 6 - Annual Comprehensive Financial Report FY 2021ahcitycouncil
 
MICHIGAN We hope for It shall rise again bette.docx
MICHIGAN We hope for It shall rise again bette.docxMICHIGAN We hope for It shall rise again bette.docx
MICHIGAN We hope for It shall rise again bette.docxARIV4
 
Colton City of COMPREHENSIVE ANNUAL FINANCIAL REPORT .docx
Colton City of COMPREHENSIVE ANNUAL FINANCIAL REPORT .docxColton City of COMPREHENSIVE ANNUAL FINANCIAL REPORT .docx
Colton City of COMPREHENSIVE ANNUAL FINANCIAL REPORT .docxdrandy1
 
Colton City of COMPREHENSIVE ANNUAL FINANCIAL REPORT .docx
Colton City of COMPREHENSIVE ANNUAL FINANCIAL REPORT .docxColton City of COMPREHENSIVE ANNUAL FINANCIAL REPORT .docx
Colton City of COMPREHENSIVE ANNUAL FINANCIAL REPORT .docxcargillfilberto
 
Colton City of COMPREHENSIVE ANNUAL FINANCIAL REPORT .docx
Colton City of COMPREHENSIVE ANNUAL FINANCIAL REPORT .docxColton City of COMPREHENSIVE ANNUAL FINANCIAL REPORT .docx
Colton City of COMPREHENSIVE ANNUAL FINANCIAL REPORT .docxpickersgillkayne
 
Financial Condition of the County 2011
Financial Condition of the County 2011Financial Condition of the County 2011
Financial Condition of the County 2011Amanda Lamb
 
2015 02 March April Village Newsletter
2015 02 March April Village Newsletter2015 02 March April Village Newsletter
2015 02 March April Village NewsletterDavid Genty
 
Comprehensive Annual Financial Report City of Middle.docx
Comprehensive Annual Financial Report City of Middle.docxComprehensive Annual Financial Report City of Middle.docx
Comprehensive Annual Financial Report City of Middle.docxdonnajames55
 
Item # 5 - Annual Compr. Financial Report
Item # 5 - Annual Compr. Financial ReportItem # 5 - Annual Compr. Financial Report
Item # 5 - Annual Compr. Financial Reportahcitycouncil
 
2023 07 10 City Commission Budget Workshop Agenda Packet
2023 07 10 City Commission Budget Workshop Agenda Packet2023 07 10 City Commission Budget Workshop Agenda Packet
2023 07 10 City Commission Budget Workshop Agenda PacketVictoriaColangelo
 
Fitch Affirms San Joaquin Delta CCD, CA's GOs at 'AA-'; Outlook Stable
Fitch Affirms San Joaquin Delta CCD, CA's GOs at 'AA-'; Outlook StableFitch Affirms San Joaquin Delta CCD, CA's GOs at 'AA-'; Outlook Stable
Fitch Affirms San Joaquin Delta CCD, CA's GOs at 'AA-'; Outlook Stableobeisantbreeze194
 
AnnualBondholdersReportFY2015
AnnualBondholdersReportFY2015AnnualBondholdersReportFY2015
AnnualBondholdersReportFY2015Linda Short
 
DUE SUNDAY 830pmAnswer the following post Discussion Week Five.docx
DUE SUNDAY 830pmAnswer the following post Discussion Week Five.docxDUE SUNDAY 830pmAnswer the following post Discussion Week Five.docx
DUE SUNDAY 830pmAnswer the following post Discussion Week Five.docxhasselldelisa
 
Item # 8 - FY23 Annual Comprehensive Financial Report
Item # 8 - FY23 Annual Comprehensive Financial ReportItem # 8 - FY23 Annual Comprehensive Financial Report
Item # 8 - FY23 Annual Comprehensive Financial Reportahcitycouncil
 

Similar to CITY OF CEDAR FALLS, IOWAComprehensive AnnualFinancial R.docx (20)

SRF Entries & T-accounts DUE FROMreference Account Ti.docx
SRF Entries & T-accounts     DUE FROMreference          Account Ti.docxSRF Entries & T-accounts     DUE FROMreference          Account Ti.docx
SRF Entries & T-accounts DUE FROMreference Account Ti.docx
 
Item # 6 - Annual Comprehensive Financial Report FY 2021
Item # 6 - Annual Comprehensive Financial Report FY 2021Item # 6 - Annual Comprehensive Financial Report FY 2021
Item # 6 - Annual Comprehensive Financial Report FY 2021
 
Item # 5
Item # 5  Item # 5
Item # 5
 
MICHIGAN We hope for It shall rise again bette.docx
MICHIGAN We hope for It shall rise again bette.docxMICHIGAN We hope for It shall rise again bette.docx
MICHIGAN We hope for It shall rise again bette.docx
 
Yu - budget-glance-2014-15
Yu -  budget-glance-2014-15Yu -  budget-glance-2014-15
Yu - budget-glance-2014-15
 
Colton City of COMPREHENSIVE ANNUAL FINANCIAL REPORT .docx
Colton City of COMPREHENSIVE ANNUAL FINANCIAL REPORT .docxColton City of COMPREHENSIVE ANNUAL FINANCIAL REPORT .docx
Colton City of COMPREHENSIVE ANNUAL FINANCIAL REPORT .docx
 
Colton City of COMPREHENSIVE ANNUAL FINANCIAL REPORT .docx
Colton City of COMPREHENSIVE ANNUAL FINANCIAL REPORT .docxColton City of COMPREHENSIVE ANNUAL FINANCIAL REPORT .docx
Colton City of COMPREHENSIVE ANNUAL FINANCIAL REPORT .docx
 
Colton City of COMPREHENSIVE ANNUAL FINANCIAL REPORT .docx
Colton City of COMPREHENSIVE ANNUAL FINANCIAL REPORT .docxColton City of COMPREHENSIVE ANNUAL FINANCIAL REPORT .docx
Colton City of COMPREHENSIVE ANNUAL FINANCIAL REPORT .docx
 
Financial Condition of the County 2011
Financial Condition of the County 2011Financial Condition of the County 2011
Financial Condition of the County 2011
 
2015 02 March April Village Newsletter
2015 02 March April Village Newsletter2015 02 March April Village Newsletter
2015 02 March April Village Newsletter
 
Comprehensive Annual Financial Report City of Middle.docx
Comprehensive Annual Financial Report City of Middle.docxComprehensive Annual Financial Report City of Middle.docx
Comprehensive Annual Financial Report City of Middle.docx
 
Item # 5 - Annual Compr. Financial Report
Item # 5 - Annual Compr. Financial ReportItem # 5 - Annual Compr. Financial Report
Item # 5 - Annual Compr. Financial Report
 
2023 07 10 City Commission Budget Workshop Agenda Packet
2023 07 10 City Commission Budget Workshop Agenda Packet2023 07 10 City Commission Budget Workshop Agenda Packet
2023 07 10 City Commission Budget Workshop Agenda Packet
 
DC Development Report: 2014/2015 Edition
DC Development Report: 2014/2015 EditionDC Development Report: 2014/2015 Edition
DC Development Report: 2014/2015 Edition
 
Government Finance Officers Association (GFOA) Budget Analysis
Government Finance Officers Association (GFOA) Budget AnalysisGovernment Finance Officers Association (GFOA) Budget Analysis
Government Finance Officers Association (GFOA) Budget Analysis
 
Fitch Affirms San Joaquin Delta CCD, CA's GOs at 'AA-'; Outlook Stable
Fitch Affirms San Joaquin Delta CCD, CA's GOs at 'AA-'; Outlook StableFitch Affirms San Joaquin Delta CCD, CA's GOs at 'AA-'; Outlook Stable
Fitch Affirms San Joaquin Delta CCD, CA's GOs at 'AA-'; Outlook Stable
 
AnnualBondholdersReportFY2015
AnnualBondholdersReportFY2015AnnualBondholdersReportFY2015
AnnualBondholdersReportFY2015
 
DUE SUNDAY 830pmAnswer the following post Discussion Week Five.docx
DUE SUNDAY 830pmAnswer the following post Discussion Week Five.docxDUE SUNDAY 830pmAnswer the following post Discussion Week Five.docx
DUE SUNDAY 830pmAnswer the following post Discussion Week Five.docx
 
Item # 8 - FY23 Annual Comprehensive Financial Report
Item # 8 - FY23 Annual Comprehensive Financial ReportItem # 8 - FY23 Annual Comprehensive Financial Report
Item # 8 - FY23 Annual Comprehensive Financial Report
 
HTown Day 2012 - The Honorable Ronald C. Green
HTown Day 2012 - The Honorable Ronald C. GreenHTown Day 2012 - The Honorable Ronald C. Green
HTown Day 2012 - The Honorable Ronald C. Green
 

More from monicafrancis71118

1. Discuss Blockchains potential application in compensation system.docx
1. Discuss Blockchains potential application in compensation system.docx1. Discuss Blockchains potential application in compensation system.docx
1. Discuss Blockchains potential application in compensation system.docxmonicafrancis71118
 
1. Describe the characteristics of the aging process. Explain how so.docx
1. Describe the characteristics of the aging process. Explain how so.docx1. Describe the characteristics of the aging process. Explain how so.docx
1. Describe the characteristics of the aging process. Explain how so.docxmonicafrancis71118
 
1. Dis. 7Should we continue to collect data on race and .docx
1. Dis. 7Should we continue to collect data on race and .docx1. Dis. 7Should we continue to collect data on race and .docx
1. Dis. 7Should we continue to collect data on race and .docxmonicafrancis71118
 
1. Differentiate crisis intervention from other counseling therapeut.docx
1. Differentiate crisis intervention from other counseling therapeut.docx1. Differentiate crisis intervention from other counseling therapeut.docx
1. Differentiate crisis intervention from other counseling therapeut.docxmonicafrancis71118
 
1. Despite our rational nature, our ability to reason well is ofte.docx
1. Despite our rational nature, our ability to reason well is ofte.docx1. Despite our rational nature, our ability to reason well is ofte.docx
1. Despite our rational nature, our ability to reason well is ofte.docxmonicafrancis71118
 
1. Describe the ethical challenges faced by organizations operating .docx
1. Describe the ethical challenges faced by organizations operating .docx1. Describe the ethical challenges faced by organizations operating .docx
1. Describe the ethical challenges faced by organizations operating .docxmonicafrancis71118
 
1. Describe in your own words the anatomy of a muscle.  This sho.docx
1. Describe in your own words the anatomy of a muscle.  This sho.docx1. Describe in your own words the anatomy of a muscle.  This sho.docx
1. Describe in your own words the anatomy of a muscle.  This sho.docxmonicafrancis71118
 
1. Describe how your attitude of including aspects of health literac.docx
1. Describe how your attitude of including aspects of health literac.docx1. Describe how your attitude of including aspects of health literac.docx
1. Describe how your attitude of including aspects of health literac.docxmonicafrancis71118
 
1. Choose a behavior (such as overeating, shopping, Internet use.docx
1. Choose a behavior (such as overeating, shopping, Internet use.docx1. Choose a behavior (such as overeating, shopping, Internet use.docx
1. Choose a behavior (such as overeating, shopping, Internet use.docxmonicafrancis71118
 
1. Case 3-4 Franklin Industries’ Whistleblowing (a GVV Case)Natali.docx
1. Case 3-4 Franklin Industries’ Whistleblowing (a GVV Case)Natali.docx1. Case 3-4 Franklin Industries’ Whistleblowing (a GVV Case)Natali.docx
1. Case 3-4 Franklin Industries’ Whistleblowing (a GVV Case)Natali.docxmonicafrancis71118
 
1. Cryptography is used to protect confidential data in many areas. .docx
1. Cryptography is used to protect confidential data in many areas. .docx1. Cryptography is used to protect confidential data in many areas. .docx
1. Cryptography is used to protect confidential data in many areas. .docxmonicafrancis71118
 
1. Compare and contrast steganography and cryptography.2. Why st.docx
1. Compare and contrast steganography and cryptography.2. Why st.docx1. Compare and contrast steganography and cryptography.2. Why st.docx
1. Compare and contrast steganography and cryptography.2. Why st.docxmonicafrancis71118
 
1. Date September 13, 2017 – September 15, 2017 2. Curr.docx
1. Date September 13, 2017 – September 15, 2017 2. Curr.docx1. Date September 13, 2017 – September 15, 2017 2. Curr.docx
1. Date September 13, 2017 – September 15, 2017 2. Curr.docxmonicafrancis71118
 
1. compare and contrast predictive analytics with prescriptive and d.docx
1. compare and contrast predictive analytics with prescriptive and d.docx1. compare and contrast predictive analytics with prescriptive and d.docx
1. compare and contrast predictive analytics with prescriptive and d.docxmonicafrancis71118
 
1. Creating and maintaining relationships between home and schoo.docx
1. Creating and maintaining relationships between home and schoo.docx1. Creating and maintaining relationships between home and schoo.docx
1. Creating and maintaining relationships between home and schoo.docxmonicafrancis71118
 
1. Compare and contrast Strategic and Tactical Analysis and its .docx
1. Compare and contrast Strategic and Tactical Analysis and its .docx1. Compare and contrast Strategic and Tactical Analysis and its .docx
1. Compare and contrast Strategic and Tactical Analysis and its .docxmonicafrancis71118
 
1. Coalition ProposalVaccination Policy for Infectious Disease P.docx
1. Coalition ProposalVaccination Policy for Infectious Disease P.docx1. Coalition ProposalVaccination Policy for Infectious Disease P.docx
1. Coalition ProposalVaccination Policy for Infectious Disease P.docxmonicafrancis71118
 
1. Company Description and Backgrounda. Weight Watchers was cr.docx
1. Company Description and Backgrounda. Weight Watchers was cr.docx1. Company Description and Backgrounda. Weight Watchers was cr.docx
1. Company Description and Backgrounda. Weight Watchers was cr.docxmonicafrancis71118
 
1. Come up with TWO movie ideas -- as in for TWO screenplays that .docx
1. Come up with TWO movie ideas -- as in for TWO screenplays that .docx1. Come up with TWO movie ideas -- as in for TWO screenplays that .docx
1. Come up with TWO movie ideas -- as in for TWO screenplays that .docxmonicafrancis71118
 
1. Choose a case for the paper that interests you. Most choose a .docx
1. Choose a case for the paper that interests you.  Most choose a .docx1. Choose a case for the paper that interests you.  Most choose a .docx
1. Choose a case for the paper that interests you. Most choose a .docxmonicafrancis71118
 

More from monicafrancis71118 (20)

1. Discuss Blockchains potential application in compensation system.docx
1. Discuss Blockchains potential application in compensation system.docx1. Discuss Blockchains potential application in compensation system.docx
1. Discuss Blockchains potential application in compensation system.docx
 
1. Describe the characteristics of the aging process. Explain how so.docx
1. Describe the characteristics of the aging process. Explain how so.docx1. Describe the characteristics of the aging process. Explain how so.docx
1. Describe the characteristics of the aging process. Explain how so.docx
 
1. Dis. 7Should we continue to collect data on race and .docx
1. Dis. 7Should we continue to collect data on race and .docx1. Dis. 7Should we continue to collect data on race and .docx
1. Dis. 7Should we continue to collect data on race and .docx
 
1. Differentiate crisis intervention from other counseling therapeut.docx
1. Differentiate crisis intervention from other counseling therapeut.docx1. Differentiate crisis intervention from other counseling therapeut.docx
1. Differentiate crisis intervention from other counseling therapeut.docx
 
1. Despite our rational nature, our ability to reason well is ofte.docx
1. Despite our rational nature, our ability to reason well is ofte.docx1. Despite our rational nature, our ability to reason well is ofte.docx
1. Despite our rational nature, our ability to reason well is ofte.docx
 
1. Describe the ethical challenges faced by organizations operating .docx
1. Describe the ethical challenges faced by organizations operating .docx1. Describe the ethical challenges faced by organizations operating .docx
1. Describe the ethical challenges faced by organizations operating .docx
 
1. Describe in your own words the anatomy of a muscle.  This sho.docx
1. Describe in your own words the anatomy of a muscle.  This sho.docx1. Describe in your own words the anatomy of a muscle.  This sho.docx
1. Describe in your own words the anatomy of a muscle.  This sho.docx
 
1. Describe how your attitude of including aspects of health literac.docx
1. Describe how your attitude of including aspects of health literac.docx1. Describe how your attitude of including aspects of health literac.docx
1. Describe how your attitude of including aspects of health literac.docx
 
1. Choose a behavior (such as overeating, shopping, Internet use.docx
1. Choose a behavior (such as overeating, shopping, Internet use.docx1. Choose a behavior (such as overeating, shopping, Internet use.docx
1. Choose a behavior (such as overeating, shopping, Internet use.docx
 
1. Case 3-4 Franklin Industries’ Whistleblowing (a GVV Case)Natali.docx
1. Case 3-4 Franklin Industries’ Whistleblowing (a GVV Case)Natali.docx1. Case 3-4 Franklin Industries’ Whistleblowing (a GVV Case)Natali.docx
1. Case 3-4 Franklin Industries’ Whistleblowing (a GVV Case)Natali.docx
 
1. Cryptography is used to protect confidential data in many areas. .docx
1. Cryptography is used to protect confidential data in many areas. .docx1. Cryptography is used to protect confidential data in many areas. .docx
1. Cryptography is used to protect confidential data in many areas. .docx
 
1. Compare and contrast steganography and cryptography.2. Why st.docx
1. Compare and contrast steganography and cryptography.2. Why st.docx1. Compare and contrast steganography and cryptography.2. Why st.docx
1. Compare and contrast steganography and cryptography.2. Why st.docx
 
1. Date September 13, 2017 – September 15, 2017 2. Curr.docx
1. Date September 13, 2017 – September 15, 2017 2. Curr.docx1. Date September 13, 2017 – September 15, 2017 2. Curr.docx
1. Date September 13, 2017 – September 15, 2017 2. Curr.docx
 
1. compare and contrast predictive analytics with prescriptive and d.docx
1. compare and contrast predictive analytics with prescriptive and d.docx1. compare and contrast predictive analytics with prescriptive and d.docx
1. compare and contrast predictive analytics with prescriptive and d.docx
 
1. Creating and maintaining relationships between home and schoo.docx
1. Creating and maintaining relationships between home and schoo.docx1. Creating and maintaining relationships between home and schoo.docx
1. Creating and maintaining relationships between home and schoo.docx
 
1. Compare and contrast Strategic and Tactical Analysis and its .docx
1. Compare and contrast Strategic and Tactical Analysis and its .docx1. Compare and contrast Strategic and Tactical Analysis and its .docx
1. Compare and contrast Strategic and Tactical Analysis and its .docx
 
1. Coalition ProposalVaccination Policy for Infectious Disease P.docx
1. Coalition ProposalVaccination Policy for Infectious Disease P.docx1. Coalition ProposalVaccination Policy for Infectious Disease P.docx
1. Coalition ProposalVaccination Policy for Infectious Disease P.docx
 
1. Company Description and Backgrounda. Weight Watchers was cr.docx
1. Company Description and Backgrounda. Weight Watchers was cr.docx1. Company Description and Backgrounda. Weight Watchers was cr.docx
1. Company Description and Backgrounda. Weight Watchers was cr.docx
 
1. Come up with TWO movie ideas -- as in for TWO screenplays that .docx
1. Come up with TWO movie ideas -- as in for TWO screenplays that .docx1. Come up with TWO movie ideas -- as in for TWO screenplays that .docx
1. Come up with TWO movie ideas -- as in for TWO screenplays that .docx
 
1. Choose a case for the paper that interests you. Most choose a .docx
1. Choose a case for the paper that interests you.  Most choose a .docx1. Choose a case for the paper that interests you.  Most choose a .docx
1. Choose a case for the paper that interests you. Most choose a .docx
 

Recently uploaded

Ecological Succession. ( ECOSYSTEM, B. Pharmacy, 1st Year, Sem-II, Environmen...
Ecological Succession. ( ECOSYSTEM, B. Pharmacy, 1st Year, Sem-II, Environmen...Ecological Succession. ( ECOSYSTEM, B. Pharmacy, 1st Year, Sem-II, Environmen...
Ecological Succession. ( ECOSYSTEM, B. Pharmacy, 1st Year, Sem-II, Environmen...Shubhangi Sonawane
 
Role Of Transgenic Animal In Target Validation-1.pptx
Role Of Transgenic Animal In Target Validation-1.pptxRole Of Transgenic Animal In Target Validation-1.pptx
Role Of Transgenic Animal In Target Validation-1.pptxNikitaBankoti2
 
Beyond the EU: DORA and NIS 2 Directive's Global Impact
Beyond the EU: DORA and NIS 2 Directive's Global ImpactBeyond the EU: DORA and NIS 2 Directive's Global Impact
Beyond the EU: DORA and NIS 2 Directive's Global ImpactPECB
 
Measures of Dispersion and Variability: Range, QD, AD and SD
Measures of Dispersion and Variability: Range, QD, AD and SDMeasures of Dispersion and Variability: Range, QD, AD and SD
Measures of Dispersion and Variability: Range, QD, AD and SDThiyagu K
 
psychiatric nursing HISTORY COLLECTION .docx
psychiatric  nursing HISTORY  COLLECTION  .docxpsychiatric  nursing HISTORY  COLLECTION  .docx
psychiatric nursing HISTORY COLLECTION .docxPoojaSen20
 
Unit-IV; Professional Sales Representative (PSR).pptx
Unit-IV; Professional Sales Representative (PSR).pptxUnit-IV; Professional Sales Representative (PSR).pptx
Unit-IV; Professional Sales Representative (PSR).pptxVishalSingh1417
 
Unit-V; Pricing (Pharma Marketing Management).pptx
Unit-V; Pricing (Pharma Marketing Management).pptxUnit-V; Pricing (Pharma Marketing Management).pptx
Unit-V; Pricing (Pharma Marketing Management).pptxVishalSingh1417
 
Grant Readiness 101 TechSoup and Remy Consulting
Grant Readiness 101 TechSoup and Remy ConsultingGrant Readiness 101 TechSoup and Remy Consulting
Grant Readiness 101 TechSoup and Remy ConsultingTechSoup
 
Micro-Scholarship, What it is, How can it help me.pdf
Micro-Scholarship, What it is, How can it help me.pdfMicro-Scholarship, What it is, How can it help me.pdf
Micro-Scholarship, What it is, How can it help me.pdfPoh-Sun Goh
 
Web & Social Media Analytics Previous Year Question Paper.pdf
Web & Social Media Analytics Previous Year Question Paper.pdfWeb & Social Media Analytics Previous Year Question Paper.pdf
Web & Social Media Analytics Previous Year Question Paper.pdfJayanti Pande
 
General Principles of Intellectual Property: Concepts of Intellectual Proper...
General Principles of Intellectual Property: Concepts of Intellectual  Proper...General Principles of Intellectual Property: Concepts of Intellectual  Proper...
General Principles of Intellectual Property: Concepts of Intellectual Proper...Poonam Aher Patil
 
The basics of sentences session 2pptx copy.pptx
The basics of sentences session 2pptx copy.pptxThe basics of sentences session 2pptx copy.pptx
The basics of sentences session 2pptx copy.pptxheathfieldcps1
 
How to Give a Domain for a Field in Odoo 17
How to Give a Domain for a Field in Odoo 17How to Give a Domain for a Field in Odoo 17
How to Give a Domain for a Field in Odoo 17Celine George
 
Presentation by Andreas Schleicher Tackling the School Absenteeism Crisis 30 ...
Presentation by Andreas Schleicher Tackling the School Absenteeism Crisis 30 ...Presentation by Andreas Schleicher Tackling the School Absenteeism Crisis 30 ...
Presentation by Andreas Schleicher Tackling the School Absenteeism Crisis 30 ...EduSkills OECD
 
TỔNG ÔN TẬP THI VÀO LỚP 10 MÔN TIẾNG ANH NĂM HỌC 2023 - 2024 CÓ ĐÁP ÁN (NGỮ Â...
TỔNG ÔN TẬP THI VÀO LỚP 10 MÔN TIẾNG ANH NĂM HỌC 2023 - 2024 CÓ ĐÁP ÁN (NGỮ Â...TỔNG ÔN TẬP THI VÀO LỚP 10 MÔN TIẾNG ANH NĂM HỌC 2023 - 2024 CÓ ĐÁP ÁN (NGỮ Â...
TỔNG ÔN TẬP THI VÀO LỚP 10 MÔN TIẾNG ANH NĂM HỌC 2023 - 2024 CÓ ĐÁP ÁN (NGỮ Â...Nguyen Thanh Tu Collection
 
ICT Role in 21st Century Education & its Challenges.pptx
ICT Role in 21st Century Education & its Challenges.pptxICT Role in 21st Century Education & its Challenges.pptx
ICT Role in 21st Century Education & its Challenges.pptxAreebaZafar22
 
ComPTIA Overview | Comptia Security+ Book SY0-701
ComPTIA Overview | Comptia Security+ Book SY0-701ComPTIA Overview | Comptia Security+ Book SY0-701
ComPTIA Overview | Comptia Security+ Book SY0-701bronxfugly43
 
Class 11th Physics NEET formula sheet pdf
Class 11th Physics NEET formula sheet pdfClass 11th Physics NEET formula sheet pdf
Class 11th Physics NEET formula sheet pdfAyushMahapatra5
 
Python Notes for mca i year students osmania university.docx
Python Notes for mca i year students osmania university.docxPython Notes for mca i year students osmania university.docx
Python Notes for mca i year students osmania university.docxRamakrishna Reddy Bijjam
 
PROCESS RECORDING FORMAT.docx
PROCESS      RECORDING        FORMAT.docxPROCESS      RECORDING        FORMAT.docx
PROCESS RECORDING FORMAT.docxPoojaSen20
 

Recently uploaded (20)

Ecological Succession. ( ECOSYSTEM, B. Pharmacy, 1st Year, Sem-II, Environmen...
Ecological Succession. ( ECOSYSTEM, B. Pharmacy, 1st Year, Sem-II, Environmen...Ecological Succession. ( ECOSYSTEM, B. Pharmacy, 1st Year, Sem-II, Environmen...
Ecological Succession. ( ECOSYSTEM, B. Pharmacy, 1st Year, Sem-II, Environmen...
 
Role Of Transgenic Animal In Target Validation-1.pptx
Role Of Transgenic Animal In Target Validation-1.pptxRole Of Transgenic Animal In Target Validation-1.pptx
Role Of Transgenic Animal In Target Validation-1.pptx
 
Beyond the EU: DORA and NIS 2 Directive's Global Impact
Beyond the EU: DORA and NIS 2 Directive's Global ImpactBeyond the EU: DORA and NIS 2 Directive's Global Impact
Beyond the EU: DORA and NIS 2 Directive's Global Impact
 
Measures of Dispersion and Variability: Range, QD, AD and SD
Measures of Dispersion and Variability: Range, QD, AD and SDMeasures of Dispersion and Variability: Range, QD, AD and SD
Measures of Dispersion and Variability: Range, QD, AD and SD
 
psychiatric nursing HISTORY COLLECTION .docx
psychiatric  nursing HISTORY  COLLECTION  .docxpsychiatric  nursing HISTORY  COLLECTION  .docx
psychiatric nursing HISTORY COLLECTION .docx
 
Unit-IV; Professional Sales Representative (PSR).pptx
Unit-IV; Professional Sales Representative (PSR).pptxUnit-IV; Professional Sales Representative (PSR).pptx
Unit-IV; Professional Sales Representative (PSR).pptx
 
Unit-V; Pricing (Pharma Marketing Management).pptx
Unit-V; Pricing (Pharma Marketing Management).pptxUnit-V; Pricing (Pharma Marketing Management).pptx
Unit-V; Pricing (Pharma Marketing Management).pptx
 
Grant Readiness 101 TechSoup and Remy Consulting
Grant Readiness 101 TechSoup and Remy ConsultingGrant Readiness 101 TechSoup and Remy Consulting
Grant Readiness 101 TechSoup and Remy Consulting
 
Micro-Scholarship, What it is, How can it help me.pdf
Micro-Scholarship, What it is, How can it help me.pdfMicro-Scholarship, What it is, How can it help me.pdf
Micro-Scholarship, What it is, How can it help me.pdf
 
Web & Social Media Analytics Previous Year Question Paper.pdf
Web & Social Media Analytics Previous Year Question Paper.pdfWeb & Social Media Analytics Previous Year Question Paper.pdf
Web & Social Media Analytics Previous Year Question Paper.pdf
 
General Principles of Intellectual Property: Concepts of Intellectual Proper...
General Principles of Intellectual Property: Concepts of Intellectual  Proper...General Principles of Intellectual Property: Concepts of Intellectual  Proper...
General Principles of Intellectual Property: Concepts of Intellectual Proper...
 
The basics of sentences session 2pptx copy.pptx
The basics of sentences session 2pptx copy.pptxThe basics of sentences session 2pptx copy.pptx
The basics of sentences session 2pptx copy.pptx
 
How to Give a Domain for a Field in Odoo 17
How to Give a Domain for a Field in Odoo 17How to Give a Domain for a Field in Odoo 17
How to Give a Domain for a Field in Odoo 17
 
Presentation by Andreas Schleicher Tackling the School Absenteeism Crisis 30 ...
Presentation by Andreas Schleicher Tackling the School Absenteeism Crisis 30 ...Presentation by Andreas Schleicher Tackling the School Absenteeism Crisis 30 ...
Presentation by Andreas Schleicher Tackling the School Absenteeism Crisis 30 ...
 
TỔNG ÔN TẬP THI VÀO LỚP 10 MÔN TIẾNG ANH NĂM HỌC 2023 - 2024 CÓ ĐÁP ÁN (NGỮ Â...
TỔNG ÔN TẬP THI VÀO LỚP 10 MÔN TIẾNG ANH NĂM HỌC 2023 - 2024 CÓ ĐÁP ÁN (NGỮ Â...TỔNG ÔN TẬP THI VÀO LỚP 10 MÔN TIẾNG ANH NĂM HỌC 2023 - 2024 CÓ ĐÁP ÁN (NGỮ Â...
TỔNG ÔN TẬP THI VÀO LỚP 10 MÔN TIẾNG ANH NĂM HỌC 2023 - 2024 CÓ ĐÁP ÁN (NGỮ Â...
 
ICT Role in 21st Century Education & its Challenges.pptx
ICT Role in 21st Century Education & its Challenges.pptxICT Role in 21st Century Education & its Challenges.pptx
ICT Role in 21st Century Education & its Challenges.pptx
 
ComPTIA Overview | Comptia Security+ Book SY0-701
ComPTIA Overview | Comptia Security+ Book SY0-701ComPTIA Overview | Comptia Security+ Book SY0-701
ComPTIA Overview | Comptia Security+ Book SY0-701
 
Class 11th Physics NEET formula sheet pdf
Class 11th Physics NEET formula sheet pdfClass 11th Physics NEET formula sheet pdf
Class 11th Physics NEET formula sheet pdf
 
Python Notes for mca i year students osmania university.docx
Python Notes for mca i year students osmania university.docxPython Notes for mca i year students osmania university.docx
Python Notes for mca i year students osmania university.docx
 
PROCESS RECORDING FORMAT.docx
PROCESS      RECORDING        FORMAT.docxPROCESS      RECORDING        FORMAT.docx
PROCESS RECORDING FORMAT.docx
 

CITY OF CEDAR FALLS, IOWAComprehensive AnnualFinancial R.docx

  • 1. CITY OF CEDAR FALLS, IOWA Comprehensive Annual Financial Report For the Fiscal Year Ended June 30,20 13 Prepared by: Finance/Public Records Division of Department of Administrative Services Jennifer Rodenbeck, CPA, CPFO Finance Manage/City Clerk City of Cedar Falls, Iowa Gomprehensive Annual Financial Report For the Fiscal Year Ended June 30,2013 Table of Contents INTRODUCTORY SECTION Letter of Transmittal. . GFOA Certificate of Achievement . Organizational Charts . . . .
  • 2. Principal Officials. FINANCIAL SECTION I ndependent Auditor's Report Management's Discussion and Analysis Basic Financial Statements: Government-wide Financíal Statements: Statement of Net Position Statement of Activities. . . . Fund Financial Statements: Balance Sheet- Governmental Funds . . . . Statement of Revenues, Expenditures, and Changes ín Fund Balances - Governmental Funds. . . . . . . Reconciliation of the Statement of Revenues, Expenditures, and Changes in Fund Balances of Governmental Funds to the Statement of Activities Statement of Net Position - Proprietary Funds. Statement of Revenues, Expenses, and Changes in Fund Net Assets - Proprietary Funds. Statement of Cash Flows - Proprietary Funds. Notes to Financial Statements. . . . Required Supplementary lnformation : Budgetary Comparison Schedule - Function Budget Notes to Required Supplementary lnformation Schedule of Funding Progress Other Supplem entary I nformation : Combining Fund Statements and Schedules:
  • 3. Combining Balance Sheet - Nonmajor Governmental Funds . Combining Statement of Revenues, Expenditures, and Changes in Fund Balances - Nonmajor Governmental Funds Paqe 1 11 12 14 15 18 31 33 81 83 86 35 37 39
  • 4. 40 42 44 46 87 91 Combining Statement of Net Position - lnternal Service Funds. Combining Statement of Revenues, Expenses, and Changes in Fund Net Position - lnternal Service Funds Combining Statement of Cash Flows - lnternal Service Funds. Capital Assets Used in the Operation of Governmental Funds: Comparative Schedules by Source. Schedule by Function and Activity Schedule of Changes by Function and Activity. STATISTICAL SECTION Financial Trends: Net Position by Component Changes in Net Position. Fund Balances, Governmental Funds Changes in Fund Balances, Governmental Funds Revenue Capacity: Assessed and Taxable Value of Property. . . . Property Tax Rates - Direct and Overlapping Governments. . .
  • 5. Principal Property Taxpayers Property Tax Levies and Collections. Debt Capacity: Ratios of Outstanding Debt by Type. Ratios of General Bonded Debt Outstanding Direct and Overlapping Debt. Legal Debt Margin lnformation. . . Revenue Bond Coverage - Sewer Authority. Sales History and Total Sewer Charges. Water Meters by Rate Class. Largest Sewer Customers Demographics on Economic lnformation: Demographic and Economic Statistics Principal Employers . . . . Full-Time Equivalent City Government Employees by Function/Department Operating I nformation : Operating lndicators by Function. . . . Capital Asset Statistics by Function . . . . 95 97 99 101 102 104
  • 7. 139 141 143 DEPARTMENT OF ADMINISTRATIVE SERVICES CITY OF CEDAR FALLS, IOWA 220 CLAY STREET CEDAR FALLS, IOIVA 50613 PHONE: 319-273-8600 FAX: 319-268-5126 www.cedarfalls,comw October 1,2013 To Mayor Crews, Members of the City Council and citizens of the City of Cedar Falls: I am pleased to submit to you the comprehensíve Annual Financial Report (CAFR) of the city of cedar Falls, lowa,for the year ended June 30, 2013. This is the eleventh CAFR completed in compliance with the Governmental Accountíng standards Board Statement No. 34 (GASB 34). Responsibility for both the accuracy of the data andthe completeness and fairness of the presentation, including all disclosures, rests with the city. To the best of ourknowledge and belief, the enclosed data is accurate in all material respects and is reported in a manner designedto present fairly the financíal position and results of operations of the city. All disclosures necessary to enable thereader to gain an understanding of the city's financial activities have been included. GAAP require that management provide a narrative
  • 8. introduction, overview, and analysis to accompany the basicfinancial statements in the form of Management's Discussion and Analysis (MD&A). This letter of transmittal isdesigned to complement MD&A and should be read in conjunction with it. The city of cedar Falls, MD&A can befound immediately following the report of the independent auditors. The city is required to undergo an annual single audit in conformity with the provisions of the u.s. office ofManagement and Budget (oMB) circular A-133, "Audits of states, Local Governments, and Nonprofitorganizations'" lnformation to comply with oMB circular A-133, "Audits of states, Local Governments, andNonprofit organizations," and "Government Auditing standards" is included in another report under a separate cover. The city of cedar Falls provides many municipal services including fire and police protection, streets, garbage collection, parks, recreation, cultural arts, planning, zonihg, g"n"r"i a¿m¡n¡stråtion, and sewer and storm waterservices' For financial reportíng purposes, all funds, agencies, boards, commissions, trusts and authoritiesinvolved in the provision of these services are included íf the city is financially accountable. Financial accountability is determined by several different factors, including fiscal dàpendence, ability to impose will upon theentity's governlng body, provision of specific financial burdens or benefits and separate legal entity status. Aftercareful evaluation of these factors, the city has included in this financíal report the cedar Falls Electric utílity, Gasutility, water utility, and communícations utility, as well as all funds of the cíty. The utilities are each reported asdiscretely presented component units. 1
  • 9. "OUR CITZENS ARE OUR BUSINESS" GOVERNMENTAL STRUCTURE The City has operated under the mayor-council form of government since incorporation. Policy-making and legislative authority are vested in the governing council, which consists of seven members. The City Council is responsible, among other things, for passing ordinances, adopting the budget, setting goals, and approving mayor- appointed committees. The full-time mayor is responsible for carrying out the policies and ordinances of the City Council, for overseeing the day{o-day operations of the City, and for appointing department directors. The mayor and Council are elected on a nonpartisan basis. The Council consists of two council members elected at large and one council member elected from each of the five wards as established by ordinance, elected for terms of four years. The mayor is elected at large and to a two-year term. ECONOM¡C CONDITION AND OUTLOOK The City, incorporated in 1854, is located in the northeastern part of the state, has a land area of 28.9 square miles and a population of 39,260. The City is empowered to levy a property tax on both real and personal property located within its boundaries, and has the power by state statute to extend its corporate limits by annexation, which is seldom done, but will be done when deemed appropriate by the City Council. The economic condition and outlook of Cedar Falls continues to be strong. The Cedar Falls economy was insulated
  • 10. from many of the impacts created by the recent recession due to the growth and stability of the University of Northern lowa and a diverse service business sector. The Greater Cedar Valley Alliance was formed in the metro area to organize the human resources and generate needed development capital to attract new business and industry to the area and to encourage expansion of businesses already in the area. As a result, many new businesses have located offices and plants in the metro area. Target Corporation constructed a distribution center with an assessed value of approximately $¿S million in FY02 and in FY08 completed a second refrigeration center. The Cedar Falls lndustrial and Technology Park continues to show tremendous expansion. The increase in new businesses and expansion of established firms has had a positive effect on employment and the City's tax base. Historically, Cedar Falls' unemployment rate has closely followed the State trends, which are significantly lower than the nation's unemployment rate (See Attachment A). This is due to the strong service employment base supported by the state university located in Cedar Falls. Since the devaluation of property in l9B6-1988, Cedar Falls has had steady growth in property values. Assessed values increased in FY14 by $gZ million, and taxable values increased by $229 million (See Attachment B) due to the increase in assessed valuations and the residential rollback. The City of Cedar Falls maintains a comparatively low tax rate. Cedar Falls has the fifth lowest tax rate per capita of the twenty largest cities in the state of lowa (See Attachment C). Thís low rate can be attributed to the efforts of the City to streamline operations over the past twenty years. This has been accomplished by maintaining the
  • 11. approximate same number of employees, even when demand for service has increased. Cedar Falls had one of the lowest number of full{ime employees per 1,000 residents in FY12. (See Attachment D). Over the past ten years Cedar Falls' residential housíng sales prices have significantly increased. ln 2002, the average sales price reported was $153,312. ln2012, the average sales pricewas $206,773, which is a thirty-five (35) percent increase in the past ten years (See Attachment E). These statistics indicate that Cedar Falls' local economy is sound and there is a strong market for Cedar Falls homes. 2- Housing values have surged from the recession and devaluation of the mid-1980's to values that once again place the homeowners living in Cedar Falls in an advantageous market position. This market growth is a credit to businesses, the school system, utilities, and quality of City services in Cedar Falls. Each entity has worked together to strengthen the local economy, create jobs, and improve Cedar Falls' quality of life. MAJOR INITIATIVES Disinfection Project: ln August 2009, the Public Works department presented to council information on an Ultraviolet Light (UV) Alternatives Evaluation Workshop. This is a process to treat bacteria at the Water Reclamation Facility. The Environmental Protection Agency (EPA) has directed a new standard of treatment. The advantage of UV over other disinfectants is it can inactivate
  • 12. hard to control organisms, such as E.coli, without chemical additions to the final product and without producing a harmful disinfection by-product. Using UV is a better and safer way to disinfect and there are no residuals. ln FY11, the Public Works department solicited bids for the construction of the Water Reclamation Facility UV Disinfection and Biosolids Handling Facilities lmprovements Project (Disinfection Project). Construction of the project began in FY12 and a majority of the construction has occurred during FY13. Completion is expected in FY14. The total project cost will be approximately 921.8 million. This project will have a significant impact on the City's sewer fund. The City Council did approve a So/o increase on sewer rates each year for five years beginning in FY12. The council also decided not to finance the project in a traditional way of selling sewer bonds. lnstead the City has opted to self-finance the project. Cash reserves from the City's Capital lmprovements Fund and Hospital Fund havefinanced the project. Through June 30,2013, these funds have foaned the sewer fund $15.9 million. Self-financing has allowed these funds to earn interest at a rate greater than earnings on traditional investments and the sewer fund benefits by paying interest costs lower than bond rates. Bluff Street Lift Station: ln 1962, the Bluff Street Lift Station was constructed below the 1Oo-year flood elevation. During the Flood of 2008, the entire basement (pump room) filled with water and the control room had five feet of standing water in it. Due to its location, the station was not accessible for several days and out of service for about two weeks because of the significant damage to the mechanical equipment in the station as well as to the backup
  • 13. generator. Because of the dry well/wet well configuration of the station, conventional flood protection was not practical, therefore the City applied for a Community Development Grant (CDBG) Disaster Recovery Grant to construct the new station at a higher elevation and that is not subject to flooding and is completely accessible in a high water event. ln FY10, design on the new lift station started and the Public Works Department solicited bids for the New Bluff Street Lift Station project. Construction began in FY12 and continued in FY13. Completion will occur in FY14. The total project cost will be approximately $Z.g million. The CDBG grant will fund $3.g million of the cost. The remaining cost will be financed with sewer bonds and self- financing options. Sewer rates increases described above also were needed to help finance this project as well. 3 ACCOUNTING SYSTEMS AND BUDGETARY CONTROL ln developing and evaluating the City's accounting control system, consideration is given to the adequacy of internal accounting controls. Accounting control comprises the plan of organization and the procedures and records that are concerned with the safeguarding of assets and the reliability of financial records and consequen¡y are designed to provide reasonable assurance that: ¡ Transactions are executed in accordance with management's general or specific authorizations. ' Transactions are recorded as necessary(1)to permit preparation of financial statements in conformitywith
  • 14. generally accepted accounting principles or any other criteria, such as finance-related legal and contractual compliance requirements applicable to such statements, and (2) to maintain accountability for assets. . Access to assets is permitted only in accordance to management's authorization. ' The recorded accountability for assets is compared with the existing assets at reasonable intervals and appropriate action is taken with respect to any differences. The definition of accounting control comprehends reasonable, but not absolute, assurance that the objectives expressed in it will be accomplished by the system. The concept of reasonable assurance recognizes that the cost of internal controls should not exceed the benefits. The benefit consists of reductions in the risk of failing to achieve the objectives implicit in the definition of accounting control. All internal controf evaluations occur within the above framework. We believe that the City's internal accounting controls adequately safeguard assets and provide reasonable assurance of proper recording of financial transactions. ln accordance with the State of lowa, the City has formally established budgetary accounting control for its operating funds. Budgetary control is maintained at the function level (Public Safety, Public Works, Health and Social Services, Culture and Recreation, Community and Economic Development, General Government, Debt Service, Capital Projects, and Business-Type activities). The City has adhered to these budgetary laws.
  • 15. INDEPENDENT AUDIT Eide Bailly, LLP, a firm of independent public accountants has audíted the financial records, books of account and transactions of the City for the fiscal year ended June 30, 2013, and their opinion is included in the Financial Section of this report. The financial statements are the responsibility of the City. The responsibility of the independent public accountants is to express an opinion on the City's fínancial statements based on their audit. An audit is conducted in accordance with U.S. generally accepted auditing standards. Those standards require that the audit be planned and performed in a manner to obtain a reasonable assurance as to whether the financial statements are free of material misstatement. AWARDS The Government Finance Officers Association of the United States and Canada (GFOA) awarded a Certificate of Achievement for Excellence in Financial Reporting to the City of Cedar Falls for its comprehensive annual financial report (CAFR) for the year ended June 30, 2012. The Certificate of Achievement is a prestigious national award recognizing conformance with the highest standards for preparation of state and local government financial reports. 4 ln order to be awarded a Certificate of Achievement, a government unit must publish an easily readable and efficiently organized comprehensive annual financial report, whose contents conform to program standards. The
  • 16. CAFR must satisfy both accounting principles generally accepted in the United States of America and applicable legal requirements. A Certificate of Achievement is valid for a period of one year only. The City of Cedar Falls has received a Certificate of Achievement for the last twenty-three consecutive years (fiscal years ended 1990-2012). We believe our current report continues to conform to the Certificate of Achievement program requirements, and we are submitting it to GFOA. ACKNOWLEDGMENTS The preparation of this report could not be accomplished without the efficient and dedicated service of the entire staff of the Finance/Public Records Division, particularly Lisa Roeding, Deputy Finance Manager and Cathy Niebergall, Financial Technician. Each member of the division has my sincere appreciation for the contributions made in the preparation of this report. I would also like to thank the members of the City Council for their continued interest and support in planning and conducting the financial operations of the City in a responsible and prudent manner. Sincerely, enbeck, CPA, CPFO nce Manager/City Clerk 5 Unempl
  • 17. ATTACHMENT A Unemployment Rates Cedar Falls, Waterloo, lowa & U.S. Unemployment Rates Gedar Falls, Waterloo, lowa & U.S. 9.00 8.00 7.00 c) o) o c c)o L o fL 6.00 5.00 4.00 3.00 2.00 July Aug Sep Oct Nov Dec Jan Feb Mar Apr May June tCedarFalls +Waterloo +lowa +U.S.
  • 18. Month 12-13 Cedar Falls (ln %) Waterloo (ln %) lowa (ln %) U.S. (ln o/o) July Aug sep Oct Nov Dec Jan Feb Mar Apr May June 4.O 4.4 3.2 3.5 3.1 3.5 3.8 3.3
  • 20. 7.7 7.8 7.9 7.7 7.6 7.5 7.6 7.6 Average 3.5 6.2 5.0 7.8 Cedar Falls has consistently remained below Waterloo and the nation's unemployment rates. Historically Cedar Falls' unemployment rate has closely followed the State trends. Cedar Falls is insulated from many of the economic problems in the Metro area due to a strong service employment base supported by UNI. 6 ATTACHMENT B taxvaluel4 Taxable Valuations FY04-FY 14 City of Cedar Falls 3,000,000,000
  • 21. 2,500,000,000 2,000,000,000 1,500,000,000 1,000,000,000 500,000,000 0 FYO4 FYOs FYO6 FYOT FYOS FYO9 FYIO FY11 FY12 FY13 FY14 rTaxable Value trAssessed Value Year Taxable Value Assessed Value FYO4 FYOs FYO6 FYOT FYOS FYO9
  • 22. FYlO FY11 FY12 FY13 FY14 817,996,990 903,439,479 920,739,030 985,250,969 1 ,018,530,694 1,098,295,277 1 ,150,079,051 1 ,1 85,969,161 1,254,921,347 1,393,51 1,204 1,622,962,335 1,427,127,146 1,673,902,007 1,737 ,456,552 1,931 ,759,494 2,013,912,356 2,252,421,925 2,336,646,915 2,402,107,961 2,459,320,459 2,618,319,943 2,650,433,900 The last ten years have provided a steady growth trend ín assessed valuations. ln addition, FY08 was the first year that assessed values exceeded
  • 23. $2 billion and taxable values exceeded $1 billion. For FY14, assessed values increased by $32,t 14,057. However, taxable values increased by $229,35 1 ,191 due to the change in the residential rollback factor to 52.82% for Fy14 and the release of the TIF increment. 7 Citytaxr 900.00 800.00 700.00 600.00 500.00 400.00 300.00 200.00 Property Tax Per Capita (FY13) 20 Largest lowa Cities ATTACHMENT C
  • 24. Property Tax Per Gapita (FY13) 20 Largest Gities WDM IC CR BE CB DA WA CL UR AN DI4 FD MC MA SC CF AM MA DU BU C¡ty 2010 Abbre- Population viation FYI3 Tax Per Person West Des Moines lowa City Cedar Rapids Bettendorf Council Bluffs Davenport Waterloo Clinton Urbandale keny Des Moines Fort Dodge Mason City Marion Sioux City Cedar Falls Ames Marshalltown Dubuque
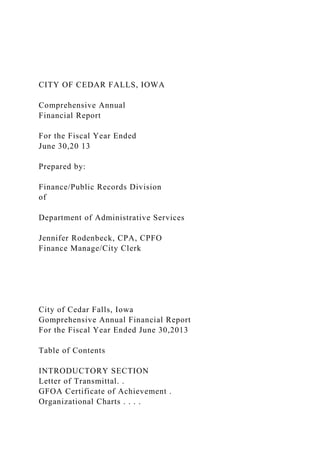
  • 27. For over two decades Cedar Falls' local government has operated at one of the lowest per capita property tax rates among the 20 largest cities in lowa. At a cost of $435.53 per person, the City is sub- stantially below the average rate of $549.89. This rate can be attributed to the City's concerted efforts to streamline operations over the past 20 years. lf the City of Cedar Falls operated at the state average property tax per capita, an additional 4.S million dollars would be devoted to operations. This would be an increase of 26% of taxes levied in FY13. lncluded in Cedar Falls' population are university students who live in campus housing and do not pay property taxes. Thís results in an even greater property tax burden on the citizens. I ATTACHMENT D Full-Time Employees Per 1,000 Residents Comparison of 20 Largest Cities 12 10 I
  • 28. 6 4 oe 9ù o "so as "$ Eo gù 9h .$Þ oQ (a & ow $*.$o$ o( È¡Þùe City FY12 Employees 2010 Population Employees Per 1,000 Cedar Rapids Dubuque lowa City Mason City Des Moines Ames Sioux City Burlington Davenport Waterloo Council Bluffs Fort Dodge Bettendorf Clinton
  • 29. Marshalltown W. Des Moines Gedar Falls Ankeny Marion Urbandale 1293.0 550.0 626.0 250.0 1750.0 503.0 684.0 205.0 773.0 516.0 441.O 177.0 230.0 184.0 174.0 337.0 215.0 212.0 160.0 180.0 126,326 57,637 67,862 28,079 203,433
  • 31. 4.56 Average 7.30 Among the top twenty largest cities in the State of lowa, the City of Cedar Falls continues to have one of the lowest number of employees per capita. The pressures of new construction growth, road development, and societal values have placed greater demands on existing staff. ln the near future, the City Council wíll need to prioritize services or focus on key services to address thé over extension of City staff. Cedar Falls city government continued to have one of the lowest number of employees per 1,000 capita comparing the top 20 largest cities. Cedar Falls has 1.82 employees per 1,000 capita less than the state average, which is equivalent to 71 fewer fu ll{ime employees. Employment reductions have been implemented over the last 10 years, which has streamlined Cedar Falls' employment. 9
  • 32. Resalel2 ATTACHMENT E The average sale price of residential properties in Cedar Falls has grown by 35% between 2OO2- 2012 from $153,31 2 to $206,773. However, in2O11 the average sale price declined slighfly Average Residential Sales Price (Annual) Cedar Falls, lowa 220,000 210,000 200,000 190,000 180,000 170,000 160,000 150,000 140,000 130,000 120,000
  • 33. 110,000 100,000 90,000 80,000 2002 2003 2004 2005 2006 2007 2008 2009 2010 2011 2012 Year Average Sales Price 2002 2003 2004 2005 2006 2007 2008 2009 2010 2011 2012 153,312 163,637 168,599 181,310 190,929 195,090 192,154 207,754 199,318
  • 34. 197,576 206,773 Average 186,g3g - 10 - Government Finance Officers Association Certificate of Achievement for Excellence in Financial Reporting Presented to City of Cedar FaIIs fowa For its Comprehensive Annual Financial Report for the Fiscal Year Ended June 30,2012 ØrtrÊtu- Executive Director/CEO -11 -
  • 35. City of Cedar Falls, lowa Organizational Chart Operations and Maintenance Water Reclamation Public Works lnvestigat¡ons School Reserve Officer & Crossing Guard Program Police Department Patrol Code Enforcement lnspections Suppression Prevent¡on Fire Department City Council
  • 36. Mayor Citizens of Cedar Falls Cultural Services Library* Parks Recreation Visitor & Tourism Services Community Ctr& Senior Services Human & Leisure Services Community Services Engineering & Storm Water lnspect¡on Services Planning and Zoning Developmental
  • 37. Services Legal Services Finance/Public Records & Parking lnformation Systems Cable W Administrative Services I A I) t city division org.doc January 29,2013 Financial Services *The Library is governed by the Library Board of Trustees' which are appointed by the Mayor & City Council. The Library is shown under the Human & Leisure Services Department since that department is the Board's liaison. City of Cedar Falls, lowa Boards and Commissions
  • 38. I J (¡) I Board of Electrical Examiners Comm Ctr & Senior Services Board Park & Recreation Commission Historic Preservation Commission Board of Appeals Civil Service Commission Library Board of Trustees Visitors & Tourism Board City Council Jon Crews Mayor
  • 39. Board of Adjustment Cedar Falls Health Trust Board Human Rights Commission Utilities Board of Trustees Art & Culture Board Board of Plumbing Examiners Housing Commission Planning & Zoning Commission Finance Division January 25,2011City boards & commissions.doc CITY OF CEDAR FALLS, ¡OWA PRINCIPAL OFFICIALS June 30,2013 Title Mayor
  • 40. Council Member- 1't Ward Council Member - 2nd Ward Council Member - 3'd Ward Council Member - 4th Ward Council Member- Sth Ward Council Member - At Large Council Member - At Large Administrative Services Director Developmental Services Director Human & Leisure Services Director Fire Chief Police Chief Public Works Director City Attorney Finance Manager/City Clerk lnformation Systems Manager Cable TV Manager City Engineer City Planner Community Services Manager lnspection Services Manager Acting Cultural Services Manager Recreation Division Manager Visitors & Tourism Manager Cedar Falls Public Library Director Operations and Maintenance Manager Water Reclamation Manager Cedar Falls Utilities General Manager Name Jon Crews Tom Hagarty Susan deBuhr John Runchey Mare Madsen Schmidt Frank Darrah
  • 41. Nick Taíber Dave Wieland Richard L. McAlister Ron Gaines Mark Ripplinger John Schilling Jeff Olson Bruce Sorensen Steve Moore Jennifer Rodenbeck Laurene Saathoff Denny Bowman Randy Lorenzen Marty Ryan Robert Seymour Craig Witry Emily Drennen Bruce Verink Kimberly Manning Sheryl McGovern Brian Heath Lyle Krueger Jim Krieg -14- dar Falls Visitor 8. Tourism Center .¿> EideBailly.
  • 42. CPAs & BUSINESS ADVISORS Independent Auditor's Report To the Honorable Mayor and Members of the City Council City of Cedar Falls, Iowa Report on the Financial Statements We have audited the accompanying financial statements of the governmental activities, the business-type activities, the aggregate discretely presented component units, each major fund, and the aggregate remainingfundinformationoftheCityofCedarFalls,Iowaasofandfor theyearended Jine30,2013, and the related notes to the financial statements, which collectively comprise the City's basic financial statements as listed in the table of contents. Management's Responsibility for the Financial Statements Management is responsible for the preparation and fair presentation of these financial statements in accordance with accounting principles generally accepted in the United States of America;this includes the design, implementation, and maintenance of internal control relevant to the preparation and fair presentation of financial statements that are free from material misstatement, whether due to fraud or e1Tor. Auditor's Responsibility Our responsibility is to express opinions on these financial statements based on our audit. We did not audit the financial statements of the Cedar Falls Utilities, which represent the entire assets, net position,
  • 43. and revenues of the aggregate discretely presented component units. Those financial statements were audited by other auditors whose report thereon has been furnished to us, and our opinion, insofar as it relates to the amounts included for the Cedar Falls Utilities, is based on the report of the other auditors. We conducted our audit in accordance with auditing standards generally accepted in the United States of America and the standards applicable to financial audits contained in Government Auditing Standards, issued by the Comptroller General of the United States. Those standards require that we plan and perform the audit to obtain reasonable assurance about whether the financial statements are free from mateiial misstatement. An audit involves performing procedures to obtain audit evidence about the amounts and disclosures in the financial statements. The procedures selected depend on the auditor's judgment, including the assessment of the risks of material misstatement of the financial statements, whether due to fiaud or error. In making those risk assessments, the auditor considers intemal control relevant to the entity's preparation and fair presentation of the financial statements in order to design audit procedures that ur" upprop.iate in the circumstances, but not for the purpose of expressing an opinion on the effectiveness of thè-entìty,s internal control. Accordingly, we express no such opinion. An audit also includes evaluating the appropriateness of accounting policies used and the reasonableness of significant accounting estimates made by management, as well as evaluating the overall presentation of the financial statements. l5
  • 44. www.eidebqilly.com 3999PennsylvonioAve.,Ste 100 | Dubuque,lAS2oo2-2273 I Tsó3.55ó t79o I Fs63.5577942 ) EoE We believe that the audit evidence we have obtained is sufficient and appropriate to provide a basis for our audit opinions. Opinions In our opinion, based on our audit and the report of other auditors, the financial statements referred to above present fairly, in all material respects, the respective financial position of the governmental activities, the business-type activities, the aggregate discretely presented component units, each major fund, and the aggregate remaining fund information of the City of Cedar Falls, Iowa, as of June 30,2013, and the respective changes in financial position and, where, applicable, cash flows thereof for the year then ended in accordance with accounting principles generally accepted in the United States of America. Other Matters Re quir e d Supp le me ntary Informat ion Accounting principles generally accepted in the United States of America require that the management's discussion and analysis and the other required supplementary information listed in the table of contents be presented to supplement the basic financial statements. Such information, although not a part of the basic financial statements, is required by the Governmental
  • 45. Accounting Standards Board, who considers it to be an essential part of financial reporting for placing the basic financial statements in an appropriate operational, economic, or historical context. We have applied certain limited procedures to the required supplementary information in accordance with auditing standards generally accepted in the United States of America, which consisted of inquires of management about the methods of preparing the information and comparing the information for consistency with management's responses to our inquires, the basic financial statements, and other knowledge we obtained during our audit of the basic financial statements. We do not express an opinion or provide any assurance on the information because the limited procedures do not provide us with sufficient evidence to express an opinion or provide any assurance. Other Inþrmation Our audit was conducted for the purpose of forming opinions on the financial statements that collectively compromise the City of Cedar Falls, Iowa's financial statements. The introductory section, combining nonmajor fund financial statements, capital asset schedules, and statistical section are presented for purposes of additional analysis and are not a required part of the financial statements. The combining nonmajor fund financial statements and capital asset schedules are the responsibility of management and were derived from and relate directly to the underlying accounting and other records used to prepare the basic financial statements. Such information has been subjected to the auditing procedures applied in the audit of the basic financial statements
  • 46. and certain additional procedures, including comparing and reconciling such information directly to the underlying accounting and other records used to prepare the basic financial statements or to the basic financial statements themselves, and other additional procedures in accordance with auditing standards generally accepted in the United States of America. In our opinion, the combining nonmajor fund financial statements and capital asset schedules are fairly stated, in all material respects, in relation to the basic financial statements as a whole. The introductory and statistical sections have not been subjected to the auditing procedures applied in the audit of the basic financial statements and, accordingly, we do not express an opinion or provide any assurance on them. l6 Other Reporting Required by Government Auditing Standards In accordance with Government Auditing Standards, we have also issued a report, under separate cover, dated September 27,2013, on our consideration of the City of Cedar Falls, Iowa's internal control over financial reporting and on our tests of its compliance with certain provisions of laws, regulations, contracts, grant agreements, and other matters. The purpose of that report is to describe the scope of our testing of intemal control over financial reporting and compliance and the results of that testing, and not to provide an opinion on the intemal control over financial reporting or on compliance.
  • 47. õ*,4 z¿/ Dubuque, Iowa September 27,2013 I7 MANAGEMENT'S DISCUSSION AND ANALYSIS Our discussion and analysis of the City of Cedar Falls' financial performance provides an overview of the City's financial activities for the fiscal year ended June 30, 2013. Please read it in conjunction with the transmittal letter found on pages 1 - 10 of this report. 2013 FINANCIAL H¡GHLIGHTS year 2013. Property taxes increased $893,816 for all activities. from fiscal year 2012. Public Safety expenses increased by $t,029,534 and Public Works expenses decreased by $1,061,71 0. amount, the net position of the governmental activities increased by $8,113,574 and the net position of the business-type activities increased by $3,804,534. USING THIS ANNUAL REPORT The annual report consists of a series of financial statements and other information as follows: o Management's Discussion and Analysis introduces the basic financial statements and provides an analytical overview of the City's fínancial activities.
  • 48. o Government-wide Financial Statements consist of a Statement of Net Position and a Statement of Activities. These provide ínformation about the activities of the City as a whole and present an overall view of the City's finances. The Fund Financial Statements tell how governmental activities were financed in the short term as well as what remains for future spending. Fund fínancial statements report the City's operations in more detail than the government-wíde statements by providing information about the City's most significant funds. Notes to Financial Statements provide additional information essential to a full understanding of the data provided in the basic financial statements. Required Supplementary lnformation further explains and supports the financial statements with a comparison of the City's budget for the year. Other Supplementary lnformation provides detailed information about the nonmajor Special Revenue and Capital Projects Funds and the lnternal Service Funds. REPORTING THE CITY'S FINANCIAL ACTIV¡TIES Government-wide Financial Statements One of the most important questions asked about the City's finances is, "ls the City of Cedar Falls in a better financial position at the end of the fiscal year, compared to last year?" The Statement of Net Position and the Statement of Activities report information about the City as a whole and about its activities in a way that helps answer this question.
  • 49. These statements include all assets and liabilities using the accrual basis of accounting, which is similar to the a a a a -18- accounting used by most private-sector companies. All of the current year's revenues and expenses are taken into account regardless of when cash is received or paid. The Statement of Net Position presents all of the City's assets and liabilities, with the difference between the two reported as "net position". Over time, increases or decreases in the City's net position are one indicator of whether its financial health is improving or deteriorating. A person will need to consider other non-financial factors, however, such as changes in the City's property tax base and the condition of the City's infrastructure, to assess the overall health of the City. The Statement of Activities presents information showing how the City's net position changed during the most recent fiscal year. All changes in net position are reported as soon as the change occurs, regardless of the timing of related cash flows. Thus, revenues and expenses are reported in this statement for some items that will not result in cash flows untilfuture fiscal periods.
  • 50. The Statement of Net Position and the Statement of Activities report two kinds of activities: . Governmental activities - Most of the City's basic services are reported here, including the general administration, streets, fire, police, parks, recreation, library, and housing and block grant assistance. Property taxes, local option sales taxes, road use taxes, and federal and state grants finance most of these activities. ¡ Business-type activities - The City of Cedar Falls charges a fee to customers to help it cover all or most of the cost of certain services it provides. The City's sewer, refuse, and storm water are reported in this section. The Government-wide financial statements can be found on pages 31 - 34 of this report. Fund Financial Statements The Fund financial statements provide detailed information about the most significant funds, not the City as a whole. Some funds are required to be established by State law or by bond requirements. The City has two kinds of funds: . Governmental Funds - Most of the City's basic services are reported in governmental funds, which focus on how money flows into and out of these funds and the balances left at year-end that are available for spending. These funds are reported using an accounting method called the "modified accrual basis" of accounting, which measures cash and all other financial assets that can readily be converted to cash. The governmental fund statements provide a detailed short-term view of the City's general government operations and the basic
  • 51. services it provides. Governmental fund information helps you determine whether there are more or fewer financial resources that can be spent in the near future to finance City programs. The required financial statements for governmental funds include a balance sheet and a statement of revenues, expenditures, and changes in fund balances. We describe the relationship between governmental activities (reported in the Statement of Net Position and the Statement of Activities) and governmental funds in a reconciliation at the bottom of the fund financial statements. The City maintains 21 individual governmentalfunds. lnformation is presented separately in the governmental fund balance sheet and in the governmental fund statement of revenues, expenditures, and changes in fund balance for the General Fund, Hospital Fund, TIF Fund, Street Repair Fund, Street Construction Fund, Debt Service Fund, FEMA Fund, and Bond Fund, all of which are considered to be major funds. Data from the . other twelve governmentalfunds are combined into a single, aggregated presentation. lndividual fund data for each of these non-major governmental funds is provided in the form of combining statements located in the supplementary information section of this report. Ïhe basic Governmental Fund Financial Statements can be found on pages 35 - 39 of this report. -19- a Proprietary Funds - When the City charges customers for the
  • 52. service it provides, these services are generally reported in proprietary funds. The City maintains two different types of proprietary funds. Enterprise funds are used to report the same functions presented as businessìype activities in the government-wide financial statements. The City uses enterprise funds to account for its sewer, refuse and storm water activities. lnternal Service Funds are used to accumulate and allocate costs internally. The City uses internal service funds for its information systems, vehicle maintenance, and various risk management activities. Because these services predominantly benefit governmental rather than business-type functions, they have been included within governmental activities in the government-wide financial statements. Proprietary funds provide the same information as the government-wide financial statements, only in more detail. The proprietary fund financial statements provide separate information for the Sewer Fund, Refuse Fund, and Storm Water Fund, all of which are considered major funds. lnternal Service Funds are combined into a single, aggregated presentation in the proprietary fund financial statements. lndividual fund data for internal service funds is provided in the form of combining statements located in the supplementary information section of this report. The basic Proprietary Fund Financial Statements can be found on pages 40 - 45 of this report. -20 -
  • 53. GOVERNMENT.WIDE FINANCIAL ANALYSIS As noted earlier, net position may serve over time as a useful indicator of financial position. The analysis that follows focuses on the change in the net position for governmental and business-type activities. Governmental activities Business-type activities Total 2013 2012 2013 2012 2013 2012 g 107,527,954 $ 163,936,827 106,608,386 $ 162,574,422 (4,381,386) $ 83,715,207 1,255,950 $ 74,092,070 103,146,568 247,652,034 $ 107,864,336 236,666,492 Current and other assets
  • 54. Capital assets Total assets Long-term debt Other liabilities Total liabilities 271,464,781 8,622,236 $ 28,488,990 269,182,808 11,345,500 $ 31,597,327 79,333,821 3,152,973 $ 2,114,941 75,348,020 3,763,871 $ 1,322,776 $
  • 55. 350,798,602 11,775,209 $ 30,603,931 344,530,828 15,109,371 32,920,103 $ sz,r 11,226 g 42,942,827 $ 5,267,914 $ 5,086,647 $ 42,379,140 $ 48,029,474 Net assets: Net investment in capital assets $ Restricted Unrestricted 155,314,591 $ 24,150,307 54,888,657 151,130,097 $ 24,405,828
  • 56. 50,704,056 79,677,940 $ 9,500 (5,621,533) 70,328,202 $ 9,500 (76,32s) 234,992.531 24,159,807 49,267,124 s 221,458,299 24,415,328 50,627,727 Total net position $ 234,353,555 $ 226,235,981 $ 74,065,907 $ 70,261,373 $ 308,419,462 $ 296,s01,3S4 Net position of governmental activities increased from FY12 by approximately $A.t million, or 3.59%. This increase was due primarily to the continued strength of the property tax base and the small amount of general obligation debt outstanding by the City. Net position of business-type activities increased from FY12by approximately $g.g million, or 5.41%. This increase was due to new assets constructed or being constructed. These assets include the new Public
  • 57. Works complex, the disinfection project and the Bluff Street liftstation. ln addition, this was the seventh year that storm water fees were collected. The largest portion of the City's net position is the net investment in capital assets (e.g., land, infrastructure, buildings, and equipment). The debt related to the investment in capital assets is liquidated with sources other than capital assets. Restricted net position represent resources that are subject to external restrictions, bond covenants, constitutional provisions or enabling legislation on how they can be used. Unrestricted net position, the part of net position that can be used to finance day{o-day operations are approximately $49 million at the end of the year. -21 - For the year ended June 30, 2013, net position changed as follows Governmental Activities Business e Activities Total 2013 2012 2013 2012 2013 2012 Revenues Program Revenues Charges for servrces Operating grants and contributions
  • 58. Capital grants and contributío ns General Revenues Property taxes Local Option Sales Tax Hotel/Motel Tax & Other Use of money and property lntergovernm ental Miscellaneous Gain on Sale of assets Utility contribution Total revenues Expenses Public safety Public works Health and social servrces
  • 59. Culture and recreation Community and economrc development General government Debt service Sewer Refuse Storm Water Total expenses $ 4,911,766 $ 5,099,756$ 8,461,470$ 8,469,215$ 13,373,236$ 13,568,971 2,098,639 1 ,695,1 1 7 2,098,639 1,695,117 6,479,932 1 1,529,905 577,411 140,450 7,O57,343 1 1 ,670,355 24,695,940 4,793,027 7 51,577
  • 61. 5,062,220 692,486 38,886 36,1 37 1 ,311,539 4,296,073 '1,014,890 6,606 1,625,0001,637,000 1,637,000 $ 52,416,865 $ 56,099,579 $ S,OZZ,767 g 8,645,802 $ 61,494,632 $ 64,745,381 $ 9,491,677 $ 11,909,568 $ $ 320,864 7,262,'t 10 8,357,058 4,890,409 228,173 8,462,143 $ 12,971,278
  • 63. 722,991 8,357,058 4,890,409 228,173 3,617,688 2,770,264 728,713 7,815,848 4,333,403 452,378 3,336,990 2,492,305 722,991 $ 42,459,85s $ 41,450,297 $ 7,1 16,665 $ 6,552,286 $ 49,576,524 $ 48,002,s83 $ 9,957,006 (1,843,432) 8 14,64s,282 $ 1,961,102 $ 1,843,432
  • 64. 2,093,516 $ 8, 91 9,1 54 11,918,108 $ 16,742,758 9,154) lncrease in net position before transfers ïransfers lncrease in net position Net position, beginning Net position, ending 8,113,574 $ 226,239,981 5,730J28 $ 220,509,853 3,804,534 $ 70,261,373 11,012,670 $ 59,248,703 11,91 8,108 $ 296,501,354
  • 65. 16,742,798 279,758,556 $ $ 74,065,907 $ 70,261,373$ 234,353,555 $ 226,239,981 22 $ 308,419,462 $ 296,501,354 Property taxes increased by approximately $893,000 from FY12 due to increased taxable valuations. FEMA grants for property buyouts related to the 2008 Flood received in FY12, caused capital grants and contributions to decreasefor FY1 3. INDIVIDUAL MAJOR FUND ANALYSIS Governmental Fund Highlights As of the end of the current fiscal year, the City's governmental funds reported combined ending fund balances of $64,696,852. $548,225 is nonspendable for inventory. $25,435,109 is restricted for TlF, debt service, road use tax funds, local option sales tax, employee retirement systems, bond proceeds and various grants. $16,551,115 is committed for the City's health trust fund and parking fund. $16,376,887 is assigned for recreational capital funds, police forfeiture funds, economic development and capital improvements. Thís leaves $5,785,516 for unassigned fund balances in the governmental funds.
  • 66. The Governmental fund balances increased by $4,880,073, or 8.160/0. This increase was due in part to the increase in the FEMA Fund. The General Fund is the chief operating fund of the City of Cedar Falls. At the end of the current fiscal year, unassigned fund balance of the General Fund was $6,978,807, while the total fund balance totaled $9,037,503. As a measure of the General Funds liquidity, it may be useful to compare both unreserved fund balances and total fund balances to total fund expenditures. Unassigned fund balance represents 33.51% of the total General Fund expenditures, while the total fund balance represents 43.39% of that same amount. The following fund balances in the other major funds, which comprise the Total Governmental Funds are listed below: FY13 FY12 lncrease Amount Amount (Decrease) Hospital Fund TIF Fund Street Repair Fund Street Construction Fund Debt Service Fund FEMA Fund Bond Fund Other Governmental Funds
  • 68. 5,121,413 261,976 (4,278,871) (48,808) 20,846,343 The FEMA Fund had the largest increase in fund balance due to the reimbursements received for projects related to the 2008 Flood. The Street Repair Fund had a decrease in fund balance due to many projects being able to be completed during FY13 The Hospital Fund had an increase in fund balance due to the fewer projects being funded by the Health Trust Board The Street Construction Fund had an increase in fund balance due to the increase in road use taxes received. Road use tax funds have increased due to the population increase in Cedar Falls which causes the formula to be revised. 23 The Bond Fund had a decrease in fund balance due to bond proceeds received in prior years being spent out on various projects. The Other Governmental Funds had an increase in fund balance due to the increase in the Capital lmprovements Fund. This increase was the result of the Fund being paid back
  • 69. for cashflowing various Capital Projects. -24 - The following schedule presents a summary of the governmental fund revenues for the fiscal year ended June 30, 2013 and June 30, 2012. Revenues FY13 Amount Percent of Total FY12 Amount lncrease (Decrease) from FY12 Percent of lncrease (Decrease) Property taxes and assessments Other city taxes
  • 70. Licenses and permits Use of money and property lntergovernm ental Charges for services Fines and forfeitures Miscellaneous Utility contribution in lieu of taxes $ 24,696,783 5,519,022 1 ,076 ,1 86 1,268,202 12,599,954 3,386,415 449j65 1 ,358,192 $ 23,766,846 5,755,920 1 ,162,401 1,275,402 18,920,930
  • 72. 2.61 16.89 % (4.30) (1.57) (0.13) (114.82) (2.20) 0.35 5.56 0.221,637,000 3.16 1,625,000 $ 51,990,919 100.00 % 57,496,119 _q_(5,50529q_ j_qo.oo %_ The most significant decrease in revenues was in intergovernmental. The decrease was due to the receipt of FEMA disaster assistance payments and IJOBS grant revenues for the new Public Works Complex in FY12. The most significant increase was in property taxes. The increase was due to increased property tax valuation due to the change in the residential rollback factor. Governmental Revenues FY13 Other City Taxes 10.620/o
  • 73. Licenses & Permits 2.07% Use of Money & Property 2.44o/o Property Taxes 47.50% Utility Contributions 3j6% Fines & Forfeitures 0.86% lntergovernmental 24.23% Charges for Services 6.51% Miscellaneous 2.61o/o -25 - The following schedule presents a summary of governmental expenditures for the fiscal years ended June 30, 2013 and June 30,2012. Public Safety Public Works
  • 74. Health & Social Services Culture & Recreation Cummunity and Economic Development General Government Debt Service Capital Projects $ 8,999,942 10,089,252 172,284 6,449,626 2,646,490 4,684,063 2,956,009 9,544,629 Expenditures FY13 Amount Percent
  • 77. (3.34) (34.e5) (67.05) $ $ 45,542,295 100.00 % $ 48,295,538 $ (2,753,243) 100.00 % The most significant decrease in expenditures occurred in the capital projects function. This was due to several projects occurring during FY12, including disaster recovery expenditures. The most significant increase in expenditures occurred in Public Safety. This was due to increased pension costs as set by the State of lowa. Governrnental Expend itures FY13 Capital Projects 20.960/o Debt Service 6.49o/o General Govemment 10.29o/o Community and Economic Development 5.81o/o
  • 78. Public Safety 19.760/o Public Works 22.15o/o Culture and Recreation 14.160/o Health & Social Services 0.38% -26 - Proprietary Funds City of Cedar Falls proprietary funds provide the same type of information found in the government-wide financial statements, but in more detail. Net position of the Sewer, Refuse and Storm Water funds at the end of the year amounted to $74,065,907. There are net position in the Governmental Activities lnternal Service fund of $15,126,691 . These funds were established for the City operations that are financed and operated in a manner similar to private business enterprises. The cost of providing the services to the general public is recovered, in whole or in part, through user charges.
  • 79. The City's enterprise operations are comprised of three separate and distinct activities: Sewer, Refuse and Storm Water. Results of operations for these funds for the years ended June 30, 2013 and June 30, 2012 are as follows: Sewer Refuse Storm Water 2013 2012 2013 2012 2013 2012 Operating Revenues Operating Expenses Non-Operating Rev (Exp) CapitalContributions O perating Transfers, net Change in Net Position 4,574,181 $ 3,208,163 (387,334) 178,978 1,633,090 2,790,752 $ 2,996,396 2,770,264 9,712 $ 3,328,306 $
  • 81. 6,68 5 62,970 (252,351) (78,701) 5,000,000 4,000,000 3,000,000 2,000,000 1,000,000 0 Proprietary Fund Operating Revenues & Expenses FYI3 I Sewer Refuse Storm Water I Operating Revenue ü Operating Expenses BUDGETARY HIGHLIGHTS Over the course of the year, the City Council revised the budget two times. These amendments were done in January and May 2013. The amendments were needed due to the City's participation in the Jumpstart, Buyout, Demolition, and Public Assistance Federal & State Programs. At the end of
  • 82. the year, the City did not exceed the amended budgeted amounts in any of its functions. 27 CAP¡TAL ASSET AND DEBT ADMINISTRATION CapitalAssets At the end of June 30, 2013, the City had approximately $Z¿g million invested in capital assets including police and fire equipment, public buildings, park facilities, roads, bike trails, bridges, water treatment facilities, sanitary sewer lines, and storm water improvements. (See Table following.) This represents a net increase of approximately 911 million or 4.64% over last year. City of Cedar Falts Capital Assets (net of depreciation) Gove rnm enta I activities Business activities Total 2013 2012 2013 2012 2013 2012 Land Buildings lmprovements other than buildings Machinery and
  • 83. equipment lnfrastructure Construction in progress $ 28,867,975 18,419,051 $ 30,480,556 36,407,208 $ 30,316,450 37,498,908 $ 28,703,869 $ 1,612,581 $ 1,612,581 19,077 ,238 17,988,157 18,421,670 8,195,797 8,666,142 8,195,797 8,666,142 6,674,726 90,353,811 6,954,815 86,908,330 5,324,374 30,831,125 5,457,929 30,874,644
  • 84. 11,999,100 121,184,936 12,412,744 117,782,974 11,425,467 12,264,028 27,958,970 17,725,246 39,384,437 29,989,274 Total $ 163,936,S27 $ 162,574,422 $ 83,715,207 ç 74,092,070 $ 247,652,034 $ 236,666,492 Major capital asset events during the current fiscal year included the following: . Hwy 58 Pedestrian Bridge. . Bluff Street Liftstation. o Northern lndustrial Park. . Ridgeway Avenue. o TreatmentFacilityDisinfection. More detailed information about the city's capital assets is presented statements. tn Note 3 to the financial Capital Assets Net of Depreciation Land 12.310/o Construction ln Progress
  • 85. 15.90% Buildings 14.70Yo lmprovements 3.31Yo Machinery & Equipment 4.85%lnfrastructure 48.93Yo -28 - Debt Atyear- end,theCityhad$11,610,000ínoutstandingbondscomparedto$14,9 10,000¡astyear. Thatisadecreaseof $3,300,000 or 22.13%. Gity of Cedar Falls Outstanding Debt General Obligation Debt Govem rnental activities Total 2013 2012 2013 2012 Business-type activities 2013 2012 General obligation
  • 86. bonds $ Tax increment financing Capital loan notes 1,125,000 10,210,000 $ $ 2,335,000 $ 2,755,000 $ 2,æ5,000 $ 2,755,000 575,000 8,075,000 625,000 920,000 575,000 8,700,000 1,125,000 11,030,000 Total $ 8,650,000 $ 11,335,000 $ 2,960,000 $ 3,575,000 $ 11,610,000 $ 14,910,000 The City of Cedar Falls was upgraded to a Aa1 rating from Moody's lnvestor Services for all general obligation issuances. This was a result of Moody's recalibrating their U.S. municipal rating scale. State statutes limit the amount of general obligation debt a government entity may issue to 5% of its total assessed valuation. As of June 30, 2013, the City's legal debt margin was $1 19,762,511 .
  • 87. More detailed information about the City's long-term debt is presented in Note 3 to the financial statements. Gity of Cedar Falls Outstanding Debt FY13 CapitalLoan Notes 75o/o GO Bonds 20To TIF Bonds 5% -29- ECONOMIC FACTORS AND NEXT YEAR'S BUDGETS AND RATES During the state legislative session in 2004, the legislature permanently eliminated certain state funding to local governments starting with FY2005 and will continue in all future years. This along with the continuation of the state rollback on residential properties greatly affects the City's general operating fund. Even with the State reductions, the City Council did establish a balanced budget in the General Fund for Fyj4. The tax levy rate per $1,000 of taxable valuation for FY14 is provided below: $ 8.10
  • 88. 2.76 .56 .21 .27 .10 .00 .02 $ 12.02 REQUESTS FOR INFORMATION This financial report is designed to provide our citizens, taxpayers, customers and creditors with a general overview of the City's finances and to show the City's accountability for the money it receives. The City's discretely presented component units, Cedar Falls Utilities, have separately issued financial statements. lf you have questions about this report or need additional information, contact the Department of Administrative Services, 220 Clay Street, Cedar Falls, lowa 50613. General levy Trust and Agency levy Debt Service levy Transit levy
  • 89. Library levy Liability lnsurance levy Emergency Management levy Municipal Band levy Total levy 30- dar Falls The Falls Aquatic Center dar Falls Veteran's Memorial Park CiÇ of Gedar Falls, lowa Statement of Net Position June 30, 2013 Primarv Government ASSETS Cash Certificates of Deposit
  • 90. Receivables, net of allowance for uncollectible amounts: Property taxes Other city taxes Accrued interest Special assessments Notes from associated company Customers Human & Leisure services contributions Other Due from component unit lnternal balances Due from other governments lnventories Prepaids and other assets Restricted assets: Cash Certificates of deposit US government and agency securities Capital assets: Land Land improvements Buildings Machinery and equipment lnfrastructure Construction in progress Accum ulated depreciation Total assets LIABILITIES Accounts payable Accrued liabilities
  • 91. Due to primary government Note payable to associated company Unearned revenue Long-term liabilities: Portion due or payable within one year: Bonds payable Compensated absences Portion due or payable after one year: Bonds payable Compensated absences Net OPEB liability Total liabilities NET POSITION Net investment in capital assets Restricted: Streets Debt service Em ployee retirement system TIF Post closure costs Unrestricted Total net position $ 61 ,017,101 S 9,732,421 21,855J75 979,860 64,720 44,163
  • 92. 11,977 3,925,645 959,113 850,000 15,340,000 1,615,165 877.012 28,867,975 13,155,356 27,818,640 I 7,1 53,865 163,497,944 11,425,467 (97,982,420 $ 271,464,781 1,145,520 (15,340,000) 68,69ô 23,933,783 7,964,022 45,857,843 27,958,970 (23,611,9921 $ 79,333,821
  • 93. Governmental Activities Business-type Activities Total $ 70,749,522 21,855,175 979,860 76,697 44,163 3,925,645 2,104,633 850,000 1 ,61 5,1 65 945,708 30,480,556 13,155,356 51,752,423 25,117,887 209,355,787 39,384,437 (121,594,412 $ 350,798,602 1612,581
  • 94. $ 2,624,404 't,028,432 21,789,027 2,775,O00 841,889 5,847,236 1,862,099 343, I 39 s 37,111,226 18,531,342 318,846 5,284,684 15,435 't,546,705 76,962 635,000 138,633 2,517,973 352,641 $ 4,171,109 1 ,'t 05,394 21,789,027 3,410,000 980,522
  • 95. 8,365,209 2,214,740 18,531,342 318,846 5,284,684 15,435 9,500 49.267.124 T--m6;413262- $ 343 139 $ 5.267 ,914 $ 42,379,140 $ 1s5,314,591 g 79,677,940 $ 234,ss2,531 54,888,657 $ 234,353,555 See notes to financial statements -31 - Component Units Electric Utility Gas Ut¡litv
  • 97. 144,501 136,449 36,307 39,835 2,029,561 652,815 18,388,514 1,146,341 (9,824,603) 2 950 811 548,845- 72,035 1 10,378 24,687 63,466 838,873 376,977 28,285,949 572,606 (8,981,686) $ 26,107,994 1 ,005,1 81 502,746 't,183,414
  • 98. 216,366 259,544 340,000 1,321,858 18,042,813 17,205,059 1,4'10,409 (7,431,0s8) $ 38,11 1,68s s 7,782,233 $ 3,704,010 $ 2,341 ,894 5,006 13 3,000,000 1,562,201 419,347 1,709,01 1 4 448 4456883641038 4947263,206 $$ 5,973,191 5,210,181 1,430,000 2,590,000 48,361,300
  • 100. I 20852, 3 912 673 32- City of Cedar Falls, lowa Statement of Activities For the Year Ended June 30, 2013 Proqram Revenues Functions/Programs Primary government: Governmental activities: Public safety Public works Health and social services Culture and recreation Community and economic development General government lnterest on long{erm debt and related fees Total governmental activities
  • 101. Business-Çpe activities: Sewer Refuse Storm Water Total business-type activities Total primary government Component units Electric Utility Gas Utility Water Utility Communications Utility Total component units Expenses Charges for Services Operating Grants and Contributions Capital
  • 103. 2,770,264 728,713 $ 4,911,766 $ 2,098,639 4,574,181 2,996,396 890.893 ö$ $ 6,479,932 $ 178,978 398,433 $ 7,116,665 s 8.461.470 $ 577,411 s 49. 76.524 $ 13,373,235 $ 2,098,639 $7. ,343 $ 44,734,893 9,421,934 3,003,090 13,669,240 $ 70,829,157 52,331,653 10,318,526
  • 104. 3,91 8,126 14,574,001 $ $ $ 4,528,905 570,795 877,513 482,690 $ 81.142.306 $ $ 6,459,903 General revenues: Property taxes and assessments Local option sales tax Hotel/motel taxes Other c¡ty taxes Use of money and property lntergovernmental, not restricted to specific programs Miscellaneous Utility contribution in lieu of taxes Transfers Total general revenues and kansfers Change in net position
  • 105. Net position - beginning Net position - ending See notes to financial statements -33- Net (Exoense) Revenue and Chanqes in net oosition Units Governmental Activities Activities Electric Total Utit¡ty Gas Water Communications Ut¡lityU $ (8,645,342) $ (5,225,044) (320,864) (4,514,483) (6,777,774) (3,257,8421 e28.173 $ (8,645,342)
  • 106. (5,225,044) (320,864) (4,514,483) (6,777,774) (3,257,842) (228,173 $ (28,969,s22)$ (28,96e,522) $ s $$ $ $ s $ s $ 'lj35,471 226,132 560,613 $ $ $ $ $ s1 ,216 s s $ $ (28,969,522) s___1p22216 ß (27. 047.306) $ $ s $ $ $ $ $ 12,125,665 $ $ $ 1,467,387 1,792,549
  • 107. $ $ $ s 12 125.665 S I $ 1,792,549 1,387,451 $ 1,387,451,387 $ 24,695,940 4,793,027 64't,404 110,173 1,268,202 4,405,345 1,375,437 1,637,000 (1,843,432) $ 37,08s,096 $ 8,1 1 3,574 226 $ 38,886 24,695,940 4,793,027 641,404
  • 108. 110,173 1,307,088 4,405,345 1,375,437 1,637,000 $ $ $ $$ 14 060100 790 243 6 006 $ 38,965,414 S '100,790 s 14.060 g 243 $ 1,792,792 23,276,066 $ 25,068,858 $ 6,006 $ 11,918,108 296,501,354 $ 308,419,462 $ 12,226,455 124,053,956 $ 1,481,447 21.7 83,423 $ 136,280,41 1s 234.353.555 $ ,907
  • 109. -34 - $ Gity of Cedar Falls, lowa Balance Sheet Governmental Funds June 30, 2013 Special Revenue General Fund Hospital Fund TIF Fund Street Repair Fund ASSETS Cash Receivables, net of allowance for uncollectible amounts: Property taxes
  • 110. Other city taxes Accrued interest Special assessments Human & Leisure services contributions Other Due from component unit Due from other funds Advance to other funds Due from other governments lnventories Total assets LIABILITIES AND FUND BALANCES LIABILITIES Accounts payable Accrued liabilities Unavailable revenue Due to other funds Total liabilities FUND BALANCES Nonspendable Restricted Committed Assigned Unassigned Total fund balances Total liabilities and fund balances $ 8,387,522 g 4,449,430 $
  • 111. 17,500,966 89,494 20,376 3,925,645 203,097 850,000 1 1,255,000 36,436 241,612 2,045,522 $ 12,357,526 800,872 14,811 192,967543 459 $et 148 $ 16.247 ,889 $ 2,045,522 $ 13,366,176 $ 386,168 $ 368,260 21,463,217 529,03; 2,030,087 $ 707,862 48,643 $
  • 112. $ 22,217,645 $ 529,038 $ 2,030,087 $ 7s6,505 12,609,671 $ 9,037,503 $ 15.718 ,851 $ 15,435 $ 12,609,671 $sl 148 $ r6,247,889 $ 2.045.522 Amounts reported for governmental activities in the statement of net assets are different because: Capital assets used in governmental activities are not financial resources and, therefore, are not reported in the funds. Other long-term assets are not available to pay for current- period expenditures and, therefore, are deferred in the funds. lnternal service funds are used by management to charge the costs of fleet management, management information systems and risk management activities to individual funds. The assets and liabilities of the internal service funds are included in governmental activities in the statement of net position. Accrued interest payable is not due and payable in the current period and, therefore, is not reported in the funds. Accrued compensated absences and other postemployment benefits, are not due and payable in the current period and, therefore, are not reported in the funds. Bonds payable are not due and payable in the current period and, therefore, are not reported in the funds. Net position of governmental activities 241,612 1,817,084
  • 113. 6,978,807 15,718,851 15,435 $l 176 See notes to financial statements -35- Special Revenue Street Construction Fund Capital Projects Debt Service Fund FEMA Fund Bond Fund Other Governmental Funds
  • 114. Total Governmental Funds $ 5,524,030 $ 315,949 $ 960,463 321,513 283,206 $ $ 16,714,455 $ 1,348,224 89,494 13,380 44,163 8,987 47,748,912 310,544 843,'t45 1,413,731 4,085,000 103,527 23,407 21,855,175 979,860 48,567 44,163
  • 115. 3,925,645 948,510 850,000 1,413,731 1s,340,000 1,615,165 548,225 $ 6,128 ,749 $ 1 ,276,412 $ 310,544 $ 843,145 $ $ 95,317,953 $ $81,671 34,302 957,566 49,042 392,035 93,162 1,000,904 167,28s $ 10,016 1,488,647 20,792 2,135,390 412,578 26,659,402 1,413,731 $ 398,637 $ 393,767 $ $ r 15,973 S 957,566 $ 839,714 $ 1,487,833 $t 740 $ 30,621,101
  • 116. 283,206 5,729,570 318,846 23,407 6,761,587 832,264 14,559,803 (1e,433) 548,225 25,435,109 16,551 ,1 15 16,376,887 5,785,516(529,170) (644,688) $ 6,012J76 $ 318,846 529 170 $ $ 6,128 ,749 $ I ,276,412 $ 310,544 $ 15722 628 $ 64,696,852 $ 843,145 $ 161,247,257 4,870,375 15J26,691 (18,017) (2,s47,367) (8,622,236) 36 $ 234,353,555
  • 117. City of Gedar Falls, lowa statement of Revenues, Expenditures, and changes in Fund Balances Governmental Funds For the Year Ended June 30, 2013 Special Revenue General Fund Hospital Fund TIF Fund Street Repair Fund Revenues: Property taxes and assessments Other city taxes Licenses and permits Use of money and property lntergovernmental Charges for services Fines and forfeitures Miscellaneous Utility contribution in lieu of taxes
  • 118. Total revenues Expenditures: Current: Public safety Public works Health and social services Culture and recreation Community and economic development General government Debt service Capital projects Total expenditures Excess (deficiency) of revenues over (under) expenditures Other financing sources (uses): Transfers: Transfers in Transfers out Total other financing sources (uses) Net change ín fund balances Fund balances, beginning lncrease (decrease) in reserve for inventories Fund balances, ending $ 22,802,718 $ 601,464 $ 7.6 79,979 $ 5.455
  • 119. $ 15,121 ,936 414,348 I ,076,186 79,054 829,802 3,337,424 283,084 23,884 1,637,000 $ 7,679,979 $$ 600,922 542 4,793,027 46,875 615,890 ,792 $$$ 7,665,379 $ 1,464,790 14,750 6,094,248 903,259
  • 120. 4,684,063 5,702,990 157,534 $ 20, 826,489 $ r sz 534 S $ 1,976,229 $ 443,930 $ 2.679,979 $ $ 633,942 $ (2,583,045) $ 766,990 $ (8,450,736) $ s,702,990 7,1 98) (814,380) 949 103 $1 $ (7,683,746) $ 814,380) $ 27,126 $ 8,949,454 60,923 443,930 $ 15,274,921 (3,767) $ 19,202 (1,061,578)
  • 121. 13,671,249 $ 9,037,503 See notes to financial statements -37 - $ r 5,718,351 s 15,435 $ 12. 609,671 Special Revenue Street Construction Fund Capital Proiects Debt Service Fund FEMA Fund Bond Fund Other Governmental Funds Total
  • 122. Governmental Funds $ $ $ $845,493 $ 3,736 1,049,375 $ 307,911 538,132 1,643,577 48,991 166,081 637,588 24,696,783 5,519,022 1,076,186 1,268,202 12,599,954 3,386,415 449,165 1,358,192 1,637,000 3,804,757 3,346
  • 123. 4,464,326 3,219 1,857,492 76,942 $$ $ $ 103 $'849,22994,464 ,326 $ 1,937,65s $ 4,391 ,655 $ st,990,919 $ $ 1,334,563 $ 233,078 8,999,942 10,089,252 172,284 6,449,626 2,646,490 4,684,063 2,956,009 9,544,629 2,688,394 2,956,009 355,378 1,743,231 1,764,779 3,382,280 4,397,570
  • 124. $ 2,688,394 $ 2,956,009 $ 1,764,779 $ 1,119,709 $ (2,106.780) $ 2,699,547 $ 3,382,280 $ 8, 063,820 $ 45,542,295 $ (1,444,627 $ (3,672,165) $ 6.448,624 $ 5,495 $ 2,163,750 (280,8e0) $ 3,574,665 $ (2,524,511) 1,060,704 $ (211,957) 5,092,148 $ (111,350) 13,297,694 (14,976,86s) $ (275,3e5) $ 2,1 63,750 $ 1 ,050,1s4 $ 848,747 $ 4,980,798 $ (1,679,175) $ 844,314 $ 5,121,413 47,049 $ 3,749,701 $ (4,278,871) (5es,880) $ (48,808) 20,846,343
  • 125. 2,652 59,816,779 110,624 56,970 261,876 1,308,633 g 4,769,449 318,846 $ (529,170) $$ 6,012/76 $ -38 688) $ 22,t57,628 $ ,852 Net change in fund balances - total governmental funds Amounts reported for governmental activities in the statement of activities are different because: Government funds report capital outlays as expenditures while governmental activities report depreciation expense to allocate those expenditures overthe life of the assets. capital ouflay expenditures exceeded depreciation expense in the current year, as follows: Net acquisition of capital assets Depreciation expense Because some revenues will not be collected for several months
  • 126. after the City's year end, they are not considered available revenues and are deferred in the governmentalfunds, as follows: Other Proceeds from issuing long-term liabilities provide current financial resources to governmental funds, but issuing debt increases long-term liabilities in the Statement of net posítion. Repayment of long- term liabilities is an expenditure in the governmental funds, but the repayment reduces long-term liabilities in the Statement of net position. current year repayments exceeded issues, as follows: Discount on general obligation bonds Repaid Accrued interest some expenses reported in the statement of Activities do not require the use of current financial resources and, therefore, are not reported as expenditures in governmental funds, as follows: Compensated absences Other postemployment benefìts Change in inventory lnternal service funds are used by management to charge the costs of fleet management, management information systems and risk
  • 127. management activities to individual funds. The net revenue of certaín activities of internal service funds is reported with governmental activities Change in net position of governmental activities City of Gedar Falls, lowa Reconciliation of the Statement of Revenues, Expenditures, and Changes in Fund Balances - Governmental Funds to the Statement of Activities For the Year Ended June 30, 2013 8,392,833 16. 795,933) 1 926 38,262 2,685,000 4 572 1,194 (67,810) 110,623 $ +,t69,449 1,596,900 (183,926) 2,727,834
  • 128. 44,007 (840,6e0) See notes to financial statements -39- $ 8,113.574 City of Gedar Falls, lowa Statement of Net Position Proprietary Funds June 30, 2013 ASSETS Current assets: Cash Receivables, net of allowance for uncollectible amounts: Accrued interest Other lnventories Total current assets Noncurrent assets: Capital assets:
  • 129. Land Buildings Machinery and equipment lnfrastructure Construction in progress Accu mulated depreciation Total noncurrent assets Totalassets LIABILITIES Current liabilities: Accounts payable Accrued liabilities Bonds payable - due within one year Compensated absences - due within one year Total current liabilities Noncurrent liabilities: Bonds payable- after one year Advance from other funds Compensated absences - after one year Total noncurrent liabilities Total liabilities NET POSITION Net investment in capital assets Restricted for post closure costs Unrestricted Total net position
  • 130. B usiness-type Activities - Enterprise Fund Sewer Fund Refuse Fund $ 4,943,465 $ 2,740,373 6,921 741,598 40 937 5 73 921$g 2,916 366,850 27 759 137 898 $ zzs,aza 11,595,276 5,506,598 29,629,206 27,921,795 (16,716,752 $ 58,715,981 $ 64,448,902 $ 1,487,753 53,530 635,000 76,255
  • 131. $ 2o4,B4s 12,338,507 2,457,434 14,666 (1,969 ,065) $ 13.046 ,387 184 85 $ 46,596 19,291 1 55,451 2 252 538 $ 't21,338 $ 2,517,973 15,340,000 119,479 $ 217,041 $ 17,977 ,452 $ 217,041 $ 20,229,990 $ 338,329 $ 54,678,714 $ 13,046,397 9,500 1 459 802 790 019 fi 44,218,912 See notes to financial statements
  • 132. -40- $ 15,845,906 Business-type Activities - Governmental Activities - lnternal Service Funds Enterorise Fund Storm Water Fund Total fi 2,048,583 $ 9]32,qZt $ 13,268,189 2,140 37,072 I'1,977 1,145,520 68,696 16,153 10,603 328,787 $ 2,087,79s $ to, 958,614 $ 13,623,732 $ 627,858 $ 90,302
  • 133. 7,649,361 16,229,637 22,519 (4,926,175 $ 11,952,839 $ 14,040,634 $ 12,356 4,141 $ $ 1,612,581 23,933,793 7,964,022 45,857,843 27,959,970 (23,611,992 $ 83,715,207 $ 94,673,821 (5,050,093) $ 2,689,570 $ 16,313,302 1,546,705 76,962 635,000 138,633
  • 134. 489,014 597,837 $ $ 55,154 55 154 $ t,186,611 $ 6,927 $ $ 23,424 397 300 $ 2,517,973 15,340,000 352,641 8 18,210,614 $ 20,607,914 16 12'l $ 16,121 $ s9,s4s $ 11,952,839 2,048,250 $ 14,001,089 $ 2,689,570
  • 135. 1 437 121 $ 15,126,691 -41 - City of Cedar Falls, lowa statement of Revenues, Expenses, and changes in Fund Net position Proprietary Funds Forthe Year Ended June 30,2013 Business-type Activities - Enterprise Funds Sewer Fund Refuse Fund Operating revenues: Charges for services Other Total operating revenues Operating expenses: Personal services Contractual services Supplies and equipment Depreciation Total operating expenses Operating income Nonoperating revenues (expenses):
  • 136. lnterest revenue lnterest expense Gain (loss) on disposal of equipment Nonoperating revenues (expenses), net lncome before contributions and transfers Capital contributions Transfers in Transfers out Contributions and transfers, net Change in net position Net position, beginning Net position, ending $ 4,572,082 2,099 $ 2,4s0,482 545,914 181 $ 2,996,3964 574 $ 1,192,506 782,117 279,469 954,072 $ 1,128,444 1,140,222
  • 137. 84,352 417,246 ,264$ 3,208,163 $ 2]70 1 366 018 $ 226,132 $ 22,191 (409,525) $ 9,712 $ (387 ,334) $ 9,712 $ 978,684 $ 235,844 $ 178,979 2,431,073 (797,983) $ 343,792 (133,450) $ 1.812,068 $ 210,342 $ 2,790,752 $ 446,196 41,429,160 15,399,720 See notes to financial statements -42- _$ 44218,912 _qj_5,845,906
  • 138. Storm Water Fund Business-type Activities - Enterprise Funds Governmental Activities- lnternal Service FundsTotal $ 823,814 67,079 7,846,379 615,092 $ 6,311,468 204,351 $ $ 890,893 $ 8,461 ,470 $ 6,51s,819 $ 223,050 97,573 17,607 390,483 2,544,000 2,019,912 381,427
  • 139. 1,761,9O1 $ 1,413,994 4,235,561 1,147 ,335 41g,Og2 $ $ 728,713 $ 6,70r,140 $ 7,214,872 $ 162j80 $ 1 754 330 $ (699,053) $ 6,993 $ 3g,gg6 (409,525) $ s2,7s7 (30,137) $ 6,983 $ (370,639) 22 620 $ 169,163 $ 1.383 $ (676,433),691 $ 398,433 $ 577,411 $ 2,774,965 (931,433) (164,257) $ 398,433 $ 2,420,943 164 257 $ $74 567,596$3,904,534$(940,690) 13,433,493 70,261,373 15,967,391
  • 140. $ 15,126,691$ 14,001,099 065 -43- City of Cedar Falls, lowa Statement of Cash Flows Proprietary Funds For the Year Ended June 30,2019 CASH FLOWS FROM OPERATING ACTIVITIES Receipts from customers and users Receipts from interfund services Payments to suppliers Payments to employees Net cash provided by operating activities CASH FLOWS FROM NONCAPITAL FINANCING ACTIVITIES Transfers from other funds Transfers to other funds Net cash provided by (used for) noncapital financing activities CASH FLOWS FROM CAPITAL AND RELATED FINANCING ACTIVITIES Net acquisition of property and equipment Capital contributions Advance from other funds Principal paid on debt maturities Payments on advance from other funds lnterest paid
  • 141. Net cash (used for) capital and related financíng activities CASH FLOWS FROM INVESTING ACTIVITIES Interest received on investments Net increase (decrease) in cash CASH BALANCES, Beginning CASH BALANCES, Ending Reconciliation of operating income to net cash provided by operating activities: Operating income (loss) Adjustments to reconcile operating income to net cash provided by operating activities: Depreciation Change in assets and liabilities: (lncrease) decrease in: Customer and other receivables lnventories lncrease (decrease) in accounts payable, accrued and other liabilities Net cash provided by operating activities See notes to financial statements Business-type Activities - Enterprise Funds Sewer Fund
  • 142. $ 4,490,696 (323,299) (.173.442 ) 2 I 945 $ 2,431,013 . (797,993) $ 1.633 ,090 $ (10,622,149) 17g,g7B 7,700,000 (615,000) (560,000) (383 ,166) $ (4,301.336 21 479$ $ 1,366,01g 954,072 (83,079) 3,406 753.527 -44- $2 945
  • 143. Busíness-type Activities - Enterprise Funds Governmental Activities - lnternal Service Funds 6,290,399 (5,029,794) (1.0 04,492 113 (164,257 Refuse Fund Storm Water Fund Total $ 2,957,493 $ 985,277 $ 8,333,456 $ (1,256,072) (1,697,960) (1.107 ,889) 2 500 888 $ 210 342 $ $ 1,843,432 $ (164,257) $ (243,002) $ (108,589) (219,557
  • 144. $ 593,532 $ 557,131 $ 4.144,608 $ 257 $ 343,792 (133,450) $ $ 2,774,865 $ (931 ,433) $( (519,789) 398,433 243,002) $ (121,356) I '156 $ 6,T04 $ 442,479 $ (11,384,939) 577,411 7,700,000 (615,000) (560,000) (383,166) $ (4,665,694) $ (213,717) $eß ,717 $ $ s7o,o2g 2,170,345
  • 145. $ 2,740,373 $ $ 37,339 $ 52,608 606 1041 1,359,685 8,372,736 $ 9,732,421 $ (68,253) 13,336,442 $ 13,268,189$ 2,048,s83 $ 226,132 $ 162,180 $ 1,754,330 $ (699,053) 417,246 390,483 1,761,901 419,092 (52,442) (3,702) (5,616) 6 298 10 084 (141,136) (2e6) 769,909
  • 146. 233,249 (92,015) 396 851 $ $ 4,144,609 $593 532 $ 557,131 -45- 257,113 dar Falls Oveffnan Park NOTE I NOTE 2 CITY OF CEDAR FALLS, ¡OWA NOTES TO FINANCIAL STATEMENTS INDEX SUMMARY OF SIGN¡FICANT ACCOUNTING POLICIES A. Reporting Entity B. Government-wideand Fund FinancialStatements C. Measurement Focus, Basis of Accounting, and Financial Statement Presentation D. Assets, Liabilities, and Net position or Equity STEWARDSHIP, COMPLIANCE, AND ACCOUNTABILITY
  • 147. A. Budgetarylnformation B. Deficit Fund Balances NOTE 3. DETA¡L NOTES ON ALL FUNDS A. Deposits and lnvestments B. Receivable C. CapitalAssets D. Leases E. Long{erm Debt F. Long-termLiabilities G. lnterfund Balances H. lnterfundTransactions NOTE 4. OTHER NOTES A. Retirement Systems B. Due To/From Component Unit C. Related Party Transactions D. Risk Management E. Commitments and Contingencies F. New GovernmentalAccounting Standards Board (GASB) Standards -46- Note 1 Summary of Significant Accounting Policies Reporting Entity The City of Cedar Falls is a municipal corporation governed by an elected mayor and seven-member council. As required by accounting principles generally
  • 148. accepted in the United States of America, these financial statements present the City and its component units, entities for which the City is considered to be financially accountable. The discretely presented component units are reported in a separate column in the combined financial statements to emphasize that they are legally separate from the City. The discretely presented electric, gas, water, and communications utilities each have a December 31 year end. Discretely Presented Component Unls. The electric, gas, water, and communications utilities serve all the citizens of the City and are governed by a five-member board appointed by the mayor of the City of Cedar Falls. The rates for user charges and bond issuance authorizations are approved by the City Council, and the legal liability for the general obligation portion of the Utilities' debt remains with the City. Complete financial statements for the Utilities may be obtained at the administrative offices Cedar Falls Utilities Utility Parkway Cedar Falls, lowa 50613 Jointly Governed Organizations. The City also participates in several jointly governed organizations for which the City is not financially accountable or that the nature and significance of the relationship with the City are such that exclusion does not cause the City's financial statements to be misleading or incomplete. City officials are members of the following boards and commissions: Black Hawk County Consolidated Public Safety Communications Center, Black
  • 149. Hawk County Solid Waste Management Commission, Black Hawk County Criminal Justice lnformation Systems and Metropolitan Transit Authority. Government-wide and Fund Financial Statements The government-wide financial statements (i.e., the statement of net position and the statement of activities) report information on all of the activities of the primary government and its component uníts. For the most part, the effect of interfund activity has been removed from these statements. Governmental activities, which normally are supported by taxes and intergovernmental revenues, are reported separately from business{ype activities, which rely to a significant extent on fees and charges for support. Likewise, the primary government is reported separately from certain legally separate component units for which the primary government is financially accountable. The statement of net position presents the assets and liabilities, with the difference reported as net position. Net position are reported in three categories. Net investment in capital assefs consists of capital assets, net of accumulated depreciation and reduced by outstanding balances for bonds, notes, and other debt that are attributed to the acquisition, construction, or improvement of those assets. Restricted net position result when constraints placed on net asset use are either externally imposed or imposed by law through constitutional provisions or enabling legislation.
  • 150. A. B. -47 - c. Unrestricted net position consist of net position that do not meet the definition of the two preceding categories. Unrestricted net position often have constraints on resources that are imposed by management, but can be removed or modified. The statement of activities demonstrates the degree to which the direct expenses of a given function or segment are offset by program revenues. Direct expenses are those that are clearly identifiable with a specific function or segment. Program revenues include 1) charges to customers or applicants who purchase, use, or directly benefit from goods, services, or privileges provided by a given function or segment and 2) grants and contributions that are restricted to meeting the operational or capital requirements of a particular function or segment. Taxes and other items not properly included among program revenues are reported instead as general revenues. Separate financial statements are provided for governmental funds and proprietary funds. Major individual governmental funds and major individual proprietary funds are reported as separate columns in the fund financial statements. All remaining
  • 151. governmental funds are aggregated and reported as other governmental funds. Measurement Focus, Basis of Accounting, and Financial Statement Presentation The government-wide financíal statements are reported using the economic resources measurement focus and the accrual basis of accounting, as are the proprietary fund financial statements. Revenues are recorded when earned and expenses are recorded when a liability is incurred, regardless of the timing of the related cash flows. Property taxes are recognized as revenues in the year for which they are levied. Grants and similar items are recognized as revenue as soon as all eligibility requirements imposed by the provider have been met. Governmental fund financial statements are reported using the current financial resources measurement focus and the modified accrual basis of accounting. Revenues are recognized as soon as they are both measurable and avaílable. Revenues are considered to be available when they are collectible within the current period or soon enough thereafter to pay liabilities of the current period. For this purpose, the government considers revenues to be available if they are collected within 60 days of the end of the current fiscal períod. Expenditures generally are recorded when a liability is incurred, as under accrual accounting. However, debt service expenditures, as well as expenditures related to compensated absences and claims and judgments, are recorded only when payment is due.
  • 152. Property taxes, franchíse taxes, licenses, interest, fines and forfeitures, and special assessments are susceptible to accrual. Sales taxes collected and held by the state at year-end on behalf of the City are also recognized as revenue. Other receipts and taxes become measurable and available when cash is received by the City and are recognized as revenue at that time. Entitlements and shared revenues are recorded at the time of receipt or earlier if the susceptible to accrual criteria are met. Expenditure-driven grants are recognized as revenue when the qualifying expenditures have been incurred, all other grant requirements have been met, and the criteria for accrual has been met. The City reports the following major governmental funds: The general fund is the City's primary operating fund. lt accounts for all financial resources of the general government, except those required to be accounted for in another fund. 48- The hospiúal fund accounts for the lease income derived from Sartori Memorial Hospital. The TIF fund accounts for property taxes received through tax increment financing. The sfreef repair fund accounts for local option sales tax received from the state to be used to
  • 153. repair streets. The sfreef construction fund accounts for state revenues allocated to the City to be used to maintain and improve the City's streets. The debf service fund accounts for the servicing of general long-term debt not being financed by proprietary funds. The FEMA fund accounts for the proceeds and expenditures related to disaster assistance and recovery. Ihe bond fund accounts for all bond proceeds not related to proprietary funds and all the related capital projects associated with the bond sales. The City reports the following major proprietary funds: The setøer fund accounts for the operations and maintenance of the City's sanitary sewer system. The refuse fund accounts for the operations and maintenance of the City's garbage collection. The sform water fund accounts for the operations and maintenance of the city's storm water system. Additionally, the City reports the following fund type: lnternal service funds account for operations that provide services to other departments or agencies of the City, or to other governments, on a cost- reimbursement basis. These include
  • 154. data processing, vehicle maintenance, health insurance, health insurance severance, payroll, and risk management activities. As a general rule the effect of interfund activity has been eliminated from the government-wide financial statements. Exceptions to this general rule are payments between the government's refuse and sewer functions and various other functions of the government. Elimination of the charges would distort the direct costs and program revenues reported for the various functions concerned. Amounts reported as program revenues include 1) charges to customers or applicants for goods, services, or privileges provided, 2) operating grants and contributions, and 3) capital grants and contributions. lnternally dedicated resources are reported as general revenues rather than as program revenues. Likewise, general revenues include all taxes. Proprietary funds distinguish operating revenues and expenses from nonoperating items. Operating revenues and expenses generally result from providing services and producing and delivering goods in connection with a proprietary fund's principal ongoing operations. The principal operating revenues of the refuse fund, sewer fund, and the government's internal service funds are charges to customers for services. Operating expenses for enterprise funds and internal service funds include the cost of services, administrative expenses, and depreciation on capital assets. All revenues and expenses not meeting this definition are reported as nonoperating revenues and expenses.
  • 155. When both restricted and unrestricted resources are available for use, it is the government's policy to use restricted resources first, then unrestricted resources as they are needed. -49- D. Assets, Liabilities, and Net position or Equity 1. Deposr'fs and lnvestments The City's cash and cash equivalents are considered to be cash on hand, demand deposits, and short-term investments with original maturities of three months or less from the date of acquisition. State statutes authorize the City and the Utility to invest publíc funds in obligations of the United States government, its agencies and instrumentalities; certificates of deposit or other evidences of deposit at federally insured depository institutions approved by the City Council; prime eligible bankers acceptances; certain high-rated commercial paper; perfected repurchase agreements; certain registered open-end management investment companies; certain joint investment trusts; and warrants or improvement certificates of a drainage district. lnvestments of the City and the Utility are reported at fair value. Due to legal and budgetary reasons, the General Fund is assigned a portion of the investment earnings associated with the other funds. These funds are Street Construction, Debt Service, and the Cemetery Perpetual Care Funds.
  • 156. 2. Receivables and Payables Activity between funds that are representative of lending/borrowing arrangements outstanding at the end of the fiscal year are referred to as either "due to/from other funds" (i.e., the current portion of interfund loans). All trade and property tax receivables are shown net of an allowance for uncollectibles. The County Treasurer bills and collects taxes for the City. Taxes for the year ended June 30, 2013, were certified with the County during the preceding fiscal year and were due in two equal installments by September 30, 2012 and March 31,2013. Property tax receivable is recognized on the levy or lien date, which is the date the tax asking is certified by the City to the County Board of Supervisors. Any County collections on the 2012-2013 tax levy remitted to the City within sixty days subsequentto June 30,2013, are recorded as propertytax revenues. Taxes notcollected and remitted to the City within sixty days subsequent to June 30, 2013, are delinquent and have been recorded as receivables and deferred revenue. By statute, the City is required to certify its budget in March of each year for the subsequent fiscal year. However, by statute, the tax asking and budget certification for the following fiscal year becomes effective on the first day of that year. Although the succeeding year property tax receivable has been recorded, the related revenue is deferred and will not be recognized as revenue until the year for which it is levied.
  • 157. 3. Inventories and Prepaíd ltems lnventories in the governmental fund types are valued at cost using the first-in/first-out method. The costs of governmental fund type inventories are recognized as expenditures when purchased. lnventories in the proprietary fund types and component unit are valued at the lower of first-in/first- out cost or market, except for fuel inventories of the Electric Utility, which are valued at the lower of last-in/first-out method cost or market. The cost of proprietary fund type and component unit inventories are recognized as expenses when consumed. -50- Certain payments to vendors reflect costs applicable to future accounting periods and are recorded as prepaid items in both government-wide and fund financial statements. 4. Restricted Assefs Certain assets of the component units are restricted because of applicable bond provisions 5. Capital Assefs Capital assets, which include property, plant, equipment, and infrastructure assets (e.g., roads, bridges, sidewalks, and similar items), are reported in the applicable governmental or business- type activities columns in the government-wide statement of net position. Capital assets are defined by the government as equipment with initial, individual
  • 158. cost of $2,500 or greater or a purchase of land, land improvements, building, or infrastructure with a value of $5,000 or greater and an estimated useful life of greater than one year. Such assets are recorded at historical cost or estimated historical cost if purchased or constructed. Donated capital assets are recorded as estimated fair market value at the date of donation. The costs of normal maintenance and repairs that do not add to the value of the asset or materially extend asset lives are not capitalized. Major outlays for capital assets and improvements are capitalized as projects are constructed. lnterest incurred during the construction phase of capital assets of business{ype activities is included as part of the capitalized value of the assets constructed. Capital assets are depreciated using the straight-line method over the following estimated useful lives: Computer Equipment 5 years Streets 30 years Equipment 10-30 years Buildings 40-50 years Office Equipment 10-30 years Land lmprovements 20-40 years Vehicles 10-20 years Storm Water 40 years Parking Lots 15 years Bridges 45 years Furniture 20 years Lift Stations 50 years Large Vehicles 20-40 years Sewer 50 years Traffic Signals 20 years Historic Buildings 100 years 6. Compensated Absences City employees accumulate vacation, sick leave, and comp-time hours for subsequent use or for
  • 159. payment upon termination, death, or retirement. Earned vacation pay and a maximum of one-half of all unused sick leave may be paid upon termination of employment. All severance is accrued when incurred in the government-wide and proprietary fund financial statements. A liability for these amounts is reported in governmental fund financial statements 51 only for employees that have resigned or retired. The compensated absence liability has been computed based on rates of pay in effect on June 30, 2013. 7. Long-term Obligations ln the government-wide financial statements and proprietary fund financiaf statements, long{erm debt and other long{erm obligations are reported as liabilities in the applicable governmental activities, business-type activities, or proprietary fund type statement of net position. Bond premiums and discounts are deferred and amortized over the life of the bonds using the straight- line method. Bonds payable are reported net of the applicable bond premium or discount. ln the fund financial statements, governmentalfund types recognize bond premium and discounts, as well as bond issuance costs, during the current period. The face amount of debt issued is reported as other financing sources. Premiums on debt issuances are reported as other financing