Ground Zero: The Nuclear Demolition of The World Trade Centre
1. Ground Zero:
The Nuclear Demolition of
The World Trade Centre
Incontrovertible Proof that the World Trade Centre was destroyed by
Underground Nuclear Explosions
by
William Tahil, B.A.
Ground Zero: the point on the ground directly under the explosion of a nuclear
weapon.
WTC01-02
WTC01-03
WTC01-14
WTC01-15
WTC01-16
WTC01-21
WTC01-22
WTC01-25
WTC01-27
WTC01-28
WTC01-20
WTC01-36
75
575
1075
1575
2075
2575
3075
3575
4075
partspermillion
Barium ppm
Strontium
ppm
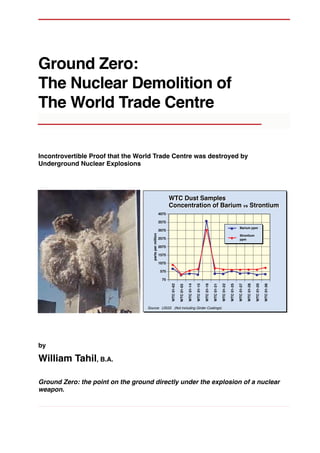
WTC Dust SamplesWTC Dust Samples
Concentration of BariumConcentration of Barium vsvs StrontiumStrontium
Source: USGS (Not including Girder Coatings)
2. William Tahil asserts his moral right to be identified
as the author of this work.
Copyright William Tahil 2006. All rights reserved. No
part of this publication may be reproduced, stored in a
retrieval system, or transmitted in any form or by any
means, electronic, mechanical, photocopying, recording
or otherwise, without the prior permission of the author.
3. This report is dedicated to
All those who are striving to keep the Light
of Truth, Liberty and Justice
Alive during these Dark Hours
Salus populi suprema lex esti
4.
5. New York September 17th 2001
Radioactive Dust Chokes the Air of Manhattan
From the Front Cover of the Sierra Club report “Pollution and Deception at Ground Zero”
6.
7. Ground Zero I
Contents
Preface
1 Introduction 1
2 Sources of Information 3
3 Evidence of Radioactive Fallout 5
Introduction 5
The Chemistry of Nuclear Fission 5
Isotopes 5
Fission and Decay Pathways 7
Decay Mechanisms 9
Half Life 12
The USGS Data 13
Sample Collection Procedure 13
Chemical Analysis 14
Notes on these Tables 21
The Major Elements 22
The Trace Elements 23
Overall Impression 23
Barium and Strontium 24
Zinc 29
Sodium and Potassium 32
Other Trace Elements 35
The Girder Coatings 51
Uranium and Thorium 54
Conclusion 56
The USGS Interpretation 57
Discussion and Analysis 61
The Fallout Characteristics 61
WTC 01-16 and 01-02 62
Permitted Barium and Strontium Concentrations 62
The Enhanced Radiation Bomb 63
Conclusion 71
8. II Ground Zero
Contents
4 The Seismographic Evidence 73
Introduction 73
What are Seismic Waves 73
What is the Difference between
an Earthquake and an Explosion? 74
P Waves vs S Waves 74
Surface Wave Pattern 76
Seismographic Analysis of the WTC Collapse 76
Further Commentary on The WTC Seismogram 82
Comparison with Nuclear Test Seismograms 85
Discriminating Between Explosions and Earthquakes 87
Energy Balance 88
Gravitational Potential Energy of WTC 88
Seismic Magnitude and TNT Equivalent 91
Miscellaneous Points 93
Summary 94
Conclusion 94
Appendix: Extracts from Articles and Web Sites 95
5 Residual Heat and Aerosol Information 97
Introduction 97
The Residual Heat of the Rubble 97
The AVIRIS Hot Spots 98
Eyewitness Account by Bechtel 100
The Pools of Molten Steel 101
UC Davis - Broiled and Superheated Rubble 104
Caustic Dust 105
Energy Comparison 106
Other Caustic Sources 107
Conclusion 107
University of California at Davis Aerosol Analysis 108
Stainless Steel 112
Diphenyl 113
Appendix: Extracts from Articles and Web Sites 113
N.Y.Air Hazards Found EPA Assurances Contradicted by UCD Scientists 115
New Seismic Data Refutes Official WTC Explanation 116
Letter from Mr. Mark Loizeaux to Mr. Gary Bryan of the Libertypost.org Website 119
New York Visit Reveals Extent of WTC Disaster 119
How Strong Is The Evidence For A Controlled Demolition? 120
9. Ground Zero III
Contents
6 The Blast Signature 121
Introduction 121
The Nuclear Blast Sequence 124
Conclusion 125
The Effects of an Underground
Nuclear Explosion 126
Pulverisation of the WTC 128
Pyroclastic Flow 129
Conclusion 130
Appendix: Extracts from Articles
and Web Sites 130
Explosions in the Basement 130
Comments by Mark Loizeaux 134
Baltimore Blasters 134
7 The China Syndrome 139
Introduction 139
The SADM 140
Evidence for a Core Meltdown 141
The WTC Light Memorial 141
Residual Heat and Molten Steel 144
Quantity of Fallout 144
The Explosive Power of a Critical Reactor 146
Conclusion 148
The China Syndrome 149
Loss of Coolant Accident 149
Transient 151
The 1993 WTC Truck Bomb 153
Evidence of Anomalous Facilities 154
Evidence of Underground Facilities 154
Evidence of Advanced Technology 155
The WTC Memorial 156
Effects of A Nuclear Explosion on New York 157
Historical Radiation Exposure
Experiments 159
8 Conclusion 161
Appendix A:
The Complexity of Fission 163
Quantity of Uranium in Reactor Core 164
11. Ground Zero i
Preface
On the 11th September 2001 at 09:59 and 10:28 EDT, two enormous
explosions pulverised to dust the Twin Towers of the World Trade Centre
in New York. The 400 metre high towers disintegrated in a volcanic
eruption of dust and rubble before the eyes of the entire world.
The buildings were “smulched into a smouldering pit” where
temperatures remained so hot that soil, concrete and glass continued to
be vaporised for over 6 weeks.
Never before or since in the history of modern construction has a steel
framed building collapsed due to a fire.
In the aftermath of the collapse, a team of US Geological Survey
scientists collected samples of dust from 35 locations in Lower
Manhattan where it came to rest from the enormous pyroclastic dust
cloud that enveloped the city.
In the dust, they found high levels of chemical elements that had no
business being there. Extremely rare and toxic elements. Elements
such as Barium, Strontium, Thorium, Cerium, Lanthanum, Yttrium. Even
some elements that only exist in radioactive form.
These elements are forensic evidence of the event that caused the
disintegration of the towers. They form a distinctive hallmark and
signature of a certain well known chemical process.
Nuclear Fission.
What was the enormous source of energy that caused the destruction of
the WTC? It was not a few thousand gallons of jet fuel. It was not even a
few thousand pounds of conventional explosives. It was a Nuclear
Explosion. Two Nuclear Explosions.
But even more than that, these were not just atomic bombs. The
explosions were caused by the deliberate core meltdown of two
clandestine nuclear reactors buried deep beneath the towers.
12. ii Ground Zero
Preface
The true perpetrators of this heinous act of terrorism must be brought to
justice. Lest we forget, not one person has yet been held to account for
their involvement in this act. Not only were 3,000 people vaporised that
day - thousands of others were subjected to intense radioactive fallout
and the entire population of New York is being callously used as
unwitting guinea pigs in a massive radiation exposure “experiment”.
The existence of these crimes against humanity and the planet must be
exposed and the real perpetrators apprehended.
New York, 9/11/01 was just one in a sequence of these deliberate
radiation exposure crimes. Kosovo, Afghanistan and Iraq have all been
heavily contaminated with Depleted Uranium weaponry. The very
genetic future of the peoples of these regions is under attack and in
some cases destroyed.
Where will be the next target of this Nuclear Madness if they are not
stopped?
13. Ground Zero 1
1 Introduction
This report presents incontrovertible evidence that the Twin Towers
of the World Trade Centre were destroyed by Nuclear Explosions.
The main explosive source was a nuclear device located in the
basement of each tower, tightly coupled to its foundation structure.
The incontrovertible proof that the towers were subjected to a nuclear
explosion is the presence of very high concentrations of the elements
Strontium and Barium in dust samples from the WTC collapse. Many
other characteristic products of nuclear fission are also present to
corroborate this. These samples were collected and analysed by the US
Geological Survey.
Strontium and Barium found together in closely related concentrations is
the signature of Nuclear Fission.
No other explanation can account for the presence of the large
quantities of Barium and Strontium discovered, in high concentrations
that vary in lockstep with each other at the different locations where dust
was collected across lower Manhattan.
The nuclear device under each tower was not an atomic bomb. The
evidence indicates that it was a clandestine nuclear reactor that was
caused to run out of control and enter an uncontrolled chain reaction,
followed by a core meltdown, similar to the Chernobyl disaster in
1986.
This report presents the detailed evidence which proves beyond a
shadow of a doubt that each Twin Tower of the WTC was destroyed
by a nuclear explosion.
15. Ground Zero 3
2 Sources of
Information
The report draws largely on the following sources of data and
information:
1. The chemical analysis of dust fallout samples from the WTC rubble
which covered Lower Manhattan after the collapse. This analysis was
performed by the US Geological Survey.
2. The seismographic data recorded by the Lamont-Doherty Earth
Observatory at the time the towers collapsed and its comparison to
known underground nuclear blast seismograms from the Lawrence
Livermore National Laboratory.
3. The Satellite Thermal Imaging of the WTC site carried out by the USGS
and eyewitness accounts of elevated debris temperatures and pools of
molten steel under the WTC.
4. The investigation and analysis of continual fallout from the WTC site in
the weeks following the collapse. This was carried out by the DELTA
Group led by Dr. Thomas Cahill, expert in atmospheric sciences at the
University of California Davis.
5. Comparison of known Underground Nuclear Blasts with photographs of
the WTC collapse.
6. An eyewitness account of the core meltdown at the Chernobyl nuclear
reactor and comparison to events at the WTC.
Other documentary sources of information were also used as
appropriate. These are referenced when quoted.
Data on the radioactive isotopes of the elements was sourced from “The
Elements”, John Emsley, OUP, Third Edition 1999.
This report aims to present the scientific evidence that the WTC was
destroyed by a nuclear explosion in as non-technical a way as possible
for a non-specialist audience. Where possible, I have explained the
background physics and chemistry involved. Where mathematics has
been used, the average reader should be able to follow it without
difficulty.
17. Ground Zero 5
3 Evidence of
Radioactive Fallout
3.1 Introduction
The most important evidence that the WTC was subjected to nuclear
explosions is the presence of distinctive radioactive fallout in the dust
that enveloped New York. Before we examine that dust and the
evidence that it was indeed contaminated with nuclear fallout, it will be
useful to first look at what takes place in a nuclear reactor or atomic
bomb. This chapter explains how radioactive fallout is produced, what
distinctive substances are produced as a characteristic signature of
nuclear fission and then goes on to compare that to what was actually
found in the dust.
3.2 The Chemistry of Nuclear Fission
Nuclear fission is quite a complex subject and scientists have developed
sophisticated computer models to try and predict what will actually
happen when a bomb is detonated or a reactor "goes live". But the
essential idea relevant to what we are going to present is that a
chemical element, i.e. Uranium, turns into other elements in a very
distinctive way, releasing energy as it does so. This leaves behind a
distinctive forensic trail which provides irrefutable evidence of the type
of chemical reaction that produced it - Nuclear Fission.
Isotopes
The nucleus of an atom contains two types of particle: neutrons and
protons. The number of protons determines the chemical element - i.e.
whether it is an atom of carbon, iron, uranium or something else. The
number of protons is called the Atomic Number and has the symbol Z.
The sum of the number of protons and neutrons is called the Atomic
Weight of the element. If the number of protons changes, the element
changes into a different element. However, if the number of neutrons
changes while the number of protons stays the same, the element
remains chemically unchanged - it is still the same element, although
the weight of its nucleus has changed, as well as its radioactive
properties.
18. 6 Ground Zero
Evidence of Radioactive Fallout
Atoms of the same element with different numbers of neutrons are
called isotopes of that element.
Different isotopes of Uranium for example therefore have the same
number of protons as each other but different numbers of neutrons.
Different isotopes have different stability and radioactive half lives. The
two main isotopes of Uranium are Uranium 235 and Uranium 238. The
numbers 235 and 238 tell us the atomic weight of each isotope: since
the number of protons has to be the same in each, we can see that
U238 has three more neutrons in its nucleus than U235.
In the nuclear fission reaction used to generate electrical power or to
explode an atomic bomb, atoms of the Uranium 235 isotope are
bombarded with neutrons. These neutrons "split the atoms" of Uranium
235 into two smaller pieces - i.e. into two smaller atoms which by
definition will be atoms of elements different to Uranium. In the process,
a large amount of energy is released which can either be used for
destructive purposes in a bomb or constructive purposes in a nuclear
reactor.
Figure 1 shows one of the most common reactions that occurs when
Uranium 235 is fissioned. The Uranium atom, with 92 protons, splits into
two atoms, one of Strontium 90 with 38 protons and one of Xenon 143
with 54 protons.
FIGURE 1 NUCLEAR FISSION OF URANIUM
In Figure 1, there are therefore two numbers next to each element. The
bottom number is the number of protons which defines that element for
what it is. Uranium will always have 92 protons, Strontium will always
have 38 protons and so on.
The upper number is the atomic weight of the atom and is the sum of the
number of protons and neutrons in the nucleus. Therefore this is the
number that will change when neutrons are added or removed to create
different isotopes. U235 and U238 are different isotopes of Uranium with
different radioactive properties. U238 has 3 more neutrons than U235.
U
235
92
neutron
γ radiation
Xe
143
54
Sr
90
38
neutrons
neutronproton
19. Ground Zero 7
The Chemistry of Nuclear Fission
Protons are positively charged, neutrons are neutral and electrons are
negatively charged.
We will see how this accounts for what was found in the WTC dust later.
Fission and Decay Pathways
Unlike a standard chemical reaction in a test tube, a whole range of
elements is produced when an atom of Uranium undergoes fission.
However, nuclear fission tends to favour certain “pathways” over others
and much more of some distinctive elements is created than others.
Two of the most common and distinctive elements produced are Barium
and Strontium.
These two elements are the signature of Nuclear Fission.
Therefore the two most important “pathways” for Uranium fission lead
to Barium and Strontium. Nuclear fission was in fact first discovered by
Otto Hahn in the 1930s because he found Barium in a Uranium sample
after he had bombarded it with neutrons. The uptake of Strontium into
children’s milk teeth has been used to monitor the fallout from
atmospheric atomic bomb tests since the 1960s. Strontium displaces
Calcium in teeth and bones.
The diagram below shows these two major pathways in more detail.
FIGURE 2 FISSION AND DECAY PATHWAYS
When a Uranium atom is hit with a neutron, it fissions or splits into two
"Fission Fragments" - unstable isotopes of Xenon and Bromine. These
in turn decay relatively quickly to Barium and Strontium. Barium and
Strontium in turn have longer half lives and decay relatively slowly, so
they will persist in fallout for some time. Over a longer period, the
Barium and Strontium will then decay until a stable isotope of
Neodymium and Zirconium is reached, when radioactive decay stops.
235U
n
Fission Fragment with 143 nucleons
Fission Fragment with 93 nucleons
Xe Cs Ba La
Sr Y Zr
Ce Pr Nd
Br Kr Rb
n Neutron
Beta particleβ
β β β β β
β β β β β β
20. 8 Ground Zero
Evidence of Radioactive Fallout
One of the main energy releasing reactions in a nuclear reactor or bomb
is often shown as follows:
(EQ 1)
In this nuclear fission reaction, a Uranium atom is split into Barium and
Krypton gas. (We can see this in Figure 2 above. Barium is the third
decay element in the top row, Krypton is the second decay element in
the bottom row). 200MeV (mega electron volts) of energy are also
released. This energy is used in the reactor to heat water to produce
steam to then drive a turbine and generate electricity.
Another main fission reaction is often shown as:
(EQ 2)
The Barium and Strontium and other elements produced are
themselves radioactive and therefore decay with time into yet other
elements, which leaves more “forensic evidence” that nuclear fission
has occurred. This is shown above in Figure 2.
Many other pathways occur as well but those shown in Figure 2 are two
of the most important.
Some of the other common fission reactions of Uranium are shown
below:
(EQ 3)
When the USGS collected and then analysed the dust samples, they
would still be radioactive - and indeed, still are today. Over time, the
quantity of each element present will change as it decays into its
“daughter product” further down the pathway, until a stable element is
reached. We will see the signature of this in some of the dust samples.
In the pathway diagram above, we see that the Uranium atom splits into
two pieces. These decay via Barium on the one hand and Strontium on
the other. We will see when we look at the USGS data that the daughter
products of Barium (Lanthanum and Cerium) and of Strontium
(Yttrium) are also present in the dust in statistically significant
quantities.
92
235
U +0
1
n→144
Ba +90
Kr +20
1
n + 200 MeV
92
235
U +0
1
n→143
Xe +90
Sr +30
1
n
92
235
U +0
1
n→135
I +97
Y +40
1
n
92
235
U +0
1
n→139
Ba +94
Kr +30
1
n
92
235
U +0
1
n→131
Sn +103
Mo +20
1
n
92
235
U +0
1
n→139
Xe +95
Sr +20
1
n
21. Ground Zero 9
The Chemistry of Nuclear Fission
Decay Mechanisms
These Decay Pathways are complicated by the fact that different
radioactive isotopes of each element are formed when the original
Uranium atom fissions and these isotopes in turn decay in different
ways.
The most important decay mechanisms are:
1. Electron emission or beta particle emission. Beta particles are
negatively charged, very low weight particles. They are denoted as β-
in
nuclear chemistry. Electron emission increases the atomic number (Z)
by one.
2. Positron emission - these are positively charged electrons or beta
particles. They are shown as β+
and positron emission decreases the
atomic number by one.
3. Electron capture (EC) - the nucleus absorbs an electron or beta particle,
also decreasing the atomic number by one.
4. Alpha particle emission. An alpha particle (α) is a Helium nucleus
containing 2 protons and 2 neutrons. When an alpha particle is emitted
the atomic number of the nucleus therefore falls by two and the atomic
weight falls by four.
What does all this mean?
Look at the Periodic Table in Figure 3 and find Xenon with Atomic
Number 54 on the right hand side.
We have already seen (Figure 2) how Xenon decays into Caesium,
Barium, Lanthanum etc. by beta particle emission. Each time this
happens, the Atomic Number of the atom increases by one and the
element changes into the next higher element in the Periodic Table.
How does this happen?
Remember, the nucleus consists of positively charged protons and
neutral neutrons. The neutron can be thought of a being a combination
of a positive proton and a negative electron. When a negative electron is
emitted, a neutron loses a negative change and becomes a positive
proton - so the Atomic Number Z increases by one and the element
changes. The weight hardly changes at all though, since electrons have
negligible mass compared to protons and neutrons.
However, some isotopes of Xenon do not decay by beta emission: they
change by emitting positrons or even by Electron Capture - they absorb
beta particles. When this happens, a proton in the nucleus becomes
neutralised by absorbing an electron and turns into a neutron; the
Atomic Number therefore falls by one instead of increasing. Some
isotopes of the daughter products of Xenon produced by this
mechanism also absorb electrons and so continue decaying or
transmuting in the same way.
22. 10 Ground Zero
Evidence of Radioactive Fallout
FIGURE 3 PERIODIC TABLE OF THE ELEMENTS
3
Li
4
Be
11
Na
12
Mg
19
K
20
Ca
37
Rb
38
Sr
55
Cs
56
Ba
87
Fr
88
Ra
21
Sc
22
Ti
23
V
24
Cr
25
Mn
29
Cu
30
Zn
27
Co
26
Fe
28
Ni
39
Y
40
Zr
41
Nb
42
Mo
43
Tc
47
Ag
48
Cd
45
Rh
44
Ru
46
Pd
71
Lu
72
Hf
73
Ta
74
W
75
Re
79
Au
80
Hg
77
Ir
76
Os
78
Pt
5
B
6
C
7
N
8
O
9
F
10
Ne
13
Al
14
Si
15
P
16
S
17
Cl
18
Ar
31
Ga
32
Ge
33
As
34
Se
35
Br
36
Kr
49
In
50
Sn
51
Sb
52
Te
53
I
54
Xe
81
Tl
82
Pb
83
Bi
84
Po
85
At
86
Rn
89
Ac
90
Th
91
Pa
92
U
93
Np
94
Pu
57
La
58
Ce
59
Pr
60
Nd
61
Pm
65
Tb
66
Dy
63
Eu
62
Sm
64
Gd
67
Ho
68
Er
69
Ym
70
Yb
1
H
2
He
PeriodicTableoftheElements
23. Ground Zero 11
The Chemistry of Nuclear Fission
Therefore we will see something like this:
(EQ 4)
This produces elements such as Iodine, Tellurium and Antimony.
So Xenon (and Bromine and Krypton in the Strontium pathway) will
decay in two directions - or more precisely, the different isotopes of
Xenon, Krypton etc. decay in two directions: one towards elements of
higher atomic number and one towards elements of lower atomic
number.
We will see in the data how there sometimes appear to be two
relationships between elements in the dust - as one element increases
in concentration another appears to both increase and decrease. This
can be explained by these two opposing radioactive decay
mechanisms.
Xe + β−
→ I
I + β−
→ Te
Te + β−
→ Sb
24. 12 Ground Zero
Evidence of Radioactive Fallout
Half Life
The other piece of nuclear chemistry we will find useful later on is the
concept of half life.
Different radioactive isotopes take varying amounts of time to decay
away into the next element along the chain. The time it takes for half the
atoms in a sample of a particular isotope to decay is called the half life of
that isotope. Sr90 has a half life of about 28 years.
This is illustrated in the graph below: after one half life period, 50% of
the original amount remains; after two half life periods, 25% remains
and so on.
FIGURE 4 RADIOACTIVE HALF LIFE DECAY
The formula for this radioactive decay is:
(EQ 5)
where t is the elapsed time, N0 is the original number of atoms present
at time t=0, N is the number of atoms left at time t and λ is a constant.
For the half life, N/N0 = 0.5. From this, the Radioactive Decay Constant
λ can be calculated for each isotope if we know the half life time, thalf.
We can then use λ to calculate how much of an isotope must have
decayed away in any time t we choose.
0 1 2 3 4 5
0%
10%
20%
30%
40%
50%
60%
70%
80%
90%
100%
PercentageRemaining
Number of Half Life Periods
Radioactive Half Life DecayRadioactive Half Life Decay
N
N0
= e− λt
25. Ground Zero 13
The USGS Data
3.3 The USGS Data
The incontrovertible evidence that the WTC was brought down by
nuclear explosions is contained in an analysis of the dust fallout from
the buildings carried out by the United States Geological Survey.
In the aftermath of the collapse, a USGS team took representative
samples of the dust from 35 locations in Lower Manhattan near the site
of the WTC. This included samples from two indoor sites (in local
buildings) and two samples from the insulation coatings of girders used
in the construction of the towers.
Their report entitled “Environmental Studies of the World Trade
Centre area after the September 11, 2001 attack” was published on
the USGS website1
, with classification Open File Report OFR-01-0429,
Version 1.1, Published November 27, 2001.
The introduction to the report describes its context as follows:
“The information in this report describes the results of an
interdisciplinary environmental characterization of the World Trade
Center (WTC) area following requests from other Federal agencies after
the attack on September 11, 2001. The scientific investigation included
two main aspects: 1) imaging spectroscopy mapping of materials to
cover a large area around the WTC and 2) laboratory analysis of
samples collected in the WTC area."
The spectroscopic imaging was carried out by the airborne infra-red
system AVIRIS, which we will come back to later.
Sample Collection Procedure
The USGS described the sample collection procedure2
as follows:
"Sample Collection in the World Trade Center Area, Sept. 17-18,
2001"
“A 2-person USGS crew collected grab samples from 35 localities
within a 0.5 -1 km radius circle centred on the World Trade Centre site
on the evenings of September 17 and 18, 2001 (see sample
collection map, below). “
"Many of the streets bordering the collection locations were cleaned or
were in the process of being cleaned at the time of sample collection.
Given this limitation, collection of dust samples was restricted to
undisturbed window ledges, car windshields, flower pots, protected
areas in door entry ways, and steps. Occasionally, samples were
collected from the sidewalk adjacent to walls that were afforded some
1. http://pubs.usgs.gov/of/2001/ofr-01-0429/index.html
2. http://pubs.usgs.gov/of/2001/ofr-01-0429/sample.location.html
26. 14 Ground Zero
Evidence of Radioactive Fallout
degree of protection from the elements and cleanup process. In many
cases the samples formed compact masses suggestive of having
been dampened by rain and having dried in the intervening 3 - 4
days. Two samples of an insulation coating (WTC01-8 and WTC01-
9) were collected from steel girders recently removed from the debris
pile of the WTC. Samples were gathered by nitrile-gloved hand and
put into doubled plastic sample bags (sample bag in another sample
bag). Initially, Global Position Satellite (GPS) locations were collected
for the sample collection locations, but this approach was abandoned
because of difficulty in acquiring a satellite signal between tall
buildings. Instead, sample locations were identified using road
intersections where road signs remained intact. All but two of the
samples were collected outdoors and had been subjected to wind and
water during a rain storm the night of September 14. One sample
(WTC01-20) was collected indoors near the gymnasium in the World
Financial Centre directly across West Street from the World Trade
Centre. Samples of concrete (WTC01-37A and WTC01-37B) were
collected from the WTC debris at the same location as WTC01-9. A
sample of dust (WTC01-36) blown by the collapse into an open
window of an apartment located 30 floors up and 0.4 km from the
centre of the WTC site was also acquired a few days later. "
http://pubs.usgs.gov/of/2001/ofr-01-0429/sample.location.html
The USGS map of the sampling locations in Manhattan is reproduced in
Figure 36 on page 59.
Chemical Analysis
The report then gives a detailed chemical analysis of the dust samples.
The table of data is reproduced below1
.
1. nm means data was not measured from that sampling location.
2. % means percentage of the sample by weight
3. ppm means parts per million of the sample by weight.
4. 1 ppm = 0.0001% or 1% = 10,000 ppm
1. http://pubs.usgs.gov/of/2001/ofr-010429/chem1/ WTCchemistrytable.html
33. Ground Zero 21
The USGS Data
Notes on these Tables
The data was divided by the USGS into two categories:
1. Major Elements
2. Trace Elements
The USGS classified as "Major Elements" those elements found in high
enough quantities to be measured in percentage terms by weight. This
included the common everyday elements that one would expect to find
in building rubble as well as some other less common elements.
The USGS classified as "Trace Elements" any less common elements
that were either only found in relatively small quantities or should only
have been found in small quantities, if at all. They are shown in ppm by
weight. 1ppm = 1mg/kg.
Summary Table
The Summary Table (Table 3) shows the Maximum, Minimum and Mean
values taking into account all of the sample locations, including the
indoor samples and the two girder coatings. The two girder coatings had
very different characteristics to both the indoor and outdoor dust
samples.
Location Identifiers
The location identifiers WTC 01-02 etc. refer to the locations in Lower
Manhattan around the WTC where the USGS team took a sample.
These are shown on the USGS diagram “Chemistry Figure 4” (our
Figure 36 on page 59) which is supposed to show the variation in
concentration of the predominant trace elements in the dust at different
locations in Lower Manhattan around the WTC.
34. 22 Ground Zero
Evidence of Radioactive Fallout
3.4 The Major Elements
The most abundant elements discovered were Silicon and Calcium,
which is what one would expect from building rubble and dust. Concrete
is made from 44% Calcium Oxide, 15% Silicon Dioxide (better known as
sand) and smaller percentages of Aluminium Oxide, Ferric Oxide,
Magnesium Oxide and Gypsum (Calcium Sulphate). Plaster is also
made from Gypsum.
The major elements discovered at over 1% concentration tend to
correlate with this.
The levels of some of the other elements shown in the table in
percentage weight terms are, however, unusual. Sodium and Potassium
are not particularly "rare" elements but the levels measured correlate
strongly with some of the anomalous trace elements discovered. We will
look at these in the trace element section in comparison to Zinc.
Titanium and Manganese are really trace elements even though they
have been included by the USGS in the table with percentage
measurements, not ppm. The Titanium constituted 0.26% of the dust or
2600ppm on average and is present across nearly all locations at about
the same concentration of 0.25 - 0.3%, but had an even higher peak
value of 3900ppm at location WTC 01-02. This is very high and we will
also discuss the possible significance of this in the next section on the
trace elements.
Titanium Oxide is sometimes added as a pigment to cement and
concrete if a light coloured or even white concrete is desired. For
extremely white concrete, up to 5% TiO can be added. The facade of the
WTC was 30% glass and 70% aluminium cladding so this would not
have required white concrete for aesthetic purposes. TiO is also
expensive so it will only be used where necessary.
The levels of Manganese in the dust are also very high, averaging
0.11% or 1100ppm. We are not aware of any common building material
that could account for this - but interesting correlations with the other
trace elements were found when the data was analysed.
Therefore we have included analysis of the Sodium, Potassium,
Titanium and Manganese levels in the next section on the trace
elements, since the high levels discovered in the dust were anomalous.
There are some telling patterns in the Sodium and Potassium data and
Titanium and Manganese should have only been found in trace
quantities, not an average of 2600ppm (0.26%) and 1100ppm (0.11%)
respectively.
35. Ground Zero 23
The Trace Elements
3.5 The Trace Elements
Now we will examine the elements classified as trace elements by the
USGS, listed in ppm or parts per million.
A concentration of 1% is 1 part per 100 or 10,000 parts per million
(ppm). Therefore 1 part per million is 1 ten thousandth of a percent.
Let us examine the Top 10 trace elements, as they were classified by
the USGS, with the missing values (not measured) removed:
Overall Impression
It does not take much detective work to see that something very strange
has taken place.
The figures for Barium, Strontium and Zinc leap off the page.
The highest concentrations of trace elements discovered across the
sampling locations were by far for Zinc, Strontium and Barium followed
by Lead, Copper and Chromium.
Immediately, we see very high concentrations of Zinc and Strontium at
location WTC 01-02 and even higher concentrations of Barium and
Strontium at WTC 01-16 exceeding 3000ppm. The Zinc concentration
exceeds 1000ppm for all the dust samples.
TABLE 4 TOP 10 TRACE ELEMENTS
Dust Samples (ppm)
Outdoor Dust Ba Sr Zn Pb Cu Ce Y Cr Ni La
WTC 01-02 765 1000 2990 710 438 108 58.9 224 88.4 51
WTC 01-03 376 409 1200 176 142 50.9 30.2 98 30.8 25.8
WTC 01-14 461 643 1570 276 242 68.8 46.5 116 28.6 34.8
WTC 01-15 405 736 1110 152 367 64.9 46.1 129 32.9 32.7
WTC 01-16 3670 3130 1410 208 307 132 31.4 95.2 31.4 69.9
WTC 01-21 460 787 1500 278 153 77 54.5 104 31.2 38.6
WTC 01-22 452 710 1380 452 130 72 47.6 111 30.6 35.4
WTC 01-25 624 695 1910 756 251 85 61.6 134 39.2 43.5
WTC 01-27 470 701 1650 204 188 77.7 54.9 126 39.4 39.5
WTC 01-28 491 711 1720 234 218 75 53.8 106 26.1 38.4
Indoor Dust Ba Sr Zn Pb Cu Ce Y Cr Ni La
WTC 01-20 390 706 1330 153 176 61.6 44.1 94 29.8 31.3
WTC 01-36 438 823 1400 159 95 70.2 52.6 107 28.5 35.6
Girder
Coating
Ba Sr Zn Pb Cu Ce Y Cr Ni La
WTC 01-08 317 444 57.4 9.13 10.3 202 134 153 202 102
WTC 01-09 472 378 101 11.7 12.8 356 243 86.5 22.6 175
36. 24 Ground Zero
Evidence of Radioactive Fallout
These concentrations far exceed what is normally considered to be a
"trace" amount. For instance, there is between 1g/kg and 3g/kg of Zinc
present in the dust. There is frequently more than 0.7g/kg of Strontium
in the dust, with over 3g/kg at one location. These quantities are
unprecedented.
A "trace" amount would normally be considered to be less than 10ppm
but that does not necessarily mean that even 10ppm of some
substances would be acceptable or normal.
We now examine this in more detail.
Barium and Strontium
Looking at the first two columns of data, we see that the concentration of
Barium and Strontium hardly falls below 400ppm for Barium or below
700ppm for Strontium, and reaches well over 3000ppm for both of them
at WTC 01-16.
Barium and Strontium are rare trace elements with limited industrial
uses. Strontium salts are mainly used to produce the red colour in
fireworks. Barium is used in some paints, for the manufacture of some
glass and as a "getter" in vacuum tubes. Both elements are highly toxic.
These elements simply should not be present in building rubble or
building materials in even a valid trace amount, which would be less
than 10ppm or 10mg/kg.
Below we have graphed the concentration of Barium and Strontium in
the dust at the Outdoor and Indoor Sampling locations.
37. Ground Zero 25
The Trace Elements
FIGURE 5
The enormous peak in Strontium and Barium concentration at WTC 01-
16 is readily apparent. The concentration of the two elements reaches
3670ppm and 3130ppm respectively or over 0.3% by weight of the dust.
This means that 0.37% of the sample was Barium and 0.31% of the
sample was Strontium by weight at that location.
This is higher than even the Titanium concentration at WTC 01-16 of
0.25%.
This is quite simply astronomical. Barium and Strontium compounds are
not valid constituents of concrete or any other building material such as
glass, aluminium, plaster and steel. They should not be there. Even at
the other sampling locations the Barium and Strontium concentration
does not fall below 400ppm, which is still an astronomically high level to
detect for these elements.
The mean concentration of Barium including the low girder coating
readings is 533ppm and for Strontium, 727ppm.
These are not trace amounts. They are highly dangerous and toxic
amounts.
WTC01-02
WTC01-03
WTC01-14
WTC01-15
WTC01-16
WTC01-21
WTC01-22
WTC01-25
WTC01-27
WTC01-28
WTC01-20
WTC01-36
75
575
1075
1575
2075
2575
3075
3575
4075
partspermillion
Barium ppm
Strontium
ppm
WTC Dust SamplesWTC Dust Samples
Concentration of Ba and SrConcentration of Ba and Sr
Source: USGS (Not including Girder Coatings)
38. 26 Ground Zero
Evidence of Radioactive Fallout
Correlation Between Ba and Sr
In Figure 6 below, the concentration of Barium at each location is plotted
against the Strontium concentration.
FIGURE 6
The correlation between the concentrations of the two elements Barium
and Strontium is very strong. The graph on the left shows just the first 9
locations, where the concentration of both Barium and Strontium was
below 1000ppm. The graph on the right adds the 10th data point at
WTC 01-16, where the concentration of Barium and Strontium both shot
up to over 3000 ppm.
By inspection we can see that the data lies on an asymptotic curve.
Looking at the left hand graph in particular, most of the points form a
very tight cluster (circled in red), where the Barium concentration was
between 400-500ppm and the Strontium concentration was between
700 - 800ppm. This is extremely telling that such a high number of
samples had very similar concentrations. It shows a fairly homogeneous
dispersal of the radionucleides by the blast (with the exception of one
data point at WTC 01-16) and that the Barium and Strontium
concentrations are related in a fairly distinct and narrow band - they
were produced by a common process. The high concentration at WTC
01-16 still fits the correlation relationship - evidently the process which
had produced the Strontium and Barium was still ongoing and active at
that location, leading to an extremely high concentration there.
Correlation Coefficient
The quality of this correlation can be quantified statistically using what is
known as the Product Moment Correlation Coefficient. Correlation
Coefficients are used to estimate how strong is the relationship between
two different things - e.g. between smoking and lung disease. If there is
a high correlation coefficient - the two things might be linked.
Using this method, the Coefficient of Correlation between the
concentration of Barium and Strontium at the outdoor and indoor
0
500
1000
1500
2000
2500
3000
3500
0 500 1000 1500 2000 2500 3000 3500 4000
Strontium(ppm)
Barium (ppm)
WTC Dust SamplesWTC Dust Samples
Concentration of Ba vs SrConcentration of Ba vs Sr
Not including Girder Coatings
0
100
200
300
400
500
600
700
800
900
1000
0 100 200 300 400 500 600 700 800
Strontium(ppm)
Barium (ppm)
WTC Dust SamplesWTC Dust Samples
Concentration of Ba vs SrConcentration of Ba vs Sr
Not including Girder Coatings
39. Ground Zero 27
The Trace Elements
sampling locations is 0.99 to 2 decimal places (0.9897 to 4 decimal
places).
• The Correlation Coefficient between the Concentration of Barium and
Strontium is 0.9897
The maximum Correlation Coefficient that it is mathematically possible
to obtain is 1. This would mean that there is a perfect "match" between
the two factors we are looking at and the data points for the two
elements would lie on a completely straight line with no variation
between them.
To obtain a Correlation Coefficient of 0.9897 with this number of
measurements, taken at different places around Manhattan, is very,
very significant indeed.
What this means is, we can say there is a 99% correlation in the
variation in the concentration between the two elements. They vary in
lockstep. We can say with absolute mathematical certainty that any
change in the concentration of one of these elements, either the Barium
or the Strontium, is matched by the same change in the concentration of
the other.
Whatever process gave rise to the presence of the Barium or the
Strontium, must have produced the other one as well.
There is only one process that can account for this: a very well known
process indeed that we discussed at the beginning of this chapter.
Nuclear Fission.
We can use another statistical procedure to test whether this
correlation between the two values could have arisen by chance. For
instance, if there are only two data points, one could not fail to obtain
very good correlation between them (correlation of 1 in fact).
This is because if you only have two data points, you can only draw a
straight line to join them together.
Therefore if there are only a small number of data points, maybe half a
dozen or so and a high correlation is observed, it may be due to chance
rather than any real underlying connection, if we do not know or cannot
provide a logical explanation for what is causing the link.
The USGS took 12 measurements for Barium and Strontium (not
including the two Girder Coatings which we have excluded for the
moment since they are of a different qualitative type).
Using what is called a t test statistic, another statistical technique, we
obtain a t value of 21.83 for the correlation coefficient of 0.99 with 12
data points. Without explaining this in detail, what this tells us is that the
chance that such a high correlation coefficient could have arisen by
chance with 12 measurements is vanishingly small.
40. 28 Ground Zero
Evidence of Radioactive Fallout
In addition we are not working in the dark, without scientific knowledge
of any process that could both: a) cause Barium and Strontium to be
present in the first place and b) cause such a strong relationship
between the concentration of Barium and Strontium in the different
samples.
We do know what process would cause this. We know that if that
process had occurred, Barium and Strontium would be present. And we
know that if that process had occurred, a strong statistical correlation
between the quantities of Barium and Strontium would be found.
That process is Nuclear Fission.
Girder Coatings
About 400ppm of Barium and Strontium was measured in two samples
of insulation girder coatings (WTC 01-08 and 01-09). The concentration
of Strontium1
, [Sr], actually falls somewhat below that of Barium in the
second girder WTC 01-09, as at WTC 01-16, whereas in every other
sample the level of Strontium discovered was higher than Barium. Given
the elevated levels of Barium daughter products found in the second
girder and even the highest level of Uranium discovered, this probably
shows that active fission was still ongoing in the second girder coating,
in the same way as at WTC 01-16 and therefore more Barium was
found than Strontium; in other samples where the rate of fission had
slowed down to give way to decay, the concentrations of Barium and
Strontium reverse, due to the different half lives. Barium isotopes have a
shorter half life than Strontium isotopes so they decay more quickly and
after a period of time when no new Barium or Strontium has been
deposited, [Sr] will exceed [Ba]. The fact that more Barium than
Strontium was still found at WTC 01-16 and WTC 01-09, shows that the
overall nuclear processes taking place were somewhat favouring
Barium over Strontium - and hence Zinc as well, as we will explore later.
Summary
The tight cluster of Barium (400 - 500ppm) and Strontium (700 -
800ppm) concentrations across widely separated sampling locations in
Manhattan is cast iron proof that Nuclear Fission has occurred. We
know that Barium and Strontium are the characteristic signature of
fission: they are formed by two of the most common Uranium fission
pathways. The fact that their concentrations are so tightly coupled
means that their source was at the very epicentre of the event which
created the dust cloud that enveloped Manhattan. It was not a localised
pre-existing chemical source which would have only contaminated a few
closely spaced samples and left the rest untouched.
The very high concentrations of Barium and Strontium at location WTC
01-16 show that active nuclear fission was still ongoing at that spot: the
dust was still "hot" and new Barium and Strontium was being actively
generated by transmutation from their parent nuclei.
1. [Sr] denotes the concentration of Strontium
41. Ground Zero 29
The Trace Elements
Zinc
We will now examine the quantities of Zinc that were detected in the
WTC dust samples.
Looking at the column of data for Zinc in Table 4, the concentration of
2990ppm at WTC 01-02 immediately stands out. In fact, for the outdoor
samples, Zinc is the most common trace element at all sampling
locations, with generally between 1000ppm and 2000ppm except for
this spike of nearly 3000ppm at WTC 01-02.
This translates to what is an enormous concentration of 0.1% to 0.2% of
Zinc in the dust overall and at WTC 01-02, 0.299% of the dust was Zinc.
This exceeds the concentration of the supposed "non-trace" element
Manganese and Phosphorous and almost equals the elevated Titanium
concentration of 0.39% at that location.
Where did all this Zinc come from?
Comparison of Zinc to Barium and Strontium
In the following graph, we additionally plot the Zinc concentration at
each location in comparison with the Barium and Strontium.
FIGURE 7
One can see that the peak in Zinc concentration at WTC 01-02 is also
accompanied by a higher Ba and Sr concentration for those elements
than at any of the other locations except WTC 01-16, but the
concentrations of Zn, Sr and Ba all vary together in a similar way at all
locations, except at WTC 01-16 and in the girder coatings, which are the
last two data points WTC 01-08 and WTC 01-09.
WTC01-02
WTC01-03
WTC01-14
WTC01-15
WTC01-16
WTC01-21
WTC01-22
WTC01-25
WTC01-27
WTC01-28
WTC01-20
WTC01-36
WTC01-08
WTC01-09
75
575
1075
1575
2075
2575
3075
3575
4075
partspermillion
Barium ppm
Strontium ppm
Zinc ppm
WTC Dust SamplesWTC Dust Samples
Concentration of Ba, Sr, ZnConcentration of Ba, Sr, Zn
Source: USGS (Including Girder Coatings)
42. 30 Ground Zero
Evidence of Radioactive Fallout
If we include the data for WTC 01-16, the Correlation Coefficient
between the Zinc and Barium concentration is 0.007 to 3 decimal
places, from which we would conclude there is absolutely no correlation
at all.
If we exclude that one sampling location, where the Ba and Sr
concentrations peaked, the correlation coefficient between the Zinc and
Barium is 0.96 to 2 decimal places and between the Zinc and Strontium,
0.66 to 2 decimal places.
This can be seen on the following graphs, where we plot the
concentration of Barium and Strontium at each location against the Zinc
concentration.
FIGURE 8
This shows that the Zinc and Barium concentrations are closely related
and if we exclude what must have been an extraordinary event at WTC
01-16 as an outlier, the correlation is very good. The Product Moment
Correlation Coefficient is 0.96. (We will discuss later why WTC 01-16
might be so qualitatively different to the other locations).
By inspection we can see that the equation of the line of best fit is
approximately:
[Zn] = 3 • [Ba].
i.e. the concentration of Zinc is 3 times the concentration of Barium.
Calculated by the method of least squares, the equation for the best fit
regression line is: [Zn] = 4.4[Ba] - 538.
The correlation between the Zinc and Strontium is not so clear, showing
that the relationship must be more indirect. We would expect this, since
Strontium and Barium are produced by different nuclear fission
pathways.
0
500
1000
1500
2000
2500
3000
0 500 1000 1500 2000 2500 3000 3500 4000
Zinc(ppm)
Barium (ppm)
WTC Dust SamplesWTC Dust Samples
Concentration of Ba vs ZnConcentration of Ba vs Zn
Including Girder Coatings
Girder Coatings
0
500
1000
1500
2000
2500
3000
0 500 1000 1500 2000 2500 3000 3500
Zinc(ppm)
Strontium (ppm)
WTC Dust SamplesWTC Dust Samples
Concentration of Sr vs ZnConcentration of Sr vs Zn
Not Including Girder Coatings
43. Ground Zero 31
The Trace Elements
In addition, in spent nuclear fuel rods, Strontium is found as Strontium
oxide (SrO) - the Strontium produced by the nuclear fission explosion
under the Twin Towers will certainly have been oxidised to SrO by the
heat. (The Barium and Zinc will also have been present as BaO and
ZnO). SrO is extremely soluble in water, so some of the Strontium
concentration results obtained may have been distorted by the rain
which fell on New York a few days after the towers were destroyed.
Figure 8 shows that there is a very strong linear relationship between
the levels of Zinc and Barium found at the WTC site. This may indicate
that a closely related nuclear sub-process gave rise to them, which
produced 3 times as much Zinc as Barium by weight.
If so, that would be a very unusual nuclear event.
There is a lesser known nuclear process that could perhaps account for
this, which would be indicative of very high energies indeed. This
process is known as Ternary Fission.
Ternary Fission
In Ternary Fission, an atom of uranium splits not into two atoms but into
three atoms. One of the well known by-products of atomic bombs is
Carbon 14 and it is known that Carbon 14 is also a ternary fission
product of nuclear reactors. The power loading in a reactor has to be
high to produce ternary fission, in other words we need a lot of energy to
split uranium into three pieces instead of two. Nuclear explosions would
certainly produce ternary fission - maybe even quaternary fission and
even further levels of "atom smashing".
What would be the other two nuclei or fission fragments produced if one
of the three is Carbon 14?
The following process would account for this:
(EQ 6)
In the first step, Uranium fissions into Radon, the heaviest of the inert or
noble gases plus Carbon 14 plus a large burst of excess neutrons. We
have seen that Uranium "likes" to use the noble gas pathways, so the
production of Radon and therefore the complementary fission fragment
Carbon 14 must occur, accounting for the Carbon 14 produced by
nuclear bombs.
In the second step, the Radon further fissions into Barium and Zinc with
a further large release of neutrons.
This process would certainly partially account for the high levels of Zinc
detected, in close correlation to Barium. Other interrelated processes
must also have been at work to produce almost exactly three times the
92
235
U +x0
1
n→ 86
222
Rn + 6
14
C +y0
1
n
86
222
Rn→30
65
Zn + 56
140
Ba +z0
1
n
44. 32 Ground Zero
Evidence of Radioactive Fallout
concentration of Zinc to Barium. This might lead into classified domains
of nuclear weapons engineering and testing but one conclusion can be
drawn: the high levels of Zinc indicate that the WTC nuclear explosions
might have had characteristics akin to a neutron bomb.
Girder Coatings
It is also very interesting that the concentration of Zinc in the indoor and
outdoor dust samples is over 1000 ppm but an order of magnitude lower
than that in the girder coating samples, where only 50 - 100ppm of Zinc
was found. Whatever caused the elevated levels of Zinc in the dust, did
not penetrate into the girder insulation coatings.
The Barium and particularly Strontium levels in the girder coatings are
also lower than in the dust but still fairly high, comparable to their levels
in the dust. So this discrepancy between Barium and Zinc in the girder
coatings, along with WTC01-16, suggests that there was not just one
direct process at work for the generation of Zn and Ba but a number of
parallel processes - as one would expect from the different fission
pathways that occur.
Very interestingly, the levels of further fission daughter nuclei of Barium
and Strontium such as Cerium, Yttrium and Lanthanum are all an order
of magnitude higher in the girder coatings than in the dust.
So we have an inverse relationship between the levels of Zinc, Barium
and Strontium and the levels of further decay nuclei in the girder
coatings.
This may indicate that fission products (Ba, Sr) were initially forced into
the girder coatings by the proximate force of the blast. These fission
products had partially decayed into Ce, La and Y by the time the
samples were collected but no new Ba or Sr had been deposited in the
meantime. The girder coatings therefore trapped high levels of Ce, La
and Y but some of the oxides of these elements in the dust exposed to
the weather was leached out by the rain. However, in the dust itself,
spread out across Manhattan, more Ba/Sr/Zn was still being deposited
from the decay of the heavy radioactive inert gases present and from
new fission products being continually generated under the site.
Sodium and Potassium
Now we will look at Sodium and Potassium. These are not rare
elements as such and the USGS classified them as "Major Elements"
due to the high levels found. However, the variations in concentration of
these two elements at the different sampling locations is very revealing
and we have compared them to Zinc in the following analysis.
In the following graph, we show the concentration of Potassium, Sodium
and Zinc at each sampling location.
This shows that (apart from the very high peak in Sodium levels for one
of the indoor dust samples) the Sodium and Potassium concentrations
both display this now characteristic peak at location WTC 01-16.
45. Ground Zero 33
The Trace Elements
Sodium has the same peak as Zinc at WTC 01-02 and like Zinc, falls to
a minimum in the girder coatings - far below the concentrations found in
the dust.
Potassium is very similar except its concentration was not a peak at
WTC 01-02 but somewhat lower than the next location, WTC 01-03.
FIGURE 9
There are clear correlations and relationships here which show that the
Potassium and Sodium concentrations did not arise at random. If they
are products of radioactive decay, where did they come from?
Remember that Strontium is produced by a fission pathway that
proceeds through the Noble Gas Krypton and then the Alkali Metal
Rubidium. Similarly, Barium is produced through Xenon and the Alkali
Metal Caesium. We know that Uranium fission favours these pathways
through the Noble Gases - we will see later proof that Neon was
produced along with the balancing Lead - we would also expect Argon.
Just as radioactive isotopes of Krypton and Xenon decay by beta
particle emission to produce Rubidium and Caesium, radioactive
isotopes of Neon and Argon also decay by beta emission to produce
Sodium and Potassium. We would indeed expect to find anomalous
levels of these elements present - what was found is again consistent
with the occurrence of nuclear fission.
If we plot [Zn] against [Na] and [K] in rank order, we obtain the following:
WTC01-02
WTC01-03
WTC01-14
WTC01-15
WTC01-16
WTC01-21
WTC01-22
WTC01-25
WTC01-27
WTC01-28
WTC01-20
WTC01-36
WTC01-08
WTC01-09
75
2075
4075
6075
8075
10075
12075partspermillion Zn ppm
Na ppm
K ppm
WTC Dust SamplesWTC Dust Samples
Concentration of Zn, Na and KConcentration of Zn, Na and K
Source: USGS (Including Girder Coatings)
46. 34 Ground Zero
Evidence of Radioactive Fallout
FIGURE 10
There is a very strong correlation between [Zn] and [K].
Between [Zn] and [Na] there almost appear to be two relationships. On
the one hand, as the concentration of Zinc increases, we see a linear
increase in the level of Sodium, but on the other as the level of Zinc
approaches 1500ppm, the concentration of Sodium takes another route
to shoot up past 8000ppm to over 11,000ppm in one of the indoor dust
samples. Is there a way of accounting for this?
Yes there is. Potassium has 5 radioactive isotopes, which all decay in a
similar timescale, i.e. very quickly in a matter of hours or minutes. 4 of
them decay by beta emission and only one by positron emission - which
means the majority of the Potassium will transmute into Calcium which
in turn will change into Scandium and Titanium. This is generally going
towards Zinc and we will see later the strong correlation between
Titanium and Zinc. (We could have equally used Titanium here in
comparison to Sodium and Potassium, but we wanted to show the clear
relationship with an element classified by the USGS as a trace element,
since Titanium was classified as a "Major Element" by the USGS).
However, Sodium has only two radioactive isotopes; one decays by
beta emission with a long 15 year half life to form Magnesium,
Aluminium etc. while the other decays by positron emission (back to
Neon) with a 2.6 year half life. This means that as the concentration of
this Sodium isotope increases, it will anti-correlate with heavier
elements such as Titanium, Zinc etc. - it is decaying back towards Neon
and lighter elements while the other Sodium isotope, decaying much
more slowly and therefore having relatively less impact on the
production of its heavier element daughter products, will correlate with
the occurrence of heavier elements.
0
2000
4000
6000
8000
10000
12000
0 500 1000 1500 2000 2500 3000
Na,K(ppm)
Zinc (ppm)
Na ppm
K ppm
WTC Dust SamplesWTC Dust Samples
Concentration of Zn vs Na and KConcentration of Zn vs Na and K
(Including Girder Coatings)
47. Ground Zero 35
The Trace Elements
This is exactly what we see in Figure 10 - there appear to be two
Sodiums, one that correlates with Zinc (heavier elements) and one that
goes towards inverse proportionality - [Zn] actually decreases as [Na]
increases. This fits the behaviour we would expect from the two Sodium
isotopes.
Other Trace Elements
We now examine the other Top 10 Trace Elements, many of which are
well known decay products of the nuclear fission pathways. Their
presence in such high quantities in the WTC dust cannot be explained
by any other mechanism.
Cerium
In looking at Table 4 of the trace elements, we see peaks in the
concentration of Cerium at WTC 01-02 and 01-16, i.e. at the same two
locations as the Barium/Strontium peaks.
Cerium is a very rare element - yet over 100ppm was discovered at
WTC 01-02 and 01-16, which is again an extraordinarily high level for
that element. Cerium is the second daughter product of Barium in that
disintegration pathway, coming after Lanthanum
Figure 11 shows the concentration of Barium plotted against Cerium.
FIGURE 11
• The Coefficient of Correlation between Barium and Cerium is 0.84.
The data points in fact fit a cubic relationship, in which the concentration
of Cerium is approximately equal to 10 times the cube root of the Barium
concentration.
0
20
40
60
80
100
120
140
0 500 1000 1500 2000 2500 3000 3500 4000
Cerium(ppm)
Barium (ppm)
WTC Dust SamplesWTC Dust Samples
Concentration of Ba vs CeConcentration of Ba vs Ce
Not Including Girder Coatings
48. 36 Ground Zero
Evidence of Radioactive Fallout
(EQ 7)
We show the data again below with the actual Barium concentration
now also plotted against the Cerium value calculated by the above
model equation and a best fit curve to the actual data. The correlation
between the actual Cerium values and the values predicted by this
model is clearly of the same order.
FIGURE 12
What does this tell us? Since Cerium is the second daughter product of
decay of Barium, we would expect the amount of Cerium present to
increase linearly with the concentration of Barium. The first part of the
curve, for [Ba] less than 1000ppm is more or less linear as expected.
Why then does the relative concentration of Cerium fall at WTC-16
where [Ba] was so high, at 3670ppm? This shows that at that location,
new Barium was still being actively produced, with intense nuclear
fission and decay of intermediate products still ongoing. There was not
yet enough time for the Barium being produced to decay into its
daughter products. The concentration of Uranium at this location was
not the highest found though, which supports what we conjectured
before: the Barium and Zinc was not just produced by direct fission of
Uranium but by Ternary fission and other intermediate decay steps from
the other elements that were produced. Another factor that has to be
taken into consideration is the presence of different isotopes of the
fission products (Barium, Strontium) - we will discuss this later.
Since Cerium is the second daughter product of Barium, this high
correlation between the Barium and Cerium concentrations in the
expected exponential relationship is further evidence that Nuclear
Fission has taken place.
Ce[ ] = 10 • Ba[ ]3
0
20
40
60
80
100
120
140
160
0 500 1000 1500 2000 2500 3000 3500 4000
Cerium(ppm)
Barium (ppm)
[Ce] Actual
10*CubeRt[Ba]
WTC Dust SamplesWTC Dust Samples
[Ba] vs [Ce] with Best Fit Curve[Ba] vs [Ce] with Best Fit Curve
Best Fit Curve
to [Ce] actual
49. Ground Zero 37
The Trace Elements
Lanthanum
Lanthanum is the next element in the disintegration pathway of Barium,
situated between Barium and Cerium.
The concentration of Barium versus Lanthanum is plotted below.
FIGURE 13
The graph is almost identical in form to the relationship between Barium
and Cerium. A similar inverse exponential (cubic) relationship is clearly
visible. In this case, [La] is approximately equal to 5 times the cube root
of [Ba].
Lanthanum has a much shorter half life than Cerium: most of its
isotopes have a half life of only a few hours whereas β-
decay by Cerium
is measured in half life periods of a month to 10 months. Cerium’s β+
decay going back to Lanthanum occurs more quickly but Lanthanum’s
β+ decay going back to Barium occurs in a similar timescale to that - a
few hours - so we are left with the net effect of Lanthanum’s β-
decay
being much quicker than that of Cerium, so the concentration of Cerium
remaining was higher than that of Lanthanum.
Cerium versus Lanthanum
Next we show the relationship between Lanthanum and Cerium. We
have an almost perfect linear correlation between the two. This graph
(Figure 14) confirms our two cubic models, which predict that the
concentration of Lanthanum produced should be half the concentration
of Cerium.
Therefore [Ce] = 2 x [La].
Given that Cerium follows Lanthanum in the fission pathway, that both
elements are extremely rare except in nuclear events and the
0
10
20
30
40
50
60
70
0 500 1000 1500 2000 2500 3000 3500 4000
Lanthanum(ppm)
Barium (ppm)
WTC Dust SamplesWTC Dust Samples
Concentration of Ba vs LaConcentration of Ba vs La
Not Including Girder Coatings
50. 38 Ground Zero
Evidence of Radioactive Fallout
concentration of Lanthanum is almost perfectly correlated with the
concentration of Cerium, the occurrence of Nuclear Fission of Uranium
is the only possible explanation.
FIGURE 14
We show this data again below, including additionally the two very high
Girder Coating values.
FIGURE 15
0
10
20
30
40
50
60
70
0 20 40 60 80 100 120 140
Lanthanum(ppm)
Cerium (ppm)
WTC Dust SamplesWTC Dust Samples
Concentration of Ce vs LaConcentration of Ce vs La
Not Including Girder Coating Samples
0
20
40
60
80
100
120
140
160
180
0 50 100 150 200 250 300 350 400
Lanthanum(ppm)
Cerium (ppm)
WTC Dust SamplesWTC Dust Samples
Concentration of Ce vs LaConcentration of Ce vs La
Including Girder Coating Samples
51. Ground Zero 39
The Trace Elements
These relationships in the data provide further overwhelming proof that
Nuclear Fission of Uranium has taken place, with characteristic
statistical relationships between the quantities of the different elements
present that are indicative of the fission pathways of Uranium.
Yttrium
Yttrium is also a very rare element and should not be present in dust
from a collapsed office building. Yttrium is the next decay element after
Strontium. If we plot the concentration of Strontium against Yttrium, we
obtain Figure 16.
FIGURE 16
Strontium 90 has a much longer half life (28.78 years) than most Barium
isotopes so we would not expect to see as high a concentration of
Strontium’s daughter products as those that are produced from Barium.
This is in fact what we see - the concentration of Cerium (next daughter
product to Barium) is higher than Yttrium, the next daughter product to
Strontium.
Another factor is that different isotopes of these daughter elements are
produced with different half lives and, as before, they decay by different
mechanisms - electron (beta particle) emission and electron capture
(EC). The USGS of course have not analysed which isotopes and what
proportions of those isotopes were present for each element - Barium,
Strontium, Zinc, Cerium etc.
Although Sr 90 is the main Strontium isotope produced which decays by
β-
emission, some Sr 82, 83 and 85 is produced as well which decay by
EC into Rubidium. Different Yttrium isotopes also decay by β-
emission
and EC both into Zirconium and back into Strontium.
Examining Figure 16, we see what may look like two separate and
distinct relationships between Yttrium and Strontium. One set of points
seems to indicate a linear increasing relationship between the Strontium
0
10
20
30
40
50
60
70
0 500 1000 1500 2000 2500 3000 3500
Yttrium(ppm)
Strontium (ppm)
WTC Dust SamplesWTC Dust Samples
Concentration of Sr vs YConcentration of Sr vs Y
Not Including Girder Coating Samples
52. 40 Ground Zero
Evidence of Radioactive Fallout
and Yttrium concentration, while another set shows [Sr] reaching a
maximum and decreasing again as [Y] increases (ignoring the outlier
with >3000ppm [Sr]). We have seen this pattern with Sodium and we will
see it again: the relationship where [Sr] decreases as [Y] increases can
be explained by the influence of Yttrium isotopes decaying by electron
emission into elements of higher atomic number - i.e. Zirconium while
the other line is formed by those Yttrium isotopes that decay by EC back
into Strontium - boosting the amount of Strontium present.
Also, if there was a significant time difference between the analysis of
the samples, it would affect the comparison of results because Yttrium
90 has a half life of only 2.67 days while Y91 has a half life of 58.5 days.
We know that some samples were collected on the evening of the 17th
September and some 24 hours later on the 18th September, which may
have had an effect on Y90 levels in the two sets of dust samples by
removing them from the influence of the nuclear processes continuing in
the environment. A time delay in the analyses of the samples would also
have a significant effect. 24 hours is 3/8ths of the half life period, so
some 23% of the Y90 present in the dust will decay away1
in this time.
Any Strontium 89 present would not be greatly affected by a delay of 1
day since its half life is 52 days, so the corresponding [Sr] made up of
[Sr90] + [Sr89] would not show a noticeable difference; [Y] made up of
[Y89] + [Y90] would show a noticeable difference.
This may explain why in Figure 16 in the central cluster some of the
Yttrium concentrations were lower than others for a similar Strontium
concentration - maybe there was a significant delay between the times
the analyses were performed.
Overall, we can see that there is a marked correlation between [Sr] and
[Y], with one outlier - WTC 01-16 where the concentration of Strontium
(and Barium) peaked. This was as we have said evidently a location
where energetic nuclear processes were still ongoing. New Strontium
was being actively produced and therefore the concentration of Yttrium
was relatively lower.
1. From N/No = e-λt
53. Ground Zero 41
The Trace Elements
Chromium
The presence of Chromium is also a tell tale signature of a nuclear
explosion. Its concentration is shown plotted against Zinc and Vanadium
below.
FIGURE 17 CHROMIUM vs ZINC AND VANADIUM CONCENTRATION
There is a strong correlation between the Zinc and Chromium
concentration. The Coefficient of Correlation is 0.89.
There is also an indication of a strong correlation between Chromium
and Vanadium with 6 points lying on an almost perfect exponential
curve, with one outlier (WTC 01-03) of 42.5ppm where the Vanadium
concentration reached its highest level.
Figure 18 below plots [Cr] against [Ni]. There is a strong cluster in the
two concentrations showing a very homogenous distribution in these
elements.
FIGURE 18 CHROMIUM vs NICKEL
0
5
10
15
20
25
30
35
40
45
0 50 100 150 200 250
Vanadium(ppm) Chromium (ppm)
WTC Dust SamplesWTC Dust Samples
Concentration of Cr vs VConcentration of Cr vs V
Outlier at WTC 01-03
0
500
1000
1500
2000
2500
3000
0 50 100 150 200 250
Zinc(ppm)
Chromium (ppm)
WTC Dust SamplesWTC Dust Samples
Concentration of Cr vs ZnConcentration of Cr vs Zn
0
10
20
30
40
50
60
70
80
90
0 50 100 150 200 250
Nickel(ppm)
Chromium (ppm)
WTC Dust SamplesWTC Dust Samples
Concentration of Cr vs NiConcentration of Cr vs Ni
54. 42 Ground Zero
Evidence of Radioactive Fallout
Copper
This element is also indicative. If we plot the concentration of Copper
against Zinc and Nickel, we obtain the graphs in Figure 19.
The concentration of Nickel was almost the same everywhere, except
for the peak in [Ni] of 88ppm matched by the [Cu] peak of 450ppm.
FIGURE 19
The Copper - Zinc relationship is very interesting, showing in fact two
distinct relationships again depending on isotopic composition. There
are two radioactive isotopes of Copper (Cu64 and Cu67) with short half
lives of 12.7 hours and 2.58 days respectively which decay into Zinc
isotopes. Two other isotopes 60
Cu and 61
Cu decay the other way by
positron (β+
) emission into Nickel - and in fact 64
Cu goes both ways, into
both Nickel and Zinc. This would explain why there strongly appear to
be two Cu-Zn relationships.
The decay of radioactive Copper by beta particle (β-
) emission into Zinc
would have been another source of the Zinc found in the WTC dust.
Titanium and Manganese
Titanium and Manganese are not present in trace quantities but in quite
high concentrations and as we have discussed earlier, even if Titanium
had been included as a pigment (TiO) in some of the concrete when it
was made this would be far from sufficient to account for the high levels
of Titanium found in the dust. However, it is interesting that there is a
peak in Titanium concentration of 3900ppm at location WTC 01-02,
where the Zinc reached its maximum of 2990ppm and many other
elements also peaked. Manganese also peaks with 1500ppm at
WTC01-02 and WTC 01-25, which correlates with the two Zinc peaks of
2990ppm and 1900ppm.
0
500
1000
1500
2000
2500
3000
0 50 100 150 200 250 300 350 400 450
Zinc(ppm)
Copper (ppm)
WTC Dust SamplesWTC Dust Samples
Concentration of Cu vs ZnConcentration of Cu vs Zn
0
10
20
30
40
50
60
70
80
90
0 50 100 150 200 250 300 350 400 450
Nickel(ppm)
Copper (ppm)
WTC Dust SamplesWTC Dust Samples
Concentration of Cu vs NiConcentration of Cu vs Ni
55. Ground Zero 43
The Trace Elements
FIGURE 20
Figure 20 shows that once again, the high levels of Titanium and
Manganese detected were not naturally occurring: the correlations with
each other are too marked.
The main pathway we would expect for the production of Titanium would
be by beta decay of Argon, through Potassium, Calcium and Scandium.
Another possible mechanism for the production of the Titanium would
be by ternary fission of plutonium. Ordinary thermal nuclear reactors
always produce plutonium when the non-fissile U238 in the fuel (which
is the majority of the Uranium in the reactor) absorbs neutrons: this
produces Uranium 239 which then undergoes beta decay into
Plutonium, with atomic number 94.
Plutonium would then undergo ternary fission into Xenon, Argon and
Titanium.
Another possibility is that the reactors under the Twin Towers were Fast
reactors or Fast Fission Breeder Reactors. In this type of nuclear
reactor, the fuel is made of a central plutonium core surrounded by
Uranium 238. As the central plutonium core is fissioned to produce
energy, the U238 jacket also captures neutrons and is converted into yet
more Plutonium: the reactor "breeds" more fuel than it uses.
One "advantage" of this reactor type is that since the plutonium can only
be fissioned by fast neutrons, no moderator is required to slow them
down to produce slow neutrons, as required in an ordinary reactor. This
means the size of the fast breeder reactor is much smaller. This may
well have been a significant "advantage" for use in a clandestine
underground installation under the Twin Towers of the WTC.
WTC01-02
WTC01-03
WTC01-14
WTC01-15
WTC01-16
WTC01-21
WTC01-22
WTC01-25
WTC01-27
WTC01-28
WTC01-20
WTC01-36
WTC01-08
WTC01-09
75
575
1075
1575
2075
2575
3075
3575
4075
partspermillion
Ti ppm
Zinc ppm
Mn ppm
WTC Dust SamplesWTC Dust Samples
Concentration of Ti, Zn, MnConcentration of Ti, Zn, Mn
Source: USGS
56. 44 Ground Zero
Evidence of Radioactive Fallout
Uranium could also undergo ternary fission into Xenon, Argon and
Calcium - with the Calcium then undergoing β-
decay (which is its
primary mode) into Titanium: in fact it would also form from normal
binary fission of Uranium into Argon and Tungsten, with the Argon then
decaying into Potassium, Calcium, Scandium and Titanium as we said
before.
If we look at the Periodic Table of Elements, starting with Titanium at
atomic number 22, we have the sequence Ti V Cr Mn Fe Co Ni Cu Zn.
FIGURE 21 EXTRACT FROM PERIODIC TABLE
The transmutation of Titanium into the succeeding elements would
occur by emission of beta particles, as shown in Figure 2 for Bromine
and Xenon. We see many of the elements found in anomalous
quantities in this part of the Periodic Table, where the radioactive
isotopes of these "transition elements" as they are called interact in
complex decay patterns.
The concentration of Titanium versus Zinc and Chromium is shown
below in Figure 22.
FIGURE 22
Again, there is a distinct correlation, with the concentration of all three
metals peaking at location WTC 01-02, which as we have seen was a
peak for many of the metals found, even common ones such as iron and
aluminium.
The concentration of Manganese plotted against Zinc, Lead and
Titanium is shown in the following graphs.
Ti V Cr Mn Fe Co Ni Cu Zn
22 3029282726252423
0
50
100
150
200
250
0 50 100 150 200 250 300 350 400
Chromium(ppm)
Titanium (ppm/10)
WTC Dust SamplesWTC Dust Samples
Concentration of Ti vs CrConcentration of Ti vs Cr
Not Including Girder Coating or Indoor Samples
0
500
1000
1500
2000
2500
3000
0 500 1000 1500 2000 2500 3000 3500 4000
Zinc(ppm)
Titanium (ppm)
WTC Dust SamplesWTC Dust Samples
Concentration of Ti vs ZnConcentration of Ti vs Zn
Not Including Girder Coating or Indoor Samples
57. Ground Zero 45
The Trace Elements
FIGURE 23
In all three cases we see an absolutely identical pattern. First, a
decrease in [Zn], [Pb] and [Ti] as [Mn] increases, then at 1200ppm of
Manganese (0.12%) there is an extraordinary increase in the quantity of
Zinc, Lead and Titanium present in the dust. Finally, an asymptotic
levelling off for even higher levels of [Mn].
It is therefore very indicative indeed that we have these complex
correlations and relationships between these different metals. Data of
this type has probably never before seen the light of day, revealing the
complex fission events and processes that take place in an energetic
nuclear explosion. We can surmise that in the confined space of the
nuclear blast, indeed not only ternary but quaternary and further levels
of fission have taken place, with daughter nuclei not just decaying by
ordinary alpha, beta or gamma radiation emission but literally being
fissioned again by the intense neutron radiation, to create a complete
smorgasbord of the Periodic Table.
0
100
200
300
400
500
600
700
800
0 200 400 600 800 1000 1200 1400 1600
Lead(ppm)
Manganese (ppm)
WTC Dust SamplesWTC Dust Samples
Concentration of Mn vs PbConcentration of Mn vs Pb
Not Including Girder Coating Samples
0
500
1000
1500
2000
2500
3000
0 200 400 600 800 1000 1200 1400 1600
Zinc(ppm)
Manganese (ppm)
WTC Dust SamplesWTC Dust Samples
Concentration of Mn vs ZnConcentration of Mn vs Zn
Not Including Girder Coating Samples
0
500
1000
1500
2000
2500
3000
3500
4000
0 200 400 600 800 1000 1200 1400 1600
Titanium(ppm)
Manganese (ppm)
WTC Dust SamplesWTC Dust Samples
Concentration of Ti vs MnConcentration of Ti vs Mn
Not Including Girder Coatings
58. 46 Ground Zero
Evidence of Radioactive Fallout
Lead
Lead is yet another product of nuclear fission. We would not expect to
find lead piping in a building of 1970s vintage, certainly not in quantities
sufficient to produce the high concentrations of Lead that were detected.
One of the frequent pathways for nuclear fission of Uranium is to a
Noble Gas and the balancing element, which together add up to the 92
protons in Uranium. This is what occurs with Barium and Strontium,
where the balancing Noble Gas is Krypton and Xenon. Lead has an
atomic number of 82. The balancing element with an atomic number of
10 is Neon - a noble gas. Radioactive Lead is a well known product from
nuclear fission and we would not be surprised to find it in the fallout.
The nuclear equation for fission of Uranium to Lead follows a preferred
Noble Gas pathway:
(EQ 8)
There were two spikes measured in the concentration of Lead of over
700ppm, at WTC01-02 and WTC 01-25; these two locations also had
the two highest concentrations of Zinc (2990ppm and 1910ppm),
Chromium (224ppm and 134ppm) and Manganese (1500ppm and
1500ppm).
FIGURE 24
By inspection, we can see that there is a power relationship between the
concentration of Lead and Zinc and perhaps a linear relationship
between [Pb] and [Cr]. Referring back to Figure 23, we know that there
must be a close relationship between [Pb] and [Zn] because they both
have an identical relationship to [Mn].
In Figure 25 we have plotted Lead against Copper and shown Copper
against Zinc again for comparison (already shown in Figure 19 on
page 42).
92
235
U +0
1
n→10
24
Ne + 82
210
Pb +20
1
n
0
500
1000
1500
2000
2500
3000
0 100 200 300 400 500 600 700 800
Zinc(ppm)
Lead (ppm)
WTC Dust SamplesWTC Dust Samples
Concentration of Pb vs ZnConcentration of Pb vs Zn
Not Including Girder Coating Samples
0
50
100
150
200
250
0 100 200 300 400 500 600 700 800
Chromium(ppm)
Lead (ppm)
WTC Dust SamplesWTC Dust Samples
Concentration of Pb vs CrConcentration of Pb vs Cr
59. Ground Zero 47
The Trace Elements
FIGURE 25
We can see clearly that Zinc and Lead both have exactly the same
relationship to Copper.
These correlations show that the presence of the Lead is also indicative
that a nuclear explosion occurred.
We earlier commented that Copper transmutes into Zinc by beta decay.
If we plot the concentration of Zinc, Lead and Copper together by
location, the correlations can be seen in a different way. Particularly
interesting is the dramatic fall in concentration of all these elements in
the girder coatings.
FIGURE 26
0
50
100
150
200
250
300
350
400
450
0 100 200 300 400 500 600 700 800
Copper(ppm)
Lead (ppm)
WTC Dust SamplesWTC Dust Samples
Concentration of Pb vs CuConcentration of Pb vs Cu
0
50
100
150
200
250
300
350
400
450
0 500 1000 1500 2000 2500 3000
Copper(ppm)
Zinc (ppm)
WTC Dust SamplesWTC Dust Samples
Concentration of Zn vs CuConcentration of Zn vs Cu
WTC01-02
WTC01-03
WTC01-14
WTC01-15
WTC01-16
WTC01-21
WTC01-22
WTC01-25
WTC01-27
WTC01-28
WTC01-20
WTC01-36
WTC01-08
WTC01-09
0
100
200
300
400
500
600
700
800
partspermillion
Zinc/10 ppm
Lead ppm
Copper ppm
WTC Dust SamplesWTC Dust Samples
Concentration of Zn/10, Pb, CuConcentration of Zn/10, Pb, Cu
Source: USGS
60. 48 Ground Zero
Evidence of Radioactive Fallout
In Figure 26, [Zn] has been divided by a factor of 10, to avoid losing all
the detail in the scaling if the y axis instead went up to 3000ppm. The
variation in [Pb] is matched by the variation in [Zn] almost perfectly
across all sampling locations, including the Indoor and Girder Coating
samples.
The concentration of Copper, [Cu], follows that of [Zn] with one distinct
exception at WTC 01-15. As we have already seen in Figure 19, there
seem to be two Cu - Zn relationships. If some of the Zinc was being
formed by beta decay of Copper, then the high [Cu] at WTC 01-15 could
reduce [Zn], since the formation of Zinc by that decay pathway would be
retarded by material being held up at the Copper stage, before decaying
on to Zinc. Therefore this graph along with the lower curve in Figure 19
(right hand graph) does tend to confirm that some of the Zinc was
indeed being formed by beta decay of Copper.
This would at least be a small mercy, since the Zinc isotopes formed
from Copper are stable - i.e. they are not radioactive.
61. Ground Zero 49
The Trace Elements
Antimony
Antimony is a rare toxic metal used in engineering in small quantities for
hardening other metals (e.g. in bearings). The variation in concentration
of Antimony, [Sb] found in the dust very closely mirrors the level of
Barium but then falls to practically nothing in the girder coatings.
Figure 27 shows the level of Antimony measured at each location
against the Barium concentration divided by 10.
FIGURE 27
Arranged in rank order, the data is presented as follows, both including
and not including the massive spike in concentration at WTC 01-16.
FIGURE 28
WTC01-02
WTC01-03
WTC01-14
WTC01-15
WTC01-16
WTC01-21
WTC01-22
WTC01-25
WTC01-27
WTC01-28
WTC01-20
WTC01-36
WTC01-08
WTC01-09
0
50
100
150
200
250
300
350
400
partspermillion
Ba/10 ppm
Sb ppm
WTC Dust SamplesWTC Dust Samples
Concentration of Ba/10 and SbConcentration of Ba/10 and Sb
Source: USGS
0
20
40
60
80
100
120
140
160
0 50 100 150 200 250 300 350 400
Antimony(ppm)
Barium/10 (ppm)
WTC Dust SamplesWTC Dust Samples
Concentration of Ba/10 vs SbConcentration of Ba/10 vs Sb
Including WTC 01-16
Girder Coatings
0
10
20
30
40
50
60
70
0 10 20 30 40 50 60 70 80
Antimony(ppm)
Barium/10 (ppm)
WTC Dust SamplesWTC Dust Samples
Concentration of Ba/10 vs SbConcentration of Ba/10 vs Sb
Not Including WTC 01-16
Girder Coatings
62. 50 Ground Zero
Evidence of Radioactive Fallout
Antimony has an atomic number of 51 and atomic weights ranging from
119 to 127. Barium has an atomic number of 56 with atomic weights
ranging from 128 to 140. Some radioactive Xenon isotopes could
transmute into Antimony via Iodine and Tellurium by electron capture,
whereas as we know, Barium is formed from Xenon by electron (beta
particle) emission - so we would expect a common source, isotopes of
Xenon, for both the Barium and Antimony.
(EQ 9)
The evident close correlation between Barium and Antimony in the
above graphs is therefore very logical and can be explained by the
nuclear chemistry of Equation 9.
There is also a very intriguing relationship between Antimony and
Molybdenum.
FIGURE 29
This is clearly not a random distribution - there is in fact an almost
perfect linear relationship between [Sb] and [Mo], with the usual
exception of one sample where the Antimony concentration was
exceedingly high at 148ppm: WTC 01-16 again.
The atomic number of Antimony is 51; the atomic number of
Molybdenum is 42. Together this makes 93 while Uranium has an
atomic number of 92. Tin and Molybdenum are well known fission
products. It seems very likely that some of the Uranium indeed fissioned
54
125
Xe + e-
→ 53
125
I
53
125
I + e-
→ 52
125
Te
52
125
Te + e-
→ 51
125
Sb
0
5
10
15
20
25
30
35
40
45
0 20 40 60 80 100 120 140 160
Molybdenum(ppm)
Antimony (ppm)
WTC Dust SamplesWTC Dust Samples
Concentration of Sb vs MoConcentration of Sb vs Mo
Including Girder Coatings
63. Ground Zero 51
The Trace Elements
into Tin (with atomic number 50) and Molybdenum (42) and the Tin then
decayed by beta emission into Antimony.
Again, Figure 29 is a very telling graph indeed.
The Girder Coatings
In the earlier graph (Figure 26 on page 47), [Zn], [Pb] and [Cu] are all
much lower in the Girder Coatings than in the dust, both indoor and
outdoor. Referring to Table 2, we can see that a number of other
elements also had their lowest levels in the girder coatings: Antimony,
Molybdenum, Cadmium.
On the other hand, we saw earlier that the concentration of Cerium,
Yttrium and Lanthanum are all an order of magnitude higher in the
girder insulation coatings than in the dust. In fact, in the second girder at
WTC 01-09, [Ce], [Y] and [La] at 356ppm, 243ppm and 175ppm are 6
times as high as the lowest levels recorded for these elements in the
dust, far exceeding "trace" levels. Some other elements also recorded
their highest levels in the girder coatings: Nickel in particular with
202ppm at WTC 01-08, about 10 times as high as all the other
measurements for Nickel - but then [Ni] falls back again in the second
girder coating, WTC 01-09.
This is illustrated below in Figure 30 and Figure 31. The last two data
points on the x axis at WTC 01-08 and WTC 01-09 are the two girder
coatings.
FIGURE 30
WTC01-02
WTC01-03
WTC01-14
WTC01-15
WTC01-16
WTC01-21
WTC01-22
WTC01-25
WTC01-27
WTC01-28
WTC01-20
WTC01-36
WTC01-08
WTC01-09
0
50
100
150
200
250
300
350
400
partspermillion
Ce ppm
Y ppm
La ppm
WTC Dust SamplesWTC Dust Samples
Cerium, Yttrium, LanthanumCerium, Yttrium, Lanthanum
Source: USGS
64. 52 Ground Zero
Evidence of Radioactive Fallout
FIGURE 31
Judging from the USGS map (Figure 36 on page 59), location WTC 01-
09 was the closest sampling location to the towers. It is situated about
20 metres to the west of the North Tower (WTC 1).
As we have already hypothesised, the nuclear blast may have
impregnated the girder coatings with the initial fission products Barium
and Strontium. These would then have partially decayed away so that
by the time of the analysis, high concentrations of their rare daughter
products (Ce, Y, La) were trapped in the coating.
Looking back at Figure 7 on page 29, we see that there are two places
where [Zn] is lower than [Sr] and [Ba]: at location WTC 01-16 and in the
girder coatings. The high levels of Cerium, Lanthanum and Yttrium
found in the girder coatings are also consistent with the still fairly high
Strontium and Barium levels in the girders: so why should the level of
Zinc be lower in the girders and at WTC 01-16, given that otherwise Zinc
is so closely linked to Barium?
The answer may be that Bromine, a fission fragment produced as you
will remember by the initial fission of Uranium, decays by β-
emission
into Strontium by only 3 decay steps - and we know that Strontium is
tightly coupled to Barium, since Barium is produced from the other
fission fragment Xenon (see Figure 2 on page 7) - while Zinc is
produced from the Bromine fragment the other way by β+
emission in 5
steps. Therefore depending on the isotopic mixture produced and the
half lives of all the intermediary products, when very active decay is still
ongoing in a sample which recently still had a high Uranium
concentration, we are seeing a lot of Barium and Strontium being
produced while Zinc has not yet formed: but later on (or in samples
which are not as "hot") as the Barium and Strontium decay away,
WTC01-02
WTC01-03
WTC01-14
WTC01-15
WTC01-16
WTC01-21
WTC01-22
WTC01-25
WTC01-27
WTC01-28
WTC01-20
WTC01-36
WTC01-08
WTC01-09
0
50
100
150
200
250
partspermillion
Cr ppm
Ni ppm
WTC Dust SamplesWTC Dust Samples
Concentration of Cr and NiConcentration of Cr and Ni
Source: USGS
65. Ground Zero 53
The Trace Elements
whatever pathways led to Zinc now predominate and create a high level
of Zinc in the dust.
In fact, the analysis should be done the other way around: there is very
little if any data publicly available on what mixture of fallout, fission
products, isotopes and stable end products is produced when an atomic
bomb explodes or in this case when a nuclear reactor explodes in these
conditions. The data is showing us what did happen. It will be used to
calibrate and refine predictive models.
Another intriguing fact is that the concentration of Nickel and Chromium
peaked in the first girder coating (WTC 01-08), particularly the Nickel,
but fell again in the second girder coating. This could be explained by
hypothesising that the first girder was contaminated with stainless steel,
which contains both nickel and chromium but the second girder was not.
Whatever the physical mechanisms might be which account for these
findings, the underlying mathematical correlations are self evident and
lead ineluctably to the deduction that a nuclear explosion must have
occurred to account for the presence of these elements.
66. 54 Ground Zero
Evidence of Radioactive Fallout
Uranium and Thorium
Finally we come to the detection of measurable quantities of Thorium
and Uranium in the dust from the WTC, elements which only exist in
radioactive form.
The graph below plots the concentration of Thorium and Uranium
detected at each sampling location. Again the last two locations
WTC01-08 and 01-09 are for the two girder coating samples.
FIGURE 32
The Uranium concentration follows the same pattern as Thorium,
although the graph scale does not show this markedly. [U] follows the
dip in [Th] at WTC 01-03 and 01-16 but the highest concentration of
Uranium also matches Thorium in the second girder coating, WTC 01-
09 at 7.57ppm.
7.57ppm of Uranium greatly exceeds normal trace element levels.
The second girder contained 30.7ppm of Thorium, 6 times as high as
the lowest level of that element detected.
Thorium is a radioactive element formed from Uranium by α decay. It is
very rare and should not be present in building rubble at all.
The Thorium picture also mirrors that found for Yttrium (see Figure 30).
The concentration of both elements dips at WTC 01-03 and 01-16
(where so many other elements peaked) but in the two girder coatings
(WTC01-08, 01-09) is nearly an order of magnitude higher than in the
dust samples.
WTC01-02
WTC01-03
WTC01-14
WTC01-15
WTC01-16
WTC01-21
WTC01-22
WTC01-25
WTC01-27
WTC01-28
WTC01-20
WTC01-36
WTC01-08
WTC01-09
0
5
10
15
20
25
30
35
partspermillion
Th ppm
U ppm
WTC Dust SamplesWTC Dust Samples
Concentration of Th and UConcentration of Th and U
Source: USGS
67. Ground Zero 55
The Trace Elements
[Th] is plotted against [U] below.
FIGURE 33
The high correlation between [Th] and [U] is self evident.
The presence of these two elements in such high concentrations
(particularly in the two girder coatings at WTC 01-08 and 01-09) in such
a close mathematical relationship is further incontrovertible evidence
that a nuclear event has taken place.
As we said earlier, Thorium is formed from Uranium by α decay. An α
particle is the same as a Helium nucleus, so this means we have one of
the favoured fission pathways: Uranium fissioning into a Noble Gas and
the balancing element, in this case Helium and Thorium:
(EQ 10)
If the Helium formed follows the same pattern as Krypton and Xenon
(which decay by beta emission through Strontium and Barium), then we
would expect to find Lithium and Beryllium, the next elements after
Helium in the Periodic Table, in quantities that correlate with Thorium.
The USGS did measure the Lithium concentration in the dust: [Th] is
plotted against [Li] below in Figure 34, both including and excluding the
two girder coating samples.
0
1
2
3
4
5
6
7
8
0 5 10 15 20 25 30 35
Uranium(ppm)
Thorium (ppm)
WTC Dust SamplesWTC Dust Samples
Concentration of Th vs UConcentration of Th vs U
Including Girder Coatings
92
235
U+0
1
n→2
4
He+ 90
232
Th
68. 56 Ground Zero
Evidence of Radioactive Fallout
FIGURE 34
The graph of [Th] vs [Li] including the girder coatings, has exactly the
same form as Figure 33, showing [Th] vs [U] also including the girder
coatings. Without the two girder coatings, the correlation of [Th] to [Li] in
the dust is completely linear.
We therefore have compelling evidence that this fission pathway of
Uranium to Thorium and Helium, with subsequent decay of the Helium
into Lithium, has indeed taken place.
Conclusion
It is out of the question that all these correlations which are the signature
of a nuclear explosion could have occurred by chance.
The presence of rare trace elements such as Cerium, Yttrium and
Lanthanum is enough to raise eyebrows in themselves, let alone in
quantities of 50ppm to well over 100ppm. When the quantities then vary
widely from place to place but still correlate with each other according
to the relationships expected from nuclear fission, it is beyond all
doubt that the variations in concentration are due to that same
common process of nuclear fission.
When we find Barium and Strontium present, in absolutely astronomical
concentrations of over 400ppm to over 3000ppm, varying from place to
place but varying in lockstep and according to known nuclear
relationships - the implications are of the utmost seriousness.
The presence of Thorium and Uranium correlated to each other by a
clear mathematical power relationship - and to other radionucleide
daughter products - leaves nothing more to be said.
This type of data has probably never been available to the public before.
It is an unprecedented insight into the action of a nuclear device.
Nuclear weapon scientists around the world will have seized this data to
analyse it and determine exactly what type of device produced it.
0
5
10
15
20
25
30
0 2 4 6 8 10 12
Lithium(ppm)
Thorium (ppm)
WTC Dust SamplesWTC Dust Samples
Concentration of Th vs LiConcentration of Th vs Li
Not including Girder Coatings
0
5
10
15
20
25
30
35
40
0 5 10 15 20 25 30 35
Lithium(ppm)
Thorium (ppm)
WTC Dust SamplesWTC Dust Samples
Concentration of Th vs LiConcentration of Th vs Li
Including Girder Coatings