The automatic license plate recognition(alpr)

Abstract Every country uses their own way of designing and allocating number plates to their country vehicles. This license number plate is then used by various government offices for their respective regular administrative task like- traffic police tracking the people who are violating the traffic rules, to identify the theft cars, in toll collection and parking allocation management etc. In India all motorized vehicle are assigned unique numbers. These numbers are assigned to the vehicles by district-level Regional Transport Office (RTO). In India the license plates must be kept in both front and back of the vehicle. These plates in general are easily readable by human due to their high level of intelligence on the contrary; it becomes an extremely difficult task for the computers to do the same. Many attributes like illumination, blur, background color, foreground color etc. will pose a problem. Index Terms: Automatic license plate recognition (ALPR) system, proposed methodology, reference

Recommended
Recommended
More Related Content
What's hot
What's hot (20)
Viewers also liked
Viewers also liked (10)
Similar to The automatic license plate recognition(alpr)
Similar to The automatic license plate recognition(alpr) (20)
More from eSAT Journals
More from eSAT Journals (20)
Recently uploaded
Recently uploaded (20)
The automatic license plate recognition(alpr)
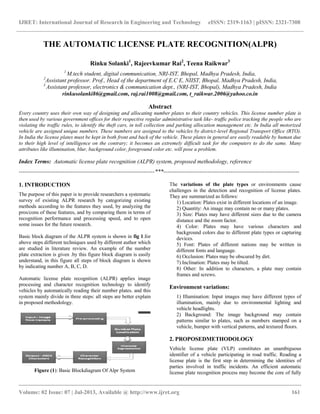
- 1. IJRET: International Journal of Research in Engineering and Technology eISSN: 2319-1163 | pISSN: 2321-7308 __________________________________________________________________________________________ Volume: 02 Issue: 07 | Jul-2013, Available @ http://www.ijret.org 161 THE AUTOMATIC LICENSE PLATE RECOGNITION(ALPR) Rinku Solanki1 , Rajeevkumar Rai2 , Teena Raikwar3 1 M.tech student, digital communication, NRI-IST, Bhopal, Madhya Pradesh, India, 2 Assistant professor. Prof., Head of the department of E.C E, NIIST, Bhopal, Madhya Pradesh, India, 3 Assistant professor, electronics & communication dept., (NRI-IST, Bhopal), Madhya Pradesh, India rinkusolanki86@gmail.com, raj.rai1008@gmail.com, t_raikwar.2006@yahoo.co.in Abstract Every country uses their own way of designing and allocating number plates to their country vehicles. This license number plate is then used by various government offices for their respective regular administrative task like- traffic police tracking the people who are violating the traffic rules, to identify the theft cars, in toll collection and parking allocation management etc. In India all motorized vehicle are assigned unique numbers. These numbers are assigned to the vehicles by district-level Regional Transport Office (RTO). In India the license plates must be kept in both front and back of the vehicle. These plates in general are easily readable by human due to their high level of intelligence on the contrary; it becomes an extremely difficult task for the computers to do the same. Many attributes like illumination, blur, background color, foreground color etc. will pose a problem. Index Terms: Automatic license plate recognition (ALPR) system, proposed methodology, reference -----------------------------------------------------------------------***----------------------------------------------------------------------- 1. INTRODUCTION The purpose of this paper is to provide researchers a systematic survey of existing ALPR research by categorizing existing methods according to the features they used, by analyzing the pros/cons of these features, and by comparing them in terms of recognition performance and processing speed, and to open some issues for the future research. Basic block diagram of the ALPR system is shown in fig 1.for above steps different techniques used by different author which are studied in literature review. An example of the number plate extraction is given .by this figure block diagram is easily understand, in this figure all steps of block diagram is shown by indicating number A, B, C, D. Automatic license plate recognition (ALPR) applies image processing and character recognition technology to identify vehicles by automatically reading their number plates. and this system mainly divide in three steps: all steps are better explain in proposed methodology. Figure (1): Basic Blockdiagram Of Alpr System The variations of the plate types or environments cause challenges in the detection and recognition of license plates. They are summarized as follows: 1) Location: Plates exist in different locations of an image. 2) Quantity: An image may contain no or many plates. 3) Size: Plates may have different sizes due to the camera distance and the zoom factor. 4) Color: Plates may have various characters and background colors due to different plate types or capturing devices. 5) Font: Plates of different nations may be written in different fonts and language. 6) Occlusion: Plates may be obscured by dirt. 7) Inclination: Plates may be tilted. 8) Other: In addition to characters, a plate may contain frames and screws. Environment variations: 1) Illumination: Input images may have different types of illumination, mainly due to environmental lighting and vehicle headlights. 2) Background: The image background may contain patterns similar to plates, such as numbers stamped on a vehicle, bumper with vertical patterns, and textured floors. 2. PROPOSEDMETHODOLOGY Vehicle license plate (VLP) constitutes an unambiguous identifier of a vehicle participating in road traffic. Reading a license plate is the first step in determining the identities of parties involved in traffic incidents. An efficient automatic license plate recognition process may become the core of fully
- 2. IJRET: International Journal of Research in Engineering and Technology eISSN: 2319-1163 | pISSN: 2321-7308 __________________________________________________________________________________________ Volume: 02 Issue: 07 | Jul-2013, Available @ http://www.ijret.org 162 computerized road traffic monitoring systems, electronic fee collection solutions, surveillance devices and safety supervision systems. It is important that the recognition accuracy of such a process is very high. Tracking and registering dangerous behavior in traffic may be used for prosecuting offenders. License-Plate Recognition System consists of three main modules: (1) License plate detection, (2) Character segmentation (3)Character Recognition (CR). Step(1)image acquisition, in image acquisition explained that from where images are acquire Image can be input to the system by different methods by analog camera,or by digital cameras, but nowadays digital technology has their advantages so better input method is by digital cameras or by direct digital photos. 2.1 LICENSE PLATE DETECTION By whole capturing image we having license plate covered by background of vehicle body,so by this step only plate are is extracted from whole body. our task now is to identify the region containing the license plate. In this experiment, two features are defined and extracted in order to decide if a candidate region contains a license plate or not , these features are 2.1.1 Preprocessing: Since we have assumed that the license plate has a yellow background, the first step is to identify the regions in the image that contain the intensity of RGB corresponding to the color yellow. We Filter the yellow colored part from the image using values obtained by experiments on the 10 sample images. (i) - (a< R< b) && (p< G< q) && (x< B< y) Where R is the intensity of the color Red , G of Green and B that of Blue. Based on this condition we obtain a BinaryImage. We change yellow to white and non-yellow to black. 2.1.2 MORPHOLOGICAL OPERATIONS: These are Non-linear filters, with the function of restraining noises, extracting features and segmenting images etc The following morphological operations have been used Fill (MATLAB function – imfill): fills holes in the binary image. A hole is a set of background pixels that cannot be reached by filling in the background from the edge of the image. Open (MATLAB function – imopen): performs morphological opening on the grayscale or binary image with the pre-defined structuring element. Dilate (MATLAB function – imdilate): dilates the grayscale, binary, or packed binary image returning the dilated image (I) On Applying these morphological operations on „im1.jpg‟ we obtain the Image. 2.1.3 HORIZONTAL SEGMENTATION Once the Preprocessing is over, the next step is to segment the license plate candidates from the image. We first do a horizontal segmentation of the image using the histogram method. Steps:- For this we calculate the horizontal and vertical projections of intensity. Then we find the mean of the local minim as of horizontal projection plot .Based on the threshold calculated from the above local minim as, we findx locations of the segmented regions. In order to locate the right and left edges of license plate from candidate region, the vertical projection after mathematical morphology deal is changed into binary image. The arithmetic for doing this is: TfLf TTT 1)( TfLf TTT 0)( where fT (1,i) is the vertical projection after mathematical morphology, T is the threshold. Then scan the function of fT (1,i) and register the portions where values change from 0 to 1 and from 1 to 0 in stack1 and stack2 respectively. So the candidate position of the left and right edge of the license plate are in stack1 (1,i) and stack2(1,i) respectively, and the candidate’s width of the license plate is calculated by: width(1, i) stack2(1, i) - stack1(1, i) respectively. So the candidate position of the left and right edge of the license plate are in stack1 (1,i) and stack2(1,i) respectively, and the candidate’s width of the license plate is calculated by: width(1, i) stack2(1, i) - stack1(1, i) These give the x coordinates of the potentially candidates regions 2.1.4 GETTING POTENTIAL CANDIDATES After getting the horizontal segments of the candidate regions, we would now want to get the vertical coordinates, in order to extract the exact area from the image For each of the horizontal segments, in order find the vertical location, we once again use the vertical projections of intensity. Then converting to a binary image using the threshold as discussed in the previous section we get the desired vertical coordinates. Now we have all our candidate regions. An candidate regions obtained from our sample image „im1.jpg‟ are : Figure (2) Candidate regions
- 3. IJRET: International Journal of Research in Engineering and Technology eISSN: 2319-1163 | pISSN: 2321-7308 __________________________________________________________________________________________ Volume: 02 Issue: 07 | Jul-2013, Available @ http://www.ijret.org 163 2.1.5 IDENTIFYING THE LICENSE PLATE: Out of the many candidate regions that we have obtained from the so far mentioned procedure, our task now is to identify the region containing the license plate. In this experiment, two features are defined and extracted in order to decide if a candidate region contains a license plate or not , these features are 1. Aspect ratio 2. Edge Density Even though these features are not scale-invariant, luminance- invariant, rotation-invariant, but they are insensitive to many environment changes. Aspect ratio The aspect ratio is defined as the ratio of the width to the height of the region. Aspect Ratio = width/height Since the minimum enclosing rectangle (MER) of the object region can be computed via rotating the region in previous section, the dimension of the object’s MER can be taken as the width and the height of the region. Edge density Applying the above feature to filter the segmented regions, a lot of non license plate regions can be removed. However, there are still many candidate regions left which take similar rectangularity and aspect ratio features as the license plate regions do, such as often the head lights. Considering that the license plate regions generally take higher local variance in its pixels‟ values due to the presence of characters, an important feature to describe license plate region is local variance, which is quantized using the edge density. The edge density is measured in a region R by averaging the intensities of all edge pixels within the region as Rnm D nmE NR R , 1 ),( Where E(i,j) represents the edge magnitude at location (i,j), and NR is the number of pixels in region R. License plate Sets used for training to calculate aspect ratio and edge density: We used 24 license plates as training data. They are contained in the directory named “edge_density_and_aspect_ratio_training_images”. After performing this experiment, we found the average values of the above mentioned features as follow: aspect ratio = 4.4912 edge density = 0.1359 On using the above mentioned features we are able to drop the incorrect regions and get the final result as the extracted license plate from the input image. For the candidate images shown above, above tests rules out the first candidate and gives the following output – Figure (3) Number Plate 2.2 SEGMENTATION This step characters on license plate are segmented and identify. This step is the most important step in license plate recognition because all further steps rely on it. This is the second major part of the License Plate detection algorithm. There are many factors that cause the character segmentation task difficult, such as image noise, plate frame, rivet, space mark, plate rotation and illumination variance. We here propose the algorithm that is quite robust and gives significantly good results on images having the above mentioned problems. for the segmentation preprocessing is required by conversion to gray scale and binarization. Different algorithms are used for segmentation which are explained further later in literature review. In the segmentation of plate characters, license plate is segmented into its constituent parts obtaining the characters individually. Firstly, image is filtered for enhancing the image and removing the noises and unwanted spots. Then dilation operation is applied to the image for separating the characters from each other if the characters are close to each other. After this operation, horizontal and vertical smearing are applied for finding the character regions. The result of this segmentation is in Figure given below. Figure (4) Locations of plate characters The next step is to cut the plate characters. It is done by finding starting and end points of characters in horizontal direction. The individual characters cut from the plate are as follows in Figure given below. Figure (5) Number plate characters
- 4. IJRET: International Journal of Research in Engineering and Technology eISSN: 2319-1163 | pISSN: 2321-7308 __________________________________________________________________________________________ Volume: 02 Issue: 07 | Jul-2013, Available @ http://www.ijret.org 164 2.3 CHARACTER RECOGNITISON: Automatically locate license plates by principal visual word (PVW), discovery and local feature matching. Observing that characters in different license plates are duplicates of each other, we bring in the idea of using the bag-of words (BoW) model popularly applied in partial-duplicate image search. Unlike the classic BoW model, for each plate character, we automatically discover the PVW characterized with geometric context. Given a new image, the license plates are extracted by matching local features with PVW. Besides license plate detection, our approach can also be extended to the detection of logos and trademarks. Due to the invariance virtue of scale- invariant feature transform feature, our method can adaptively deal with various changes in the license plates, such as rotation, scaling, illumination, etc. Promising results of the proposed approach are demonstrated with an experimental study in license plate detection. we formulate license plate detection as a visual matching problem. For each character, we collect SIFT features falling into the character region and generate PVW by unsupervised clustering. The amount of PVW for each plate character is determined automatically Besides SIFT descriptors, each visual word contains some geometric information, such as orientation, ratio of scale to character height, and relative position in the character region. Those geometric clues will be used to filter false feature matches and estimate the character and plate size. In testing, every valid match votes a support for plate location, and all supports are unified to discover potential license plates.Due to the invariance virtue of SIFT feature, our method can adaptively deal with various changes of license plate, such as distortion from observation views, scaling, and illumination. Multiple license plates in a single image can also be automatically detected. In visual word matching and license plate locating, we compare the extracted SIFT features of the test image with all discovered PVW, and locate the license plate based on the matching results. Let us denote the PVW set as {D, G} ={(di , gi ), i = 1, . . . , N}, where di denotes appearance descriptor, and gi denotes the geometric clues, N denotes the visual word number. Once the PVW of an object category is discovered, we can use it for detection in a new image. Given features F = { fi } for a test image, the probability that the test image corresponds to a sign of interest is )0,( ),( )0()0,( ),0( ii ii ii ii gdp gdp pgdp gdp …………………………….(1) where p(O) is prior of plate. The likelihood p(di , gi |O) is deduced as j jjiiii fpfgdpgdp )0()0,,()0,( …………………………….(2) where p(di , gi | f j , O) is modeled by matching feature f j to the descriptor di of the PVW. Figure (6) Illustration of a PVW (red arrow) in the character “6.” Consequently, by searching for the local maxima of the likelihood function given by (1) for all PVW, we can find the initial hypotheses for license plate location. Some other prior heuristics can also be imposed to remove potential false positives. In the following subsections, we will discuss PVW generation and local feature matching to extract license plate in detail. 2.3.1 PVW Generation There are a certain number of sorted characters in license plates, each with the same format, but maybe undergoing illumination change or affine transformation. Since SIFT feature is invariant to changes in scale and rotation, and robust to illumination change and affine distortion [2], some repeatable and distinctive SIFT features to each character exist, called PVW. As shown in Fig., a PVW is denoted as V (des, ori, rat, pos), where des is the 128-D SIFT descriptor, ori is the SIFT orientation (−π ≤ ori < π), rat = H/s (s is the SIFT scale), and pos = ( f/W, e/H) is a 2-D vector denoting the relative position of the key point in the character region. Both des and ori are originated from the standard SIFT features [2] des captures the local visual appearance with a concatenation of 8- D orientation histograms from 4 by 4 subpatches around local interest point. ori denotes the dominant directions of local gradients around a key point. Relative to ori and des is represented to achieve invariance to image rotation changes . Ideally, for a feature with high repeatability in a certain character, rat shall be identical. Given this specific SIFT feature with scale s, we can estimate the corresponding character height as rat · s. Given an image patch of the character with height, v, we can also derive the scale of the SIFT feature as v/rat. We collect many training images, each containing one or more license plates. License plates in the
- 5. IJRET: International Journal of Research in Engineering and Technology eISSN: 2319-1163 | pISSN: 2321-7308 __________________________________________________________________________________________ Volume: 02 Issue: 07 | Jul-2013, Available @ http://www.ijret.org 165 training images are all upright, with little affine distortion. Each character in the license plate is annotated and all SIFT features in each character region are extracted. Usually, many noisy features also exist. To discover the PVW of each character, we need to cluster the local features of each character and discover the most representative cluster centers as the PVW. which can be found automatically in the clustering process. In affinity propagation, a similarity matrix of samples shall be defined. We first give the distance metric, which will be used to define the similarity metric. The distance between two feature samples V j and Vk is defined in (3) PrOdkj DDDDd , …..……..(3) where α, β, γ, and δ are constant weighting factors, Dd ,Do, Dr, and Dp are the distance of descriptor, orientation, height-scale ratio, and position, respectively, and are defined as follows: 128 1 2 )( 1 i k i j id desdesD ………………(4) kjkj O orioriorioriD 2,min 1 …………….(5) kj r ratrat N D 1 (6) 2 1 2 )( 2 1 i k i j ip posposD ………………...(7) where σ and N are normalization factors to make sure that both Dd and Dr range from 0 to 1. The similarity metric is a decreasing function of the distance metric. There are many choices for it. In our implementation, the pair wise similarity between two feature samples V j and Vk is defined as )0(,)( ,, ndS n kjkj (8) In affinity propagation, the diagonal elements in the similarity matrix are referred to as exemplar preference, which will influence the number of identified clusters. Generally, without any priori, we set it as the median of the input similarities, After clustering, we need to discover the most representative clusters. For each cluster, we count the number of image patches which contain at least one feature falling into the cluster. Then an image-number histogram is built. To select those representative clusters, a threshold thresh shall be specified on the histogram. Any cluster with image number above thresh will be selected. In each selected cluster, the PVW are defined as the average of all samples falling into that cluster. In our experiments, we set thresh = 0.6·Num, where Num is the total sample number of the specific character. Fig. illustrates the feature clustering results of three characters: “0,” “6,” and “9.” In each character, the PVW are highlighted in red color on the patch with its geometric information: ori, rat, and pos. The PVW of characters from “0” to “9” are shown in Fig. while those of characters from “A” to “Z” excluding “I” and“O” are illustrated in Fig. 5. There are no PVW of character “I” and “O” as these two characters are not found in any training plate. 2.3.2 Visual Word Matching Given a test image, we will discover those characters with features matched to the PVW. We first extract SIFT features from the test image. Then each SIFT feature F(des, ori, scl) is compared with the PVW of each character. A feature is considered as a candidate match if the minimum descriptor distance to a certain PVW of a certain character is less than constant threshold T Tdesdestd d t F td 2 , ** argmin, …………………………….(9) where desF denotes the descriptor vector of a test SIFT feature, des d t denotes the descriptor vector of the t-th PVW in the d-th plate character. In standard SIFT features, descriptors are all normalized to be a constant const. In our experiments, we set T = 0.5 · const. Each candidate match is recorded as C(x, y, angle, height, pos), where x and y denote spatial position of the test SIFT feature in the image plane, angle is the rotation angle from the test feature to the matched visual word, height = rat dt* · sclF is the estimated height of the corresponding license plate, pos = pos d*t* denotes the relative position in character. Figure (7) PVW of each digit in Chinese license plate. Each arrow denotes a PVW
- 6. IJRET: International Journal of Research in Engineering and Technology eISSN: 2319-1163 | pISSN: 2321-7308 __________________________________________________________________________________________ Volume: 02 Issue: 07 | Jul-2013, Available @ http://www.ijret.org 166 Figure (8) PVW of each letter in Chinese license plate, from “A” to “Z,” excluding “I” and “O.” Each arrow denotes a PVW. C. License Plate Locating Once the character features in the test image are identified, we can make use of the geometric context of the matched PVW to locate the license plate. A bounding box will be estimated to encompass license plate by determining the upper, lower, left, and right bounding lines sequentially. We first estimate the upper and lower bounding lines of license plate in images. Specially, each matched feature C(x, y, angle, height, pos) estimates a point (xup, yup) of the upper bounding line by (10) and (11) )sin(cos)2( hposxxuo ………(10) )cos(sin)2( hposyyup ………(11) where h and θ are the median of height and angle of all valid matched features C, respectively, pos(2) = e/H. The origin is assumed to be at the upper-left corner of the image plane. Then, for all upper bounding points, we estimate a line with linear regression. Similarly, we can also determine the lower bounding points (xdown, ydown) with (12) and (13) and estimate the lower bounding line of license plate. )sin(cos))2(1( hposxxdown ……..(12) )cos(sin))2(1( hposyydown .…...(13) After that, we can also roughly estimate the left and right bounding lines. In license plate, the ratio of plate width to height is constant. When the plate height h is estimated, we can obtain the plate width w. Since license plate must cover all matched key points of SIFT feature, the interval between the left bound and the most right key point of matched feature shall be no less than w, so is that of the interval between the right bounding line and the most left key point. Consequently, we can determine the minimal bounding box containing the license plate although some background patch is also included, they can be removed with some other information, such as edge map. However, this is not our focus in this paper. 3. EXPERIMENTAL RESULTS To evaluate the proposed approach containing 410 Chinese license plate images. Of them, 160 license plate images are downloaded from the Internet while another 250 images are taken by the authors. The second dataset contains 112 images with resolution of 896 ?592, each contains a U.S. license plate with a cluttered background, such as trees or grass. In this dataset, the plate character height ranges from about 16 to 23. On the first dataset, it achieves a 93.2% “true” detection rate, On the second dataset, the “true” detection rate of our approach is 84.8%,All the “true” detection rates of four approaches are lower than that on the first dataset. This is because the plates in the second dataset are of smaller size, and the background is much more cluttered. The false positive rate of our approach is also much lower than that of the three comparison approaches. We investigate the time efficiency from two aspects. The first one is feature extraction time, and the second one is detection time after feature extraction. Our approach is based on SIFT feature, whose extraction time cost is larger than that of edge maps, as used in the other three comparison approaches. The detection time cost of our approach is proportional to the SIFT feature amount of image, while thedetection efficiency of the three comparison approaches are determined by the complexity extent of image texture. In open environment, there are various observation views from cameras, which will make the edge map-based methods difficult to accurately extract the whole plate. However, benefiting from the invariance property of SIFT feature, our approach can effectively address that difficulty when the observation angle is within some tolerance range. some results seen in figure12. Figure (9) Sample detection results of license plates
- 7. IJRET: International Journal of Research in Engineering and Technology eISSN: 2319-1163 | pISSN: 2321-7308 __________________________________________________________________________________________ Volume: 02 Issue: 07 | Jul-2013, Available @ http://www.ijret.org 167 CONCLUSIONS In general, an ALPR system consists of four processing stages. In the image acquisition stage, some points have to be considered when choosing the ALPR system camera, such as the camera resolution and the shutter speed. In the license plate extraction stage, the license plate is extracted based on some features such as the color, the boundary, or the existence of the characters. In the license plate segmentation stage, the characters are extracted by projecting their color information, by labeling them, or by matching their positions with template. Finally, the characters are recognized in the character recognition stage by template matching, or by classifiers such as neural networks and fuzzy classifiers. Automatic license plate recognition is quite challenging due to the different license plate formats and the varying environmental conditions. There are numerous ALPR techniques have been proposed in recent years. REFERENCES [1] Muhammad Sarfraz, Mohammed Jameel Ahmed, and Syed A. Ghazi ,“Saudi arebian licence plate recognition system”, International Conference on Geometric Modeling and Graphics (GMAG’03), 2003. [2] Serkan Ozbay, and Ergun Ercelebi,” Automatic Vehicle Identification by Plate Recognition”, Processing of world academy of science engineering and technology vol9, ISSN 1307-6884, november 2005. [3] Humayun Karim Sulehria, Ye Zhang, Danish Irfan, Atif Karim Sulehria,” Vehicle Number Plate Recognition Using Mathematical Morphology and Neural Networks”, WSEAS TRANSACTIONS on COMPUTERS, Volume 7,ISSN: 1109- 2750, Issue 6, June 2008. [4] Zhen-Xue Chen, Cheng-Yun Liu, Fa-Liang Chang, and Guo-You Wang,” Automatic License-Plate Location and Recognition Based on Feature Salience”, IEEE Transaction on vehicle technology, VOL. 58, NO. 7, september 2009. [5] Dr. P.K.Suri, Dr. Ekta Walia, Er. Amit Verma,” Vehicle Number Plate Detection using Sobel Edge Detection Technique”, International Journal of Computer Science and Technology, ISSN : 2229 – 4333, IJCST Vol. 1, Issue 2, December 2010. [6] Kumar Parasuraman, Member, IEEE and P.Vasantha Kumar, “ An Efficient Method for Indian Vehicle License Plate Extraction and Character Segmentation”, IEEE International Conference on Computational Intelligence and Computing Research,2010. [7] Muhammad H Dashtban, Zahra Dashtban, Hassan Bevrani, “ A Novel Approach for Vehicle License Plate Localization and Recognition”, International Journal of Computer Applications (0975 – 8887), Volume 26– No.11, July 2011. [8] Stuti Asthana, Niresh Sharma, Rajdeep Singh, “Vehicle number plate recognition using multiple layer back propagation neural networks”, International Journal of Computer Technology and Electronics Engineering (IJCTEE), Volume 1, Issue 1, July 10, 2011. BIOGRAPHIES: Rinku K. Solanki, M.tech student (digital communication), NRI-IST, Bhopal, Madhya Pradesh, India Rajeev Kumar Rai, Asst. Prof.(Head of the department of E.C.), NIIST, Bhopal, Madhya Pradesh, India, raj.rai1008@gmail.com Teena Raikwar, Assistant professor, electronics & communication dept., (NRI-IST, Bhopal), Madhya Pradesh, India, t_raikwar.2006@yahoo.co.in