1. CC-100 Demonstration Platform
For Intellectual Property Import
This document is a guide to CC-100 integration into DSP and processor based
systems. It is partitioned into 2 steps. The first step is intended to be a
familiarization step, using the CC-100 Demonstration Platform as a standalone
demonstration, evaluation, and verification vehicle. The second step, is the actual
integration of the CC-100 IP and circuits into a given Integrated Circuit, using the
experience and learning gained in exercising the demonstration platform in the first
step, enabling integration and evaluation success of the CC-100 in given IC
systems. Contact CurrentRF for details on this process.
Step 1: CC-100 Demonstration, Evaluation, and Verification
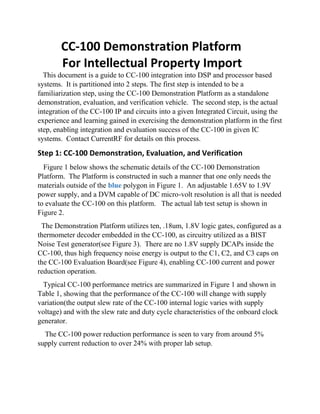
Figure 1 below shows the schematic details of the CC-100 Demonstration
Platform. The Platform is constructed in such a manner that one only needs the
materials outside of the blue polygon in Figure 1. An adjustable 1.65V to 1.9V
power supply, and a DVM capable of DC micro-volt resolution is all that is needed
to evaluate the CC-100 on this platform. The actual lab test setup is shown in
Figure 2.
The Demonstration Platform utilizes ten, .18um, 1.8V logic gates, configured as a
thermometer decoder embedded in the CC-100, as circuitry utilized as a BIST
Noise Test generator(see Figure 3). There are no 1.8V supply DCAPs inside the
CC-100, thus high frequency noise energy is output to the C1, C2, and C3 caps on
the CC-100 Evaluation Board(see Figure 4), enabling CC-100 current and power
reduction operation.
Typical CC-100 performance metrics are summarized in Figure 1 and shown in
Table 1, showing that the performance of the CC-100 will change with supply
variation(the output slew rate of the CC-100 internal logic varies with supply
voltage) and with the slew rate and duty cycle characteristics of the onboard clock
generator.
The CC-100 power reduction performance is seen to vary from around 5%
supply current reduction to over 24% with proper lab setup.
2. Figure 1: CC-100 Demonstration Module and Typical Metrics
Supply CC-100 CC-100 delta (mA) Percentage
Voltage (V) Engaged (mA) Disengaged (mA) Reduction
1.9 5.392 5.88 0.488 8.3
1.85 4.932 5.233 0.301 5.7
1.8 3.774 4.249 0.475 11.17
1.75 2.717 2,858 0.141 5
1.7 1.997 2.113 0.116 5.5
1.65 1.106 1.464 0.358 24.4
(Average) 9.8
Table 1: CC-100 Demonstration Module Performance Variance
with Supply Voltage
Table 1 above shows CC-100 performance over varying supply voltages (1.9V to
1.65V) with the CC-100 engaged(the black jumper installed in Figure 2) and
disengaged(the black jumper in Figure 2 de-inserted(not shown)). With the
gathered raw data, the engaged/disengaged current delta and percentage current
reduction with the engaged CC-100 is computed and inserted into Table 1.
3. The Table 1 data was gathered with a Fluke 289 True RMS Multi-meter which
possesses a micro-volt precision DC DVM. A micro-volt precision DC DVM is
necessary for accurate CC-100 BIST testing.
Table 1 shows somewhat high variability in the current saved by the CC-100(5%
to 24%). This is not a variation in CC-100 performance, but is the result of slew
rate variation in the onboard BIST generator and external clock generation circuits.
Figure 2: CC-100 Demonstration Module Lab Set-up
4. Figure 3: CC-100 Demonstration Module BIST Decoder Logic
Figure 3 above shows the CC-100 Thermometer Decoder used as a BIST Noise
Engine for the CC-100 tests. Not shown are ESD cells with 250 Ohm resistor in
series with the logic gate inputs and the pF range capacitances associated with the
decoder inputs.
5. Figure 4 : CC-100 Demonstration Board
Step 2: CC-100 IP Integration into a given Integrated Circuit
Contact CurrentRF for details on this process. NDA coverage is required for
details on this integration step. Contact information below.
6. Contact Information:
For additional information, evaluation boards/reference designs, product pricing
or technical help, reach us at:
CurrentRF
543 Livingston Ct.
Discovery Bay, Ca. 94505
(209)-914-2305
Michael.Hopkins@CurrentRF.com