Download as PDF, PPTX


![Characterizing the Target
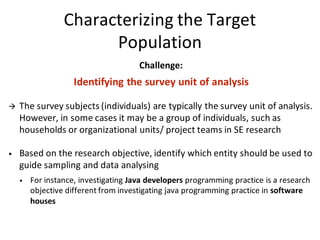
Population
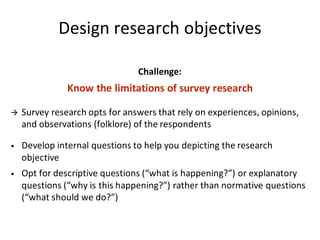
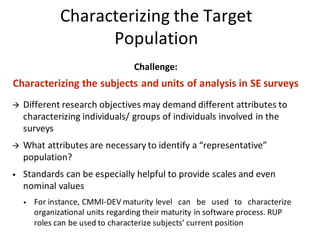
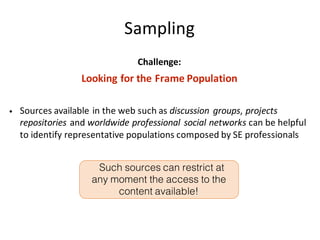
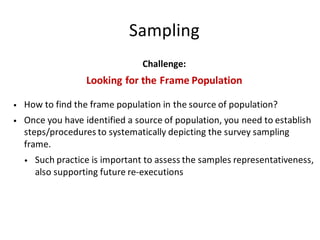
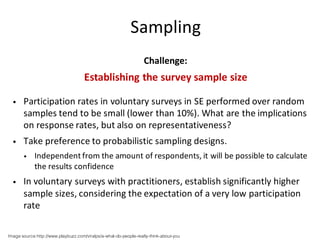
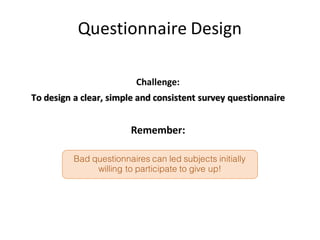
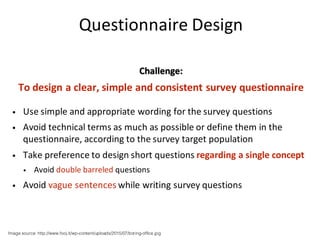
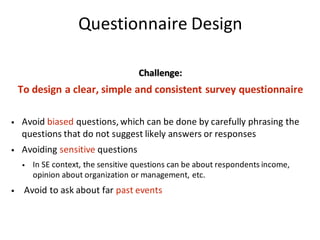
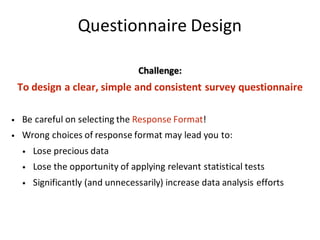
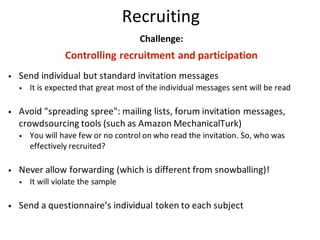
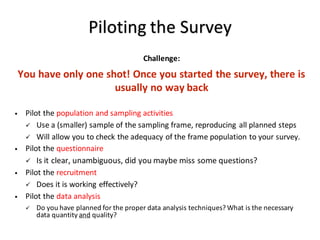
Challenge:
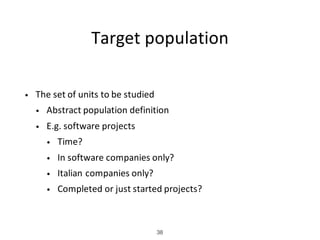
Characterizing the subjects and units of analysis in SE surveys
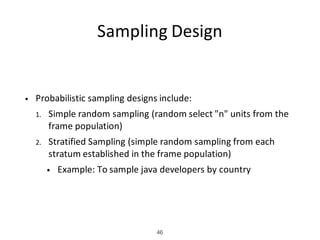
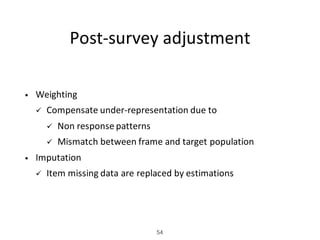
• Individuals can be characterized through attributes such as: experience in the
research context, experience in SE, current professional role, location and
higher academic degree]
• Organizations can be characterized through attributes such as: size (scale
typically based in the number of employees), industry segment (software
factory, avionics, finance, health, telecommunications, etc.), location and
organization type (government, private company, university, etc.)
• Project teams can be characterized through attributes such as project size;
team size, client/product domain (avionics, finance, health,
telecommunications, etc.) and physical distribution](https://image.slidesharecdn.com/iasese-2016-surveysinsenobg-180116153632/85/Surveys-in-Software-Engineering-64-320.jpg)
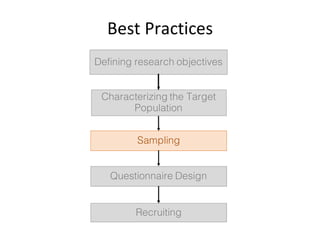
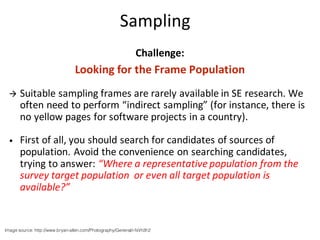
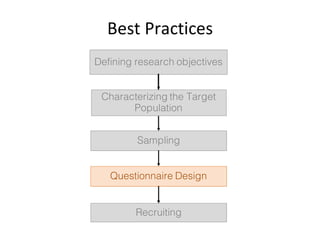
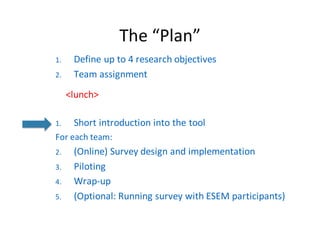
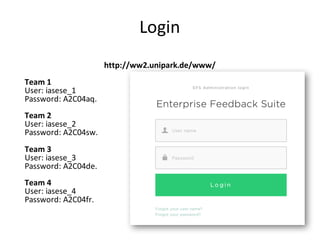
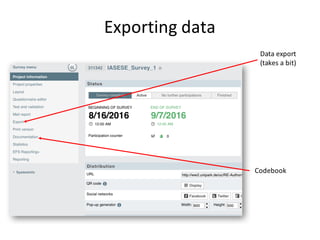
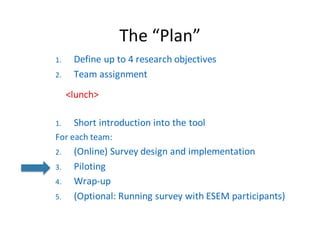
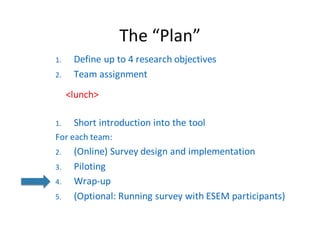

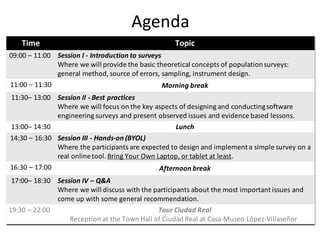
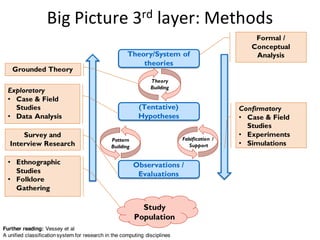
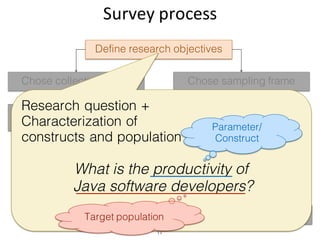
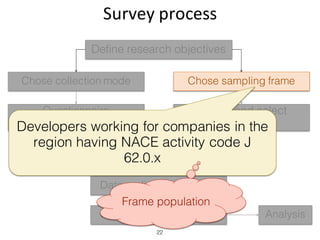
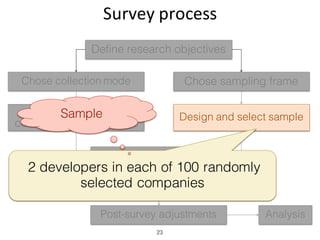
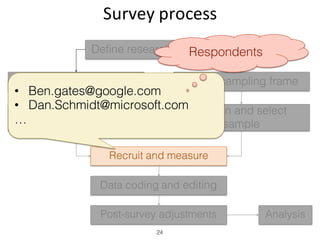
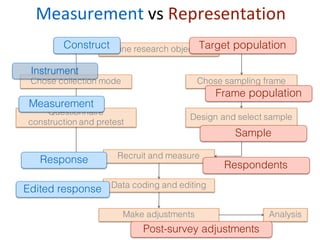
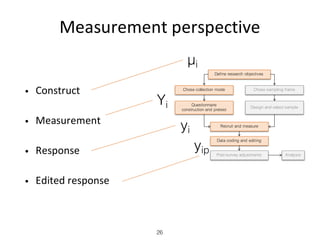
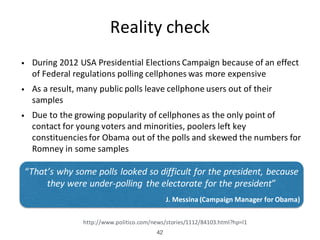
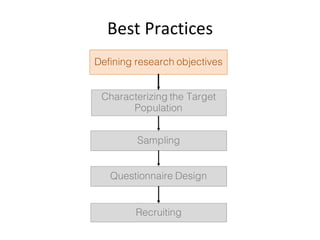
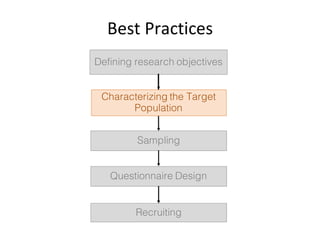
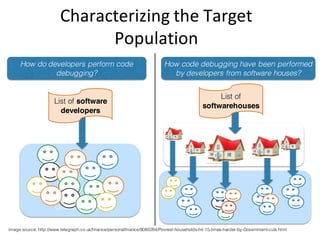
This document outlines an agenda for a workshop on surveys in software engineering. The workshop will cover four sessions: an introduction to surveys, best practices for designing and conducting software engineering surveys, a hands-on session for designing a survey using an online tool, and a question and answer session. The introduction will cover basic concepts of survey research including research objectives, sampling, instrument design, and analysis. The best practices session will focus on key aspects of software engineering surveys and lessons learned. Participants are encouraged to actively engage by asking questions and sharing their experiences with survey research.


![[IGC2018] 캡콤 토쿠다 유야 - 몬스터헌터 월드의 게임 컨셉과 레벨 디자인](https://cdn.slidesharecdn.com/ss_thumbnails/3-181023023843-thumbnail.jpg?width=640&height=640&fit=bounds)


![배틀쉘터 기획서 [완성본].pptx](https://cdn.slidesharecdn.com/ss_thumbnails/random-230125214335-c19a2026-thumbnail.jpg?width=640&height=640&fit=bounds)


![[창작]승리의 여신 니케_채팅 시스템](https://cdn.slidesharecdn.com/ss_thumbnails/random-240612074319-05bca8c3-thumbnail.jpg?width=640&height=640&fit=bounds)