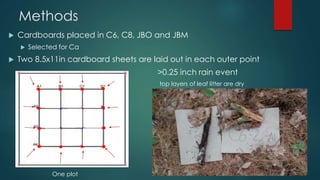
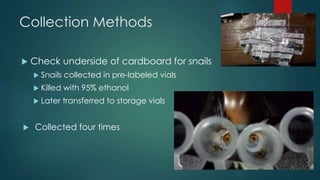
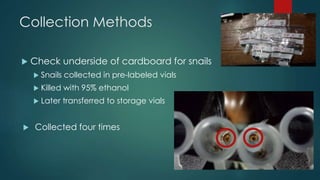
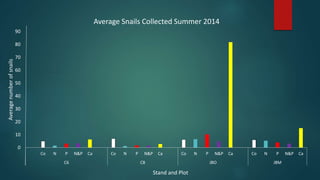
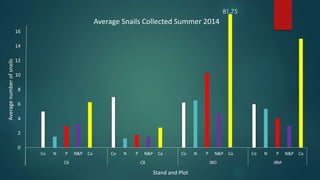
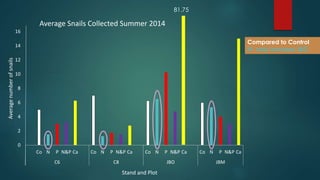
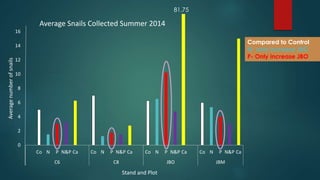
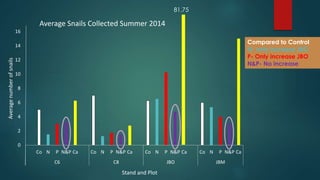
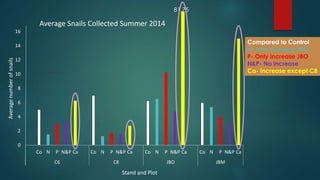
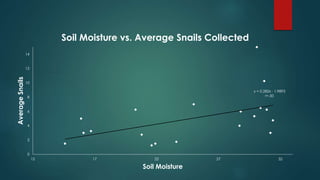
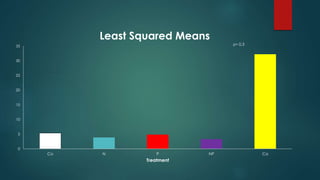
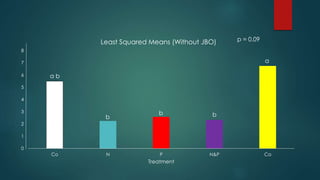
Looking for Snails in
Four MELNHE Stands
STEPHANIE SUTTENBERG
SUNY ESF ‘17
REU SHOESTRING CREW
Background
Snails are found in leaf litter (Oi layer)
Need to be damp -- desiccation
Snails need Ca (Skeldon et al 2007)
Watershed 1
Increase numbers
Not useable
Little research on N and P
Lower phosphorus, lower growth rate of individuals (Krist 2014)
Higher nitrogen, higher snail population (Stuart A. 2014)
v
Methods
Cardboards placed in C6, C8, JBO and JBM
Selected for Ca
Two 8.5x11in cardboard sheets are laid out in each outer point
>0.25 inch rain event
top layers of leaf litter are dry
One plot
Collection Methods
Check underside of cardboard for snails
Snails collected in pre-labeled vials
Killed with 95% ethanol
Later transferred to storage vials
Collected four times
Collection Methods
Check underside of cardboard for snails
Snails collected in pre-labeled vials
Killed with 95% ethanol
Later transferred to storage vials
Collected four times
90
80
70
60
50
40
30
20
10
0
Average Snails Collected Summer 2014
Co N P N&P Ca Co N P N&P Ca Co N P N&P Ca Co N P N&P Ca
C6 C8 JBO JBM
Average number of snails
Stand and Plot
16
14
12
10
8
6
4
2
0
Average Snails Collected Summer 2014
Co N P N&P Ca Co N P N&P Ca Co N P N&P Ca Co N P N&P Ca
C6 C8 JBO JBM
Average number of snails
Stand and Plot
81.75
16
14
12
10
8
6
4
2
0
Average Snails Collected Summer 2014
Co N P N&P Ca Co N P N&P Ca Co N P N&P Ca Co N P N&P Ca
C6 C8 JBO JBM
Average number of snails
Stand and Plot
81.75
Compared to Control
N- only increase JBO
16
14
12
10
8
6
4
2
0
Average Snails Collected Summer 2014
Co N P N&P Ca Co N P N&P Ca Co N P N&P Ca Co N P N&P Ca
C6 C8 JBO JBM
Average number of snails
Stand and Plot
81.75
Compared to Control
N- only increase JBO
P- Only increase JBO
16
14
12
10
8
6
4
2
0
Average Snails Collected Summer 2014
Co N P N&P Ca Co N P N&P Ca Co N P N&P Ca Co N P N&P Ca
C6 C8 JBO JBM
Average number of snails
Stand and Plot
81.75
Compared to Control
N- only increase JBO
P- Only increase JBO
N&P- No increase
16
14
12
10
8
6
4
2
0
Average Snails Collected Summer 2014
Co N P N&P Ca Co N P N&P Ca Co N P N&P Ca Co N P N&P Ca
C6 C8 JBO JBM
Average number of snails
Stand and Plot
81.75
Compared to Control
N- only increase JBO
P- Only increase JBO
N&P- No increase
Ca- Increase except C8
y = 0.282x - 1.9893
r=.50
14
12
10
8
6
4
2
0
Soil Moisture vs. Average Snails Collected
12 17 22 27 32
Average Snails
Soil Moisture
35
30
25
20
15
10
5
0
Least Squared Means
Co N P NP Ca
Treatment
p= 0.3
8
7
6
5
4
3
2
1
0
Least Squared Means (Without JBO) p = 0.09
Co N P N&P Ca
Treatment
a
b b b
a b
Discussion
Average of 5.8 snails/m^2
7.6 snails/m^2 (Skeldon et al 2014)
Leaf litter too damp?
Edge effect?
Dry out faster
Two phase model for N
Initial die off, but then favor snail reproduction and survival
(Stuart 2014)
Recently fertilized (June). Die back stage?
Future Research
Taxa of individuals will be determined
Soil pH levels
Soil composition
Varying levels of leaf litter dryness
“Goldilocks zone”
Citations
Krist, Amy C., Adam D. Kay, Katelyn Larkin, Maurine Neiman. 2014.
Response to Phosphorus Limitation Varies among Lake Populations
of the Freshwater Snail Potamopyrgus antipodarum
Skeldon, M. et al 2007. Terrestrial gastropod response to an
ecosystem-level calcium manipulation in a northern hardwood
forest.
Stuart, A., & Palenzuela, N. 2014 Effects of fertilizer applications on
survival and recruitment of the apple snail, Pomacea canaliculata
(Lamarck). Crop Protection.
Wu, J. et al 2014. Identification of optimum scopes of environmental
factors for snails using spatial analysis techniques in Dongting Lake
Region, China. Parasites & Vectors.
Acknowledgements
I’d like to thank Eli, Jerome, Nora and Abby for setting out
cardboards
Adam and Ruth for much needed advice in layouts, stats and
methods
Eli, Lisa, Adam, Sophie and Justin for collecting snails
Matt Vadeboncoeur and Cheryl Bondi for helping with methods