1. Graph of Adsorption Isotherm
400
350
300
Vads cm³/g
250
200
150
100
50
0
0 0.2 0.4 0.6 0.8 1
Relative Pressure (P/Po)
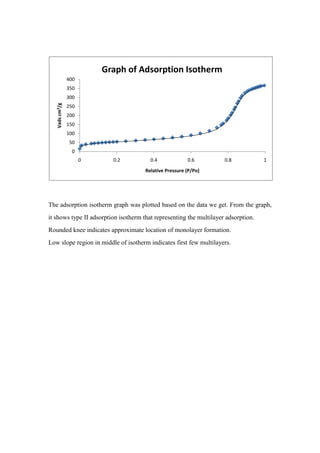
The adsorption isotherm graph was plotted based on the data we get. From the graph,
it shows type II adsorption isotherm that representing the multilayer adsorption.
Rounded knee indicates approximate location of monolayer formation.
Low slope region in middle of isotherm indicates first few multilayers.
2. BET Surface Area
BET surface area analysis is a technique used to determine the specific surface area of
a material. Model of adsorption extended to multilayers.
BET equation:
V C ( P P0 )
Vm (1 P P0 )(1 P P0 C ( P P0 )
Or it’s linearized form:
1 1 C 1 P
V [( P0 P ) 1] VmC VmC P0
By comparing with y = mx+C
y- axis = 1/[V (Po/P)-1]
x-axis = P/Po
m (slope/gradient) =
C (intercept) =
Then, graph of 1/[V (Po/P)-1] versus P/Po is plotted.
BET Graph
0.008
0.007 y = 0.022x + 4E-05
0.006
1/[V(Po/P - 1)]
0.005
0.004
0.003
0.002
0.001
0
0 0.05 0.1 0.15 0.2 0.25 0.3 0.35
Relative Pressure (P/Po)
3. By using Microsoft Excel, we obtain a linear equation y = 0.0229x + 4×10⁻⁵.
Slope = = 0.0229 (Equation 1)
Intercept = = 4×10⁻⁵ (Equation 2)
By solving equation 1 and 2,
C = 573.5
Vm = 43.59 ml/g
The specific surface area is equal to monolayer capacity x Avogadro’s constant x cross
section of adsorbed molecule, that is Sm = nm × Am × N
Sm = nm × Am × N
nm = = 0.00195 mol/g
Sm = nm × Am × N
Sm = 0.00195 mol/g × (16.2 ×10 -20 m2) × (6.023 x 1023 mol-1)
Sm = 190.2 m2/g
4. Langmuir Model
Vads =
Or it’s linearized form,
By comparing with y = mx+C
y- axis = p/Vad
x-axis = p
m (slope/gradient) =
C (intercept) =
Then, graph of p/Vad versus p is plotted.
Langmuir Graph
4.5
4 y = 0.016x + 0.209
3.5
3
P/Vad
2.5
2
1.5
1
0.5
0
0 50 100 150 200 250
P
5. By using Microsoft Excel, we obtain a linear equation y = 0.0166x + 0.2094
Slope = = 0.0166 (Equation 1)
Intercept = = 0.2094 (Equation 2)
By solving equation 1,
Vm = 60.2 ml/g
The specific surface area is equal to monolayer capacity x Avogadro’s constant x cross
section of adsorbed molecule, that is Sm = nm × Am × N
Sm = nm × Am × N
nm = = 0.00269 mol/g
Sm = nm × Am × N
Sm = 0.00269 mol/g × (16.2 ×10 -20 m2) × (6.023 x 1023 mol-1)
Sm =262.3 m2/g
![BET Surface Area
BET surface area analysis is a technique used to determine the specific surface area of
a material. Model of adsorption extended to multilayers.
BET equation:
V C ( P P0 )
Vm (1 P P0 )(1 P P0 C ( P P0 )
Or it’s linearized form:
1 1 C 1 P
V [( P0 P ) 1] VmC VmC P0
By comparing with y = mx+C
y- axis = 1/[V (Po/P)-1]
x-axis = P/Po
m (slope/gradient) =
C (intercept) =
Then, graph of 1/[V (Po/P)-1] versus P/Po is plotted.
BET Graph
0.008
0.007 y = 0.022x + 4E-05
0.006
1/[V(Po/P - 1)]
0.005
0.004
0.003
0.002
0.001
0
0 0.05 0.1 0.15 0.2 0.25 0.3 0.35
Relative Pressure (P/Po)](data:image/gif;base64,R0lGODlhAQABAIAAAAAAAP///yH5BAEAAAAALAAAAAABAAEAAAIBRAA7)