Download to read offline


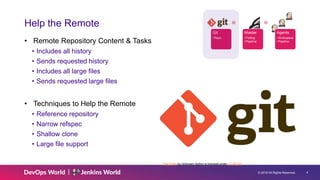
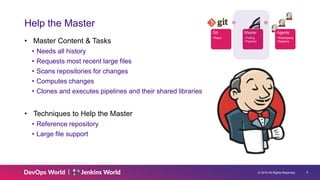
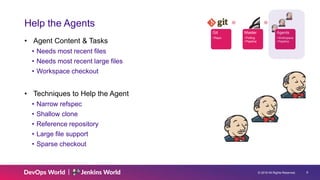

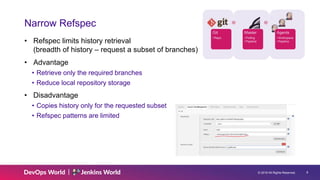


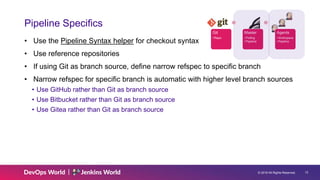


The document discusses techniques to improve Git performance in Jenkins, focusing on reducing clone time and disk usage through methods such as reference repositories, narrow refspecs, shallow clones, and large file support. It outlines the advantages and disadvantages of each technique and suggests using pipeline syntax and third-party sources like GitHub and Bitbucket for better integration. The overall aim is to optimize workspace storage and network data transfer while maintaining efficiency in CI/CD processes.


![[AI] ML Operationalization with Microsoft Azure](https://cdn.slidesharecdn.com/ss_thumbnails/wds-mlops-trainer-kyle-akepanidtaworn-v03-190924094657-thumbnail.jpg?width=640&height=640&fit=bounds)


![[AWS Container Service] Getting Started with Cloud Map, App Mesh and Firecracker](https://cdn.slidesharecdn.com/ss_thumbnails/200gettingstartedwithcloudmapappmeshandfirecraker-190326085953-thumbnail.jpg?width=640&height=640&fit=bounds)


![Docker and Jenkins [as code]](https://cdn.slidesharecdn.com/ss_thumbnails/dockerandjenkinsascode-190815233617-thumbnail.jpg?width=640&height=640&fit=bounds)


