
Recommended
More Related Content
What's hot
What's hot (20)
Similar to 1 h nmr spectrum using chemdraw
Similar to 1 h nmr spectrum using chemdraw (20)
More from manimekalai34
Recently uploaded
Recently uploaded (20)
1 h nmr spectrum using chemdraw
- 1. NMR SPECTRUM USING CHEMDRAW BY DR.S.MANIMEKALAI E.M.G.YADAVA WOMEN’S COLLEGE MADURAI-14 https://youtu.be/gVvXXgF3Znw
- 2. Introduction: NMR chemical shifts are an important tool in characterizing molecular systems and structures. accordingly, predicting NMR spectra is an essential feature of computational chemistry software chemdraw ultra includes the CS chemNMR pro facility which can be used to estimate the 13C and 1H (proton) chemical shifts with respect to TMS. This facility is accessed from the estimate menu within the product. when a molecule has been selected, the two items on the menu become active, and selecting one of them causes the NMR chemical shifts for the
- 3. the main advantage of this approach to computing chemical shifts is its speed: chemical shifts can be computed almost instantaneously even for very large molecules. however, the method has an important weakness which must be kept in mind. since it relies on a fixed set of parameters corresponding to atom types and subgroups, the method will be reliable only for molecules for which parameters are available and for which the assumptions about molecular structure and bonding which are built- in to the parameters are valid. In simple terms, this nmr estimation method is appropriate only for ordinary organic molecules. it produces reasonable results for such systems, but becomes quite unreliable for systems with any unusual features: unusual bonding, strained systems, systems for which electron correlation is important for accurate modeling of the
- 4. what is chemnmr? chemnmr was developed by upstream solutions to be run within chemdraw ultra. the program is invoked by first selecting a chemical structure that one wants predicted, then going to the <estimate> menu and selecting <1H nmr shifts> or <13C nmr shifts>. calculation is very rapid and estimated chemical shifts are displayed adjacent to the relevant nuclei.
- 5. chemical shifts are also displayed as a line spectrum, and a more detailed account of the estimation is provided as a text file in notepad. the program works by breaking the structure down into one or more substructures that provide the base value for the estimated shift. additivity rules are then applied and the base value is incremented to provide the final value. in the case of 1H NMR, the shifts are predicted for a non-polar solvent. hydrogens bonded to hetero atoms e.g. OH and SH are not calculated. proton-proton coupling constants are also not predicted. elements of the first four rows and a few from the fifth row of the periodic table are recognized
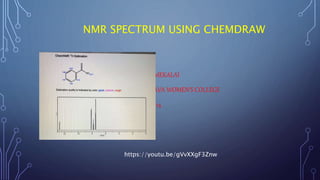
- 6. Example: 1H nmr shifts 2-methoxy-6-(methoxymethoxy)- 7-methylnapthalene For each hydrogen in the compound there are 3 values for the chemical shift. the first is the value predicted by chemnmr; the second (in italics) is that predicted by acd/nmr w 2.7 and the third (in bold) is the observed chemical shift in cdcl3. PREDICTED AND OBSERVED 1H NMR SHIFTS FOR 2-METHOXY-6-(METHOXYMETHOXY)-7- METHYLNAPTHALENE
- 7. NMR SHIFTS chemnmr estimates chemical shifts for all hydrogen or carbon atoms for which additivity rules are available. following a hierarchical list, it first identifies key substructures of a molecule. a substructure provides the base value for the estimated shift. for example, benzene would be the key substructure of trinitrotoluene when a substructure is a ring system not available in the data, chemnmr approximates its base shift using embedded rings and, if necessary, will disassemble the ring into acyclic substructures. chemnmr views remaining parts of the molecule as substituents of a substructure. each substituent adds to, or subtracts from, the base shift of the substructure to which it is attached.
- 8. additivity rules determine the increment of each contribution. if an increment for a substituent cannot be determined, chemNMR uses embedded substituents—smaller structural units with the same neighboring atoms. or, it will use increments of identical, or embedded substituents, of a corresponding substructure by assuming that the effects of the substituents are of the same magnitude. chemNMR provides a detailed protocol of the estimation process applied. it gives substructures as names, compound classes in most cases, substituents in the form of a linear code, respectively. it also implements models for ethylenes (cis/trans) and cyclohexanes (equatorial/axial)
- 9. To view 1H or 13C nmr information: 1. select a structure. 2. navigate to structure>predict 1H-nmr shifts (or) predict 13C- nmr shifts. Chemnmr redraws the molecule with the estimated shifts and displays the information and line spectrum in a new window
- 10. ASSIGNING STRUCTURES TO SPECTRA chemdraw professional lets you assign structures to spectra. you can then display the structure associated with a specific peak by placing the pointer on that peak. TO ASSIGN STRUCTURES TO SPECTRA: 1.open a spectral file. 2.draw the structure (or structures) to assign to the spectrum. 3.select specific atoms and bonds in the structure. 4.<shift>+click the peak, or peaks, to which you want the structure assigned. The selection rectangle surrounds the selected objects. 5. navigate to structure>make spectrum-structure assignment. the selected atoms and bonds in the structure are associated with the selected spectral peaks. The selected atoms and bonds in the structure are associated with the
- 11. VIEWING SPECTRAL ASSIGNMENTS To view spectral assignments: 1.click the lasso or marquee tool. 2.place the pointer over a peak. The assigned atoms or bonds are highlighted REMOVING SPECTRAL ASSIGNMENTS to remove spectrum to structure assignments: 1. click the lasso or marquee tool. 2. select the objects from which to remove the assignment. 3. navigate to structure>clear spectrum-structure.
- 12. CHEMNMR LIMITATIONS the program handles the following elements and isotopes: H, D He, Li, Be, B, C, N, O, F, Ne, Na, Mg, Al, Si, P, S, Cl, Ar, K, Ca, Sc, Ti, V, Cr, Mn, Fe, Co, Ni, Cu, Zn, Ga, Ge, As, Se, Br, Kr, Rb, Sr, Y, Zr, Nb, Mo, Tc, Ru, Rh, Pd, Ag, Cd, In, Sn, Sb, Te, I, Xe, Cs, Ba, La, Ce, Pr, Nd, Pm, Sm, Eu, Gd, Tb, Dy, Ho, Er, Tm, Yb, Lu, Hf, Ta, W, Re, Os, Ir, Pt, Au, Hg. functional groups are expanded automatically. in the case of 1H nmr, it estimates shifts of about 90% of all CHx - groups with a standard deviation of 0.2.-0.3 ppm. the use of polar solvents may strongly increase these deviations. it does not estimate shifts of hydrogen atoms bonded to heteroatoms because they are significantly affected by solvents, concentration, impurities, and steric effects. in case of 13C nmr, it estimates over 95% of the shifts with a mean
- 13. Floating Periodic Table click on... to... an existing unlabeled atom label the atom an existing labeled atom cycle the hydrogen count (if it matches the selected element) or change the label an empty space create a new atom The Periodic Table window displays a floating periodic table. It can be used both for reference and to insert elements into structures. Click an element symbol to highlight the element and activate the Text tool. Drag across the table to highlight each element in turn. Click the button to show or hide the detailed information. After selecting an element, click in the document to add an atom label consisting of that element and the appropriate number of hydrogens. Labeling behavior is as follows: 1.Double-clicking on an existing atom will open it for editing without changing the label.
- 14. • The new floating periodic table is the fastest route to element information, while the new floating character map enables users to add symbols and special characters from any font instantly to a ChemDraw document.