This document provides an overview of the nine steps involved in developing and validating scales for health, social, and behavioral research. It describes the three phases of scale development: item development, scale development, and scale evaluation. Item development involves identifying domains and generating items, and assessing content validity. Scale development includes pre-testing questions, administering surveys, reducing items, and extracting factors. Scale evaluation consists of testing dimensionality, reliability, and validity. The document aims to concisely review best practices for each step to facilitate the development of rigorous and meaningful scales.
Web & Social Media Analytics Previous Year Question Paper.pdf
REVIEWpublished 11 June 2018doi 10.3389fpubh.2018.001.docx
1. REVIEW
published: 11 June 2018
doi: 10.3389/fpubh.2018.00149
Frontiers in Public Health | www.frontiersin.org 1 June 2018 |
Volume 6 | Article 149
Edited by:
Jimmy Thomas Efird,
University of Newcastle, Australia
Reviewed by:
Aida Turrini,
Consiglio per la Ricerca in Agricoltura
e L’analisi Dell’Economia Agraria
(CREA), Italy
Mary Evelyn Northridge,
New York University, United States
*Correspondence:
Godfred O. Boateng
2. [email protected]
Specialty section:
This article was submitted to
Epidemiology,
a section of the journal
Frontiers in Public Health
Received: 26 February 2018
Accepted: 02 May 2018
Published: 11 June 2018
Citation:
Boateng GO, Neilands TB,
Frongillo EA, Melgar-Quiñonez HR and
Young SL (2018) Best Practices for
Developing and Validating Scales for
Health, Social, and Behavioral
Research: A Primer.
Front. Public Health 6:149.
doi: 10.3389/fpubh.2018.00149
Best Practices for Developing and
3. Validating Scales for Health, Social,
and Behavioral Research: A Primer
Godfred O. Boateng1*, Torsten B. Neilands 2, Edward A.
Frongillo 3,
Hugo R. Melgar-Quiñonez 4 and Sera L. Young1,5
1 Department of Anthropology and Global Health, Northwestern
University, Evanston, IL, United States, 2 Division of
Prevention Science, Department of Medicine, University of
California, San Francisco, San Francisco, CA, United States,
3 Department of Health Promotion, Education and Behavior,
Arnold School of Public Health, University of South Carolina,
Columbia, SC, United States, 4 Institute for Global Food
Security, School of Human Nutrition, McGill University,
Montreal, QC,
Canada, 5 Institute for Policy Research, Northwestern
University, Evanston, IL, United States
Scale development and validation are critical to much of the
work in the health,
social, and behavioral sciences. However, the constellation of
techniques required
for scale development and evaluation can be onerous, jargon-
filled, unfamiliar, and
resource-intensive. Further, it is often not a part of graduate
training. Therefore, our
goal was to concisely review the process of scale development
in as straightforward
4. a manner as possible, both to facilitate the development of new,
valid, and reliable
scales, and to help improve existing ones. To do this, we have
created a primer for
best practices for scale development in measuring complex
phenomena. This is not
a systematic review, but rather the amalgamation of technical
literature and lessons
learned from our experiences spent creating or adapting a
number of scales over the
past several decades. We identified three phases that span nine
steps. In the first phase,
items are generated and the validity of their content is assessed.
In the second phase,
the scale is constructed. Steps in scale construction include pre-
testing the questions,
administering the survey, reducing the number of items, and
understanding how many
factors the scale captures. In the third phase, scale evaluation,
the number of dimensions
is tested, reliability is tested, and validity is assessed. We have
also added examples of
best practices to each step. In sum, this primer will equip both
scientists and practitioners
5. to understand the ontology and methodology of scale
development and validation,
thereby facilitating the advancement of our understanding of a
range of health, social,
and behavioral outcomes.
Keywords: scale development, psychometric evaluation, content
validity, item reduction, factor analysis, tests of
dimensionality, tests of reliability, tests of validity
INTRODUCTION
Scales are a manifestation of latent constructs; they measure
behaviors, attitudes, and hypothetical
scenarios we expect to exist as a result of our theoretical
understanding of the world, but cannot
assess directly (1). Scales are typically used to capture a
behavior, a feeling, or an action that cannot
be captured in a single variable or item. The use of multiple
items to measure an underlying
latent construct can additionally account for, and isolate, item-
specific measurement error, which
https://www.frontiersin.org/journals/public-health
https://www.frontiersin.org/journals/public-health%23editorial-
board
https://www.frontiersin.org/journals/public-health%23editorial-
board
https://www.frontiersin.org/journals/public-health%23editorial-
board
https://www.frontiersin.org/journals/public-health%23editorial-
board
https://doi.org/10.3389/fpubh.2018.00149
7. development in as straightforward a manner as possible, both
to facilitate the development of new, valid, and reliable scales,
and to help improve existing ones. To do this, we have created
a primer for best practices for scale development. We anticipate
this primer will be broadly applicable across many disciplines,
especially for health, social, and behavioral sciences. This is
not
a systematic review, but rather the amalgamation of technical
literature and lessons learned from our experiences spent
creating
or adapting a number of scales related to multiple disciplines
(10–23).
First, we provide an overview of each of the nine steps. Then,
within each step, we define key concepts, describe the tasks
required to achieve that step, share common pitfalls, and draw
on examples in the health, social, and behavioral sciences to
recommend best practices. We have tried to keep the material as
straightforward as possible; references to the body of technical
work have been the foundation of this primer.
SCALE DEVELOPMENT OVERVIEW
There are three phases to creating a rigorous scale—item
development, scale development, and scale evaluation (24);
these
can be further broken down into nine steps (Figure 1).
Item development, i.e., coming up with the initial set of
questions for an eventual scale, is composed of: (1)
identification
of the domain(s) and item generation, and (2) consideration
of content validity. The second phase, scale development, i.e.,
Abbreviations: A-CASI, audio computer self-assisted
interviewing; ASES,
8. adherence self-efficacy scale; CAPI, computer assisted personal
interviewing;
CFA, confirmatory factor analysis; CASIC, computer assisted
survey information
collection builder; CFI, comparative fit index; CTT, classical
test theory;
DIF, differential item functioning; EFA, exploratory factor
analysis; FIML, full
information maximum likelihood; FNE, fear of negative
evaluation; G, global
factor; ICC, intraclass correlation coefficient; ICM,
Independent cluster model;
IRT, item response theory; ODK, Open Data Kit; PAPI, paper
and pen/pencil
interviewing; QDS, Questionnaire Development System;
RMSEA, root mean
square error of approximation; SAD, social avoidance and
distress; SAS, statistical
analysis systems; SASC-R, social anxiety scale for children
revised; SEM, structural
equation model; SPSS, statistical package for the social
sciences; Stata, statistics
and data; SRMR, standardized root mean square residual of
approximation; TLI,
Tucker Lewis Index;WASH, water, sanitation, and
hygiene;WRMR, weighted root
mean square residual.
FIGURE 1 | An overview of the three phases and nine steps of
scale
development and validation.
turning individual items into a harmonious and measuring
construct, consists of (3) pre-testing questions, (4) sampling and
survey administration, (5) item reduction, and (6) extraction of
9. latent factors. The last phase, scale evaluation, requires: (7)
tests
of dimensionality, (8) tests of reliability, and (9) tests of
validity.
Frontiers in Public Health | www.frontiersin.org 2 June 2018 |
Volume 6 | Article 149
https://www.frontiersin.org/journals/public-health
https://www.frontiersin.org
https://www.frontiersin.org/journals/public-health%23articles
Boateng et al. Scale Development and Validation
TABLE 1 | The three phases and nine steps of scale
development and validation.
Activity Purpose How to explore or estimate? References
PHASE 1: ITEM DEVELOPMENT
Step 1: Identification of Domain and Item Generation: Selecting
Which Items to Ask
Domain
identification
To specify the boundaries of the domain and facilitate
item generation
1.1 Specify the purpose of the domain
1.2 Confirm that there are no existing instruments
10. 1.3 Describe the domain and provide preliminary conceptual
definition
1.4 Specify the dimensions of the domain if they exist a priori
1.5 Define each dimension
(1–4), (25)
Item generation To identify appropriate questions that fit the
identified
domain
1.6 Deductive methods: literature review and assessment of
existing scales
1.7 Inductive methods: exploratory research methodologies
including focus group discussions and interviews
(2–5), (24–41)
Step 2: Content Validity: Assessing if the Items Adequately
Measure the Domain of Interest
Evaluation by
experts
To evaluate each of the items constituting the domain for
content relevance, representativeness, and technical
11. quality
2.1 Quantify assessments of 5-7 expert judges using formalized
scaling and statistical procedures including content validity
ratio, content validity index, or Cohen’s coefficient alpha
2.2 Conduct Delphi method with expert judges
(1–5),
(24, 42–48)
Evaluation by
target population
To evaluate each item constituting the domain for
representativeness of actual experience from target
population
2.3 Conduct cognitive interviews with end users of scale items
to
evaluate face validity
(20, 25)
PHASE 2: SCALE DEVELOPMENT
Step 3: Pre-testing Questions: Ensuring the Questions and
Answers Are Meaningful
12. Cognitive
interviews
To assess the extent to which questions reflect the
domain of interest and that answers produce valid
measurements
3.1 Administer draft questions to 5–15 interviewees in 2–3
rounds
while allowing respondents to verbalize the mental process
entailed in providing answers
(49–54)
Step 4: Survey Administration and Sample Size: Gathering
Enough Data from the Right People
Survey
administration
To collect data with minimum measurement errors 4.1
Administer potential scale items on a sample that reflects
range of target population using paper or device
(55–58)
Establishing the
13. sample size
To ensure the availability of sufficient data for scale
development
4.2 Recommended sample size is 10 respondents per survey
item and/or 200-300 observations
(29, 59–65)
Determining the
type of data to use
To ensure the availability of data for scale development
and validation
4.3 Use cross-sectional data for exploratory factor analysis
4.4 Use data from a second time point, at least 3 months later in
a longitudinal dataset, or an independent sample for test of
dimensionality (Step 7)
–
Step 5: Item Reduction: Ensuring Your Scale Is Parsimonious
Item difficulty index To determine the proportion of correct
answers given per
item (CTT)
14. To determine the probability of a particular examinee
correctly answering a given item (IRT)
5.1 Proportion can be calculated for CTT and item difficulty
parameter estimated for IRT using statistical packages
(1, 2, 66–68)
(Continued)
Frontiers in Public Health | www.frontiersin.org 3 June 2018 |
Volume 6 | Article 149
https://www.frontiersin.org/journals/public-health
https://www.frontiersin.org
https://www.frontiersin.org/journals/public-health%23articles
Boateng et al. Scale Development and Validation
TABLE 1 | Continued
Activity Purpose How to explore or estimate? References
Item discrimination
test
To determine the degree to which an item or set of test
questions are measuring a unitary attribute (CTT)
To determine how steeply the probability of correct
15. response changes as ability increases (IRT)
5.2 Estimate biserial correlations or item discrimination
parameter
using statistical packages
(69–75)
Inter-item and
item-total
correlations
To determine the correlations between scale items, as
well as the correlations between each item and sum
score of scale items
5.3 Estimate inter-item/item communalities, item-total, and
adjusted item-total correlations using statistical packages
(1, 2, 68, 76)
Distractor
efficiency analysis
To determine the distribution of incorrect options and
how they contribute to the quality of items
16. 5.4 Estimate distractor analysis using statistical packages (77–
80)
Deleting or
imputing missing
cases
To ensure the availability of complete cases for scale
development
5.5 Delete items with many cases that are permanently missing,
or use multiple imputation or full information maximum
likelihood for imputation of data
(81–84)
Step 6: Extraction of Factors: Exploring the Number of Latent
Constructs that Fit Your Observed Data
Factor analysis To determine the optimal number of factors or
domains
that fit a set of items
6.1 Use scree plots, exploratory factor analysis, parallel
analysis,
minimum average partial procedure, and/or the Hull method
(2–4), (85–90)
17. PHASE 3: SCALE EVALUTION
Step 7: Tests of Dimensionality: Testing if Latent Constructs
Are as Hypothesized
Test dimensionality To address queries on the latent structure of
scale items
and their underlying relationships. i.e., to validate
whether the previous hypothetical structure fits the items
7.1 Estimate independent cluster model—confirmatory factor
analysis, cf. Table 2
7.2 Estimate bifactor models to eliminate ambiguity about the
type of dimensionality—unidimensionality, bidimensionality, or
multi-dimensionality
7.3 Estimate measurement invariance to determine whether
hypothesized factor and dimension is congruent across
groups or multiple samples
(91–114)
Score scale items To create scale scores for substantive analysis
including
reliability and validity of scale
7.4. calculate scale scores using an unweighted approach, which
18. includes summing standardized item scores and raw item
scores, or computing the mean for raw item scores
7.5. Calculate scale scores by using a weighted approach, which
includes creating factor scores via confirmatory factor
analysis or structural equation models
(115)
Step 8: Tests of Reliability: Establishing if Responses Are
Consistent When Repeated
Calculate reliability
statistics
To assess the internal consistency of the scale. i.e., the
degree to which the set of items in the scale co-vary,
relative to their sum score
8.1 Estimate using Cronbach’s alpha
8.2. Other tests such as Raykov’s rho, ordinal alpha, and
Revelle’s
beta can be used to assess scale reliability
(116–123)
Test–retest
19. reliability
To assess the degree to which the participant’s
performance is repeatable; i.e., how consistent their
scores are across time
8.3 Estimate the strength of the relationship between scale items
over two or three time points; variety of measures possible
(1, 2, 124,
125)
Step 9: Tests of Validity: Ensuring You Measure the Latent
Dimension You Intended
Criterion validity
Predictive validity To determine if scores predict future
outcomes 9.1 Use bivariate and multivariable regression;
stronger and
significant associations or causal effects suggest greater
predictive validity
(1, 2, 31)
(Continued)
Frontiers in Public Health | www.frontiersin.org 4 June 2018 |
Volume 6 | Article 149
20. https://www.frontiersin.org/journals/public-health
https://www.frontiersin.org
https://www.frontiersin.org/journals/public-health%23articles
Boateng et al. Scale Development and Validation
TABLE 1 | Continued
Activity Purpose How to explore or estimate? References
Concurrent validity To determine the extent to which scale
scores have a
stronger relationship with criterion measurements made
near the time of administration
9.2 Estimate the association between scale scores and “gold
standard” of scale measurement; stronger significant
association in Pearson product-moment correlation suggests
support for concurrent validity
(2)
Construct validity
Convergent validity To examine if the same concept measured
in different
ways yields similar results
21. 9.3 Estimate the relationship between scale scores and similar
constructs using multi-trait multi-method matrix, latent
variable modeling, or Pearson product-moment coefficient;
higher/stronger correlation coefficients suggest support for
convergent validity
(2, 37, 126)
Discriminant
validity
To examine if the concept measured is different from
some other concept
9.4 Estimate the relationship between scale scores and distinct
constructs using multi-trait multi-method matrix, latent
variable modeling, or Pearson product-moment coefficient;
lower/weaker correlation coefficients suggest support for
discriminant validity
(2, 37, 126)
Differentiation by
“known groups”
22. To examine if the concept measured behaves as
expected in relation to “known groups”
9.5 Select known binary variables based on theoretical and
empirical knowledge and determine the distribution of the
scale scores over the known groups; use t-tests if binary,
ANOVA if multiple groups
(2, 126)
Correlation
analysis
To determine the relationship between existing measures
or variables and newly developed scale scores
9.6 Correlate scale scores and existing measures or, preferably,
use linear regression, intraclass correlation coefficient, and
analysis of standard deviations of the differences between
scores
(2, 127, 128)
PHASE 1: ITEM DEVELOPMENT
Step 1: Identification of the Domain(s) and
Item Generation
23. Domain Identification
The first step is to articulate the domain(s) that you are
endeavoring to measure. A domain or construct refers to the
concept, attribute, or unobserved behavior that is the target of
the study (25). Therefore, the domain being examined should
be decided upon and defined before any item activity (2). A
well-defined domain will provide a working knowledge of the
phenomenon under study, specify the boundaries of the domain,
and ease the process of item generation and content validation.
McCoach et al. outline a number of steps in scale development;
we find the first five to be suitable for the identification of
domain (4). These are all based on thorough literature review
and
include (a) specifying the purpose of the domain or construct
you seek to develop, and (b), confirming that there are no
existing instruments that will adequately serve the same
purpose.
Where there is a similar instrument in existence, you need to
justify why the development of a new instrument is appropriate
and how it will differ from existing instruments. Then, (c)
describe the domain and provide a preliminary conceptual
definition and (d) specify, if any, the dimensions of the domain.
Alternatively, you can let the number of dimensions forming
the domain to be determined through statistical computation
(cf. Steps 5, 6, and 7). Domains are determined a priori if there
is an established framework or theory guiding the study, but a
posteriori if none exist. Finally, if domains are identified a
priori,
(e) the final conceptual definition for each domain should be
specified.
Item Generation
Once the domain is delineated, the item pool can then be
identified. This process is also called “question development”
(26) or “item generation” (24). There are two ways to identify
24. appropriate questions: deductive and inductive methods (24).
The deductive method, also known as “logical partitioning”
or “classification from above” (27) is based on the description
of
the relevant domain and the identification of items. This can be
done through literature review and assessment of existing scales
and indicators of that domain (2, 24). The inductive method,
also known as “grouping” or “classification from below” (24,
27)
involves the generation of items from the responses of
individuals
(24). Qualitative data obtained through direct observations and
exploratory research methodologies, such as focus groups and
individual interviews, can be used to inductively identify
domain
items (5).
It is considered best practice to combine both deductive and
inductive methods to both define the domain and identify the
questions to assess it. While the literature review provides the
theoretical basis for defining the domain, the use of qualitative
techniques moves the domain from an abstract point to the
identification of its manifest forms. A scale or construct defined
by theoretical underpinnings is better placed to make specific
pragmatic decisions about the domain (28), as the construct will
be based on accumulated knowledge of existing items.
It is recommended that the items identified using deductive
and inductive approaches should be broader and more
comprehensive than one’s own theoretical view of the target
(28, 29). Further, content should be included that ultimately
will
be shown to be tangential or unrelated to the core construct.
In other words, one should not hesitate to have items on the
25. Frontiers in Public Health | www.frontiersin.org 5 June 2018 |
Volume 6 | Article 149
https://www.frontiersin.org/journals/public-health
https://www.frontiersin.org
https://www.frontiersin.org/journals/public-health%23articles
Boateng et al. Scale Development and Validation
scale that do not perfectly fit the domain identified, as
successive
evaluation will eliminate undesirable items from the initial
pool.
Kline and Schinka et al. note that the initial pool of items
developed should be atminimum twice as long as the desired
final
scale (26, 30). Others have recommended the initial pool to be
five
times as large as the final version, to provide the requisite
margin
to select an optimum combination of items (30). We agree with
Kline and Schinka et al. (26, 30) that the number of items
should
be at least twice as long as the desired scale.
Further, in the development of items, the form of the items,
the wording of the items, and the types of responses that the
question is designed to induce should be taken into account.
It also means questions should capture the lived experiences
of the phenomenon by target population (30). Further, items
should be worded simply and unambiguously. Items should not
be offensive or potentially biased in terms of social identity,
i.e., gender, religion, ethnicity, race, economic status, or sexual
orientation (30).
26. Fowler identified five essential characteristics of items
required to ensure the quality of construct measurement (31).
These include (a) the need for items to be consistently
understood; (b) the need for items to be consistently
administered or communicated to respondents; (c) the consistent
communication of what constitutes an adequate answer; (d)
the need for all respondents to have access to the information
needed to answer the question accurately; and (e) the
willingness
for respondents to provide the correct answers required by the
question at all times.
These essentials are sometimes very difficult to achieve.
Krosnick (32) suggests that respondents can be less thoughtful
about the meaning of a question, search their memories less
comprehensively, integrate retrieved information less carefully,
or even select a less precise response choice. All this means
that they are merely satisficing, i.e., providing merely
satisfactory
answers, rather than the most accurate ones. In order to combat
this behavior, questions should be kept simple, straightforward,
and should follow the conventions of normal conversation.
With regards to the type of responses to these questions,
we recommend that questions with dichotomous response
categories (e.g., true/false) should have no ambiguity. When a
Likert-type response scale is used, the points on the scale
should
reflect the entire measurement continuum. Responses should
be presented in an ordinal manner, i.e., in an ascending order
without any overlap, and each point on the response scale
should
be meaningful and interpreted the same way by each participant
to ensure data quality (33).
In terms of the number of points on the response scale,
27. Krosnick and Presser (33) showed that responses with just two
to three points have lower reliability than Likert-type response
scales with five to seven points. However, the gain levels off
after seven points. Therefore, response scales with five points
are
recommended for unipolar items, i.e., those reflecting relative
degrees of a single item response quality, e.g., not at all
satisfied to
very satisfied. Seven response items are recommended for
bipolar
items, i.e., those reflecting relative degrees of two qualities of
an
item response scale, e.g., completely dissatisfied to completely
satisfied. As an analytic aside, items with scale points fewer
than five categories are best estimated using robust categorical
methods. However, items with five to seven categories without
strong floor or ceiling effects can be treated as continuous items
in confirmatory factor analysis and structural equation modeling
using maximum likelihood estimations (34).
One pitfall in the identification of domain and item
generation is the improper conceptualization and definition of
the domain(s). This can result in scales that may either be
deficient because the definition of the domain is ambiguous
or has been inadequately defined (35). It can also result in
contamination, i.e., the definition of the domain overlaps with
other existing constructs in the same field (35).
Caution should also be taken to avoid construct
underrepresentation, which is when a scale does not capture
important aspects of a construct because its focus is too narrow
(35, 36). Further, construct-irrelevant variance, which is the
degree to which test scores are influenced by processes that
have
little to do with the intended construct and seem to be widely
28. inclusive of non-related items (36, 37), should be avoided. Both
construct underrepresentation and irrelevant variance can lead
to the invalidation of the scale (36).
An example of best practice using the deductive approach to
item generation is found in the work of Dennis on breastfeeding
self-efficacy (38–40). Dennis’ breastfeeding self-efficacy scale
items were first informed by Bandura’s theory on self-efficacy,
followed by content analysis of literature review, and empirical
studies on breastfeeding-related confidence.
A valuable example for a rigorous inductive approach is found
in the work of Frongillo and Nanama on the development and
validation of an experience-based measure of household food
insecurity in northern Burkina Faso (41). In order to generate
items for the measure, they undertook in-depth interviews with
10 household heads and 26 women using interview guides. The
data from these interviews were thematically analyzed, with the
results informing the identification of items to be added or
deleted from the initial questionnaire. Also, the interviews led
to
the development and revision of answer choices.
Step 2: Content Validity
Content validity, also known as “theoretical analysis” (5), refers
to the “adequacy with which a measure assesses the domain
of interest” (24). The need for content adequacy is vital if the
items are to measure what they are presumed to measure (1).
Additionally, content validity specifies content relevance and
content representations, i.e., that the items capture the relevant
experience of the target population being examined (129).
Content validity entails the process of ensuring that only
the phenomenon spelled out in the conceptual definition, but
not other aspects that “might be related but are outside the
investigator’s intent for that particular [construct] are added”
29. (1). Guion has proposed five conditions that must be satisfied
in order for one to claim any form of content validity. We find
these conditions to be broadly applicable to scale development
in any discipline. These include that (a) the behavioral content
has a generally accepted meaning or definition; (b) the domain
is unambiguously defined; (c) the content domain is relevant to
the purposes of measurement; (d) qualified judges agree that the
…
EDITORIAL
published: 02 August 2017
doi: 10.3389/fpsyg.2017.01338
Frontiers in Psychology | www.frontiersin.org 1 August 2017 |
Volume 8 | Article 1338
Edited and reviewed by:
Marina A. Pavlova,
University of Tübingen, Germany
*Correspondence:
Andrew H. Kemp
[email protected]
Specialty section:
This article was submitted to
Emotion Science,
30. a section of the journal
Frontiers in Psychology
Received: 21 June 2017
Accepted: 20 July 2017
Published: 02 August 2017
Citation:
Kemp AH (2017) Editorial:
Mechanisms Underpinning the Link
between Emotion, Physical Health,
and Longevity. Front. Psychol. 8:1338.
doi: 10.3389/fpsyg.2017.01338
Editorial: Mechanisms Underpinning
the Link between Emotion, Physical
Health, and Longevity
Andrew H. Kemp1, 2*
1 Department of Psychology and the Health and Wellbeing
Academy, College of Human and Health Sciences, Swansea
University, Swansea, United Kingdom, 2 School of Psychology
and Discipline of Psychiatry, University of Sydney, Sydney,
NSW, Australia
31. Keywords: emotion, health, wellbeing, morbidity and mortality,
longevity, stress, vagal function, GENIAL model
Editorial on the Research Topic
Mechanisms Underpinning the Link between Emotion, Physical
Health, and Longevity
The study of emotion has been likened to the 100 Years War
between England and France
(Lindquist et al., 2013), a conflict that may relate, in part, to
intense research interest on the brain,
largely side-lining the body as a passive observer. However,
research on the link between the brain
and body may help to develop a more informed basis on which
to understand our emotions.
Such research also has important implications for premature
morbidity and mortality. Each article
published in this special issue and research topic is now briefly
described, focusing on the main
findings and relevance for better understanding the links
between emotion, physical health, and
longevity.
In the first article of this issue, Kemp et al. report on
associations between common mental
disorders and coronary heart disease (CHD), conditions that
impose considerable burden on
society. In their large epidemiological cohort study on the
Brazilian population, participants
with psychiatric comorbidity display a threefold increase in
CHD, while a 1.5- to 2-fold increase
was observed for non-comorbid conditions. Also in the issue,
the same authors demonstrate
that tricyclic medications—a class of antidepressants freely
32. dispensed in Brazilian public health
pharmacies—are associated with a twofold increase in CHD,
relative to non-use. These findings
highlight an urgent need for better understanding how extreme
negative emotions—and their
treatments—might impact on physical health over the longer
term, just as other studies discussed
below point to the need for greater insight into how positive
health behaviors more commonly
associated with physical wellbeing (e.g., exercise, diet) can
improve emotional and mental health.
The biopsychosocial pathway to premature morbidity and
mortality is a complex one, involving
a host of closely intertwined mechanisms (Kemp and Quintana,
2013; Kemp et al., 2016b,
in press), some of which are investigated in contributions to this
special issue. One of these
mechanisms includes ongoing unconscious emotion processing,
which may contribute to adverse
health outcomes. In this regard, a study in the issue by van der
Ploeg et al. examines the
validity of the Implicit Positive and Negative A!ect Test
(IPANAT; Quirin et al., 2009; Brosschot
et al., 2014) and investigates whether changes in unconscious
emotions (as measured by the
IPANAT) relate to changes in a variety of physiological
parameters. The IPANAT requires
participants to rate six artificial words (vikes, tunba, ronpe,
belni, sukov, safme) on six emotional
adjectives (happy, cheerful, energetic, helpless, tense,
inhibited) using a six-point Likert scale.
Higher implicit negative a!ect was associated with higher
systolic blood pressure, lower heart
rate variability (HRV) and total peripheral resistance, and
slower recovery of diastolic blood
33. pressure. Also in the issue by the same research group,
(Mossink et al.) subjective stress,
worry and a!ect were measured over a 24-h period in addition to
cortisol levels in saliva.
http://www.frontiersin.org/Psychology
http://www.frontiersin.org/Psychology/editorialboard
http://www.frontiersin.org/Psychology/editorialboard
http://www.frontiersin.org/Psychology/editorialboard
http://www.frontiersin.org/Psychology/editorialboard
https://doi.org/10.3389/fpsyg.2017.01338
http://crossmark.crossref.org/dialog/?doi=10.3389/fpsyg.2017.0
1338&domain=pdf&date_stamp=2017-08-02
http://www.frontiersin.org/Psychology
http://www.frontiersin.org
http://www.frontiersin.org/Psychology/archive
https://creativecommons.org/licenses/by/4.0/
mailto:[email protected]
https://doi.org/10.3389/fpsyg.2017.01338
http://journal.frontiersin.org/article/10.3389/fpsyg.2017.01338/f
ull
http://loop.frontiersin.org/people/77673/overview
http://journal.frontiersin.org/researchtopic/2668/mechanisms-
underpinning-the-link-between-emotion-physical-health-and-
longevity
https://doi.org/10.3389/fpsyg.2015.00187
https://doi.org/10.3389/fpsyg.2016.00425
https://doi.org/10.3389/fpsyg.2015.00111
Kemp From Psychological Moments to Longevity
Implicit negativity bias was associated with increased cortisol
levels, and higher levels of implicit sadness were associated
with a stronger cortisol rise the next day. Research has seldom
explored the physiological impacts of unconscious stress and
34. further research in this area is needed.
A commonly measured variable in studies on stress is
HRV. Unfortunately, researchers typically consider HRV as
an epiphenomenon of the stress response (e.g., Friedman and
Kern, 2014), rather than—as we would contend—a marker
of vagal function responsible for a host of psychological and
physiological processes that influence social ties and
subsequent
health and wellbeing (Kemp et al., in press). Also in the issue, a
study by Porges et al. reports that individuals with lower vagal
function respond with greater increases in salivary testosterone
in response to observed violence. This finding was interpreted
in
line with a hierarchical model of autonomic activity (polyvagal
theory; Porges, 2011) such that those with lower vagal function
may be more vulnerable to environmental threat, increasing the
potential for interpersonal conflict. The authors suggest that
individuals with lower vagal function may have di"culties with
emotional regulation, a suggestion that is supported by another
article in the issue by Williams et al.
Reduced vagal function is also commonly reported in
patients with a variety of psychiatric disorders, especially major
depression (Kemp et al., 2010; Brunoni et al., 2013) and
generalized anxiety disorder (Chalmers et al., 2014; Kemp et
al.,
2014). However, contradictory findings have also been reported,
motivating another study in the issue by Kemp et al. Patients
with melancholic depression were found to display increased
heart rate and lower resting-state HRV relative to non-depressed
controls. One explanation for the contradictory findings in the
literature is that past studies have focused on major depressive
disorder, rather than more homogeneous subtypes of depression
such as melancholia. Critically, over the longer term these
cardiac alterations may contribute to increased risk for
35. premature
morbidity and mortality. This possibility is supported by a
recent meta-analysis on 21,988 participants without known
cardiovascular disease (Hillebrand et al., 2013), reporting that
vagal impairment predicts adverse cardiovascular events up to
15
years later.
Together, these findings have important implications for
future research in this area, although it is also worth reminding
newcomers about some of the methodological challenges, a
motivation for including the paper by Quintana and Heathers in
the issue.
Another area of research that has attracted considerable
attention is the extent to which people are able to perceive and
regulate visceral information from the body, a skill known as
interoceptive ability. Interoceptive signals are communicated by
the vagus nerve and a dedicated lamina-1 spinothalamocortical
pathway to interoceptive centers in the brain (Craig, 2002,
2014;
Critchley et al., 2004; Kemp et al., 2015). Atypical
interoceptive
sensitivity has been associated with psychopathology in
adolescence and decreased socio-emotional competence in
adulthood (Murphy et al., 2017). Another article in the issue
by Jones et al. examined neural substrates for the volitional
regulation of heart rate. Participants were instructed to either
increase or decrease the level of an on-screen thermometer
reflecting heart rate by either volitionally increasing or
decreasing heart rate, respectively. Results demonstrate that
heart rate during the arousal condition (76 bpm) significantly
di!ered from the relaxation condition (72 bpm) indicating that
instructions to participants had their desired e!ect. Decreases
in heart rate were associated with activation of ventrolateral
36. prefrontal and parietal cortices, regions known to be involved
in cognitive reappraisal, and selective attention, respectively.
Interestingly, participants could increase heart rate without any
corresponding change in respiration, which may in part explain
the relatively small observed changes in heart rate. Heart rate
change also negatively correlated with anxiety scores. While
no participant scored above the clinical threshold for anxiety,
participants with more anxiety symptoms were less able to
regulate their heart rate. Heart rate biofeedback training with
a focus on prolonging the out-breath may help to diminish
anxiety symptoms (Wells et al., 2012) and have a place in the
management of anxiety disorders.
The study by Mallorquí-Bagué et al. in the issue examines
the link between anxiety, a!ective reactivity and interoception
in
otherwise healthy people with joint hypermobility, an inherited
condition associated with the expression of a common variation
in the connective tissue protein, collagen. Hypermobility was
assessed by asking participants whether they could touch the
floor
with their hands without bending their knees. Interestingly,
joint
hypermobility is associated with increased risk of anxiety and
related disorders (Sanches et al., 2012). Interoception was found
to mediate a positive association between joint hypermobility
and state anxiety such that hypermobility is associated with
heightened interoceptive sensitivity, which then contributes
to state anxiety. Also reported was greater activation in the
hypermobile group relative to controls during processing of
sad vs. neutral images within a discrete set of brain regions
associated with emotional processing. These findings highlight
the dependence of emotional state on bodily context and further
our understanding of how vulnerability to anxiety disorder
might
arise.
37. In another article of this issue, the study by Couto et al.
examined two rare patients with respective damage of focal
lesions to the insular cortex and to its subcortical tracts.
Internally generated interoceptive streams were assessed
through
a heartbeat detection task, while externally triggered streams
were examined via taste, smell, and pain recognition tasks. The
patient with a lesion to the insula cortex displayed impaired
internal signal processing while the patient with the subcortical
lesion exhibited external perception deficits. The authors argue
that the subcortical lesion may disrupt integrative contextual
processing—spared in the patient with focal insula lesion—via a
fronto-insulo-temporal network including the insula cortex as a
critical hub. Importantly, this distinctive pattern was replicated
when comparing patients’ performance to that of subjects with
lesions in other regions. This helps to confirm that the observed
pattern of deficits relates to specific lesions rather than to
nonspecific brain damage. These results point to a stratification
of multimodal bodily signals that subsequently contribute to
emotional awareness.
Frontiers in Psychology | www.frontiersin.org 2 August 2017 |
Volume 8 | Article 1338
https://doi.org/10.3389/fpsyg.2015.00019
https://doi.org/10.3389/fpsyg.2015.00261
https://doi.org/%2010.3389/fpsyg.2014.01387
https://doi.org/10.3389/fpsyg.2014.00805
https://doi.org/10.3389/fpsyg.2015.00300
https://doi.org/10.3389/fpsyg.2014.01162
https://doi.org/10.3389/fpsyg.2015.00503
http://www.frontiersin.org/Psychology
http://www.frontiersin.org
http://www.frontiersin.org/Psychology/archive
38. Kemp From Psychological Moments to Longevity
Considering evidence that antidepressant medications are not
as safe as they were once believed (Licht et al., 2010; Kemp
et al., 2014, 2016a), it is likely that positive health behaviors
will play an increasingly important role in the management of
mental health conditions. In their opinion article, Dash et al.
make a strong argument in the issue for greater recognition
that diet is a risk factor for common mental disorders and
for public health strategies focused on dietary improvement.
They argue that the physical health of patients should be
given equal priority as a treatment target when considering
patient mental health, and highlight the importance of a diet
characterized by fruits, vegetables, whole grains, nuts, seeds,
and fish while limiting intake of processed foods (Opie et al.,
2015; see also: Jacka, 2017). Also in the issue, the study by
Grung et al. focuses on the beneficial physiological e!ects of
a fish diet on psychiatric inpatients including improved HRV,
which are indices of emotional regulation as well as physical
health. Two other papers in the issue focus on the e!ects
of physical activity in bipolar disorder (Thomson et al.) and
traumatic brain injury (TBI; Rzezak et al.). Also in the issue,
the study by Garland et al. demonstrates that mindfulness may
help to maintain trait positive a!ect and momentary positive
cognitions in an upward spiral. Together, these articles
highlight
the utility of non-pharmacological options for improving health
and wellbeing and provide some guidance on underlying
mechanisms. Further research is needed to better inform and
underpin the development of non-pharmacological interventions
for mental-health conditions.
In the final study of the issue, IJzerman et al. suggest
how relationship therapy might be modernized, a proposal
39. that builds on Social Thermoregulation Theory (IJzerman
et al., 2015). According to this theory, humans may adapt
social behaviors and cognitions to temperature changes. For
example, the authors describe how emotions like anxiety and
sadness are associated with lower peripheral temperature, and
that people respond to others’ sadness with an increase in
temperature. The authors explain that thermoregulation is
crucial for survival and that individual di!erences in the need
for thermoregulation may even predict attachment styles, health,
and wellbeing. While the research in this area is still in
its early stages, the links to social ties and health outcomes
is intriguing, and is supported by an increasing body of
evidence that was recently captured by the GENIAL model
(Genomics—Environment—vagus Nerve—social Interaction—
Allostatic regulation—Longevity; Kemp et al., in press).
In conclusion, all papers included in the special issue
provide new insights into the pathways linking emotion,
physical health, and longevity. Future research in this area
would benefit from moving beyond the disciplinary dilemma,
initiating multi-disciplinary exchange and facilitating new lines
of interdisciplinary enquiry to better understand the complex
pathways from emotion to longevity. The GENIAL model
(Kemp et al., in press) is a first attempt to do exactly this
and provides a foundation on which future research could be
based.
AUTHOR CONTRIBUTIONS
The author confirms being the sole contributor of this work and
approved it for publication.
REFERENCES
Brosschot, J. F., Geurts, S. A. E., Kruizinga, I., Radstaak, M.,
Verkuil, B., Quirin, M.,
40. et al. (2014). Does unconscious stress play a role in prolonged
cardiovascular
stress recovery? Stress Health 30, 179–187. doi:
10.1002/smi.2590
Brunoni, A. R., Kemp, A. H., Dantas, E. M., Goulart, A. C.,
Nunes, M. A.,
Boggio, P. S., et al. (2013). Heart rate variability is a trait
marker of major
depressive disorder: evidence from the sertraline vs. electric
current therapy
to treat depression clinical study. Int. J. Neuropsychopharm. 16,
1937–1949.
doi: 10.1017/S1461145713000497
Chalmers, J. A., Quintana, D. S., Abbott, M. J.-A., and Kemp,
A. H. (2014). Anxiety
disorders are associated with reduced heart rate variability: a
meta-analysis.
Front. Psychiatry 5:80. doi: 10.3389/fpsyt.2014.00080
Craig, A. D. (2002). How do you feel? Interoception: the sense
of the physiological
condition of the body. Nat. Rev. Neurosci. 3, 655–666. doi:
10.1038/nrn894
Craig, A. D. B. (2014). How Do You Feel? Princeton, NJ:
Princeton University Press.
Critchley, H. D., Wiens, S., Rotshtein, P., Öhman, A., and
Dolan, R. J. (2004).
Neural systems supporting interoceptive awareness. Nat
Neurosci. 7, 189–195.
doi: 10.1038/nn1176
Friedman, H. S., and Kern, M. L. (2014). Personality, well-
41. being, and health. Annu.
Rev. Psychol. 65, 719–742. doi: 10.1146/annurev-psych-
010213-115123
Hillebrand, S., Gast, K. B., de Mutsert, R., Swenne, C. A.,
Jukema, J. W.,
Middeldorp, S., et al. (2013). Heart rate variability and first
cardiovascular event
in populations without known cardiovascular disease: meta-
analysis and dose-
response meta-regression. Europace 15, 742–749. doi:
10.1093/europace/eus341
IJzerman, H., Coan, J. A., Wagemans, F. M. A., Missler, M. A.,
van Beest, I.,
Lindenberg, S., et al. (2015). A theory of social
thermoregulation in human
primates. Front. Psychol. 6:464. doi: 10.3389/fpsyg.2015.00464
Jacka, F. N. (2017). Nutritional psychiatry: where to next?
EBioMedicine 17, 24–29.
doi: 10.1016/j.ebiom.2017.02.020
Kemp, A. H., and Quintana, D. S. (2013). The relationship
between mental
and physical health: insights from the study of heart rate
variability. Int. J.
Psychophysiol. 89, 288–296. doi:
10.1016/j.ijpsycho.2013.06.018
Kemp, A. H., Arias, J. A., and Fisher, Z. (in press). “Social ties,
health and wellbeing:
a literature review and model,” in Neuroscience and Social
Science: The Missing
Link, eds A. Ibanez, L. Sedeno, and A. M. García (Springer
International).
42. Kemp, A. H., Brunoni, A. R., Santos, I. S., Nunes, M. A.,
Dantas, E. M.,
Carvalho de Figueiredo, R., et al. (2014). E!ects of depression,
anxiety,
comorbidity, and antidepressants on resting-state heart rate and
its variability:
an ELSA-Brasil cohort baseline study. Am. J. Psychiatry 171,
1328–1334.
doi: 10.1176/appi.ajp.2014.13121605
Kemp, A. H., Fráguas, R., Brunoni, A. R., Bittencourt, M. S.,
Nunes, M. A., Dantas,
E. M., et al. (2016a). Di!erential associations of specific
selective serotonin
reuptake inhibitors with resting-state heart rate and heart rate
variability.
Psychosom. Med. 78, 810–818. doi:
10.1097/PSY.0000000000000336
Kemp, A. H., Krygier, J., and Harmon-Jones, E. (2015).
“Neuroscientific
perspectives of emotion,” in Handbook of A!ective Computing,
eds R. A. Calvo,
S. D’Mello, J. Gratch, and A. Kappas (New York, NY: Oxford
University Press),
38–53.
Kemp, A. H., López, S. R., Passos, V. M. A., Bittencourt, M. S.,
Dantas, E.
M., Mill, J. G., et al. (2016b). Insulin resistance and carotid
intima-media
thickness mediate the association between resting-state heart
rate variability
and executive function: a path modelling study. Biol Psychol.
117, 216–224.
43. doi: 10.1016/j.biopsycho.2016.04.006
Kemp, A. H., Quintana, D. S., Gray, M. A., Felmingham, K. L.,
Brown, K., and
Gatt, J. M. (2010). Impact of depression and antidepressant
treatment on heart
Frontiers in Psychology | www.frontiersin.org 3 August 2017 |
Volume 8 | Article 1338
https://doi.org/10.3389/fpubh.2016.00081
https://doi.org/10.3389/fpsyg.2015.00135
https://doi.org/10.3389/fpsyg.2015.00147
https://doi.org/10.3389/fpsyg.2015.00839
https://doi.org/10.3389/fpsyg.2015.00015
https://doi.org/10.3389/fpsyg.2017.0063
https://doi.org/10.1002/smi.2590
https://doi.org/10.1017/S1461145713000497
https://doi.org/10.3389/fpsyt.2014.00080
https://doi.org/10.1038/nrn894
https://doi.org/10.1038/nn1176
https://doi.org/10.1146/annurev-psych-010213-115123
https://doi.org/10.1093/europace/eus341
https://doi.org/10.3389/fpsyg.2015.00464
https://doi.org/10.1016/j.ebiom.2017.02.020
https://doi.org/10.1016/j.ijpsycho.2013.06.018
https://doi.org/10.1176/appi.ajp.2014.13121605
https://doi.org/10.1097/PSY.0000000000000336
https://doi.org/10.1016/j.biopsycho.2016.04.006
http://www.frontiersin.org/Psychology
http://www.frontiersin.org
http://www.frontiersin.org/Psychology/archive
Kemp From Psychological Moments to Longevity
44. rate variability: a review and meta-analysis. Biol. Psychiatry
67, 1067–1074.
doi: 10.1016/j.biopsych.2009.12.012
Licht, C. M. M., de Geus, E. J. C., van Dyck, R., and Penninx,
B. W. J. H.
(2010). Longitudinal evidence for unfavorable e!ects of
antidepressants on
heart rate variability. Biol. Psychiatry 68, 861–868. doi:
10.1016/j.biopsych.2010.
06.032
Lindquist, K., Siegel, E. H., Quigley, K. S., and Barrett, L. F.
(2013). The hundred-
year emotion war: are emotions natural kinds or psychological
constructions?
Comment on Lench, Flores, and Bench (2011). Psychol Bull.
139, 255–263.
doi: 10.1037/a0029038
Murphy, J., Brewer, R., Catmur, C., and Bird, G. (2017).
Interoception and
psychopathology: a developmental neuroscience perspective.
Dev. Cogn.
Neurosci. 23, 45–56. doi: 10.1016/j.dcn.2016.12.006
Opie, R. S., O’Neil, A., Itsiopoulos, C., and Jacka, F. N. (2015).
The impact of whole-of-diet interventions on depression and
anxiety: a systematic review of randomised controlled trials.
Public Health Nutr. 18, 2074–2093. doi: 10.1017/S13689800140
02614
Porges, S. W. (2011). The Polyvagal Theory:
Neurophysiological Foundations of
Emotions, Attachment, Communication, and Self-Regulation.
New York, NY:
46. cited, in accordance
with accepted academic practice. No use, distribution or
reproduction is permitted
which does not comply with these terms.
Frontiers in Psychology | www.frontiersin.org 4 August 2017 |
Volume 8 | Article 1338
https://doi.org/10.1016/j.biopsych.2009.12.012
https://doi.org/10.1016/j.biopsych.2010.06.032
https://doi.org/10.1037/a0029038
https://doi.org/10.1016/j.dcn.2016.12.006
https://doi.org/10.1017/S1368980014002614
https://doi.org/10.1037/a0016063
https://doi.org/10.1016/S1516-4446(12)70054-5
https://doi.org/10.1371/journal.pone.0046597
http://creativecommons.org/licenses/by/4.0/
http://creativecommons.org/licenses/by/4.0/
http://creativecommons.org/licenses/by/4.0/
http://creativecommons.org/licenses/by/4.0/
http://creativecommons.org/licenses/by/4.0/
http://www.frontiersin.org/Psychology
http://www.frontiersin.org
http://www.frontiersin.org/Psychology/archiveEditorial:
Mechanisms Underpinning the Link between Emotion, Physical
Health, and LongevityAuthor ContributionsReferences
fpsyg-08-00635 April 27, 2017 Time: 14:49 # 1
HYPOTHESIS AND THEORY
published: 01 May 2017
doi: 10.3389/fpsyg.2017.00635
47. Edited by:
Andrew Kemp,
Swansea University, UK
Reviewed by:
Justine Megan Gatt,
University of New South Wales,
Australia
Wataru Sato,
Kyoto University, Japan
*Correspondence:
Hans IJzerman
[email protected]
Specialty section:
This article was submitted to
Emotion Science,
a section of the journal
Frontiers in Psychology
Received: 11 July 2016
Accepted: 10 April 2017
Published: 01 May 2017
Citation:
IJzerman H, Heine ECE, Nagel SK
and Pronk TM (2017) Modernizing
Relationship Therapy through Social
Thermoregulation Theory: Evidence,
48. Hypotheses, and Explorations.
Front. Psychol. 8:635.
doi: 10.3389/fpsyg.2017.00635
Modernizing Relationship Therapy
through Social Thermoregulation
Theory: Evidence, Hypotheses, and
Explorations
Hans IJzerman1*, Emma C. E. Heine
2, Saskia K. Nagel3 and Tila M. Pronk4
1 Department of Psychology, University of Virginia,
Charlottesville, VA, USA, 2 Department of Clinical
Psychology, Vrije
Universiteit Amsterdam, Amsterdam, Netherlands, 3
Department of Philosophy, University of Twente, Enschede,
Netherlands, 4 Department of Social and Organisational
Psychology, Tilburg University, Tilburg, Netherlands
In the present article the authors propose to modernize
relationship therapy by
integrating novel sensor and actuator technologies that can help
optimize people’s
thermoregulation, especially as they pertain to social contexts.
Specifically, they propose
to integrate Social Thermoregulation Theory (IJzerman et al.,
2015a; IJzerman and
Hogerzeil, 2017) into Emotionally Focused Therapy by first
doing exploratory research
during couples’ therapy, followed by Randomized Clinical
49. Trials (RCTs). The authors
thus suggest crafting a Social Thermoregulation Therapy (STT)
as enhancement to
existing relationship therapies. The authors outline what is
known and not known
in terms of social thermoregulatory mechanisms, what kind of
data collection and
analyses are necessary to better understand social
thermoregulatory mechanisms to
craft interventions, and stress the need to conduct RCTs prior to
implementation. They
further warn against too hastily applying these theoretical
perspectives. The article
concludes by outlining why STT is the way forward in
improving relationship functioning.
Keywords: social thermoregulation, attachment, relationship
therapy, emotion regulation, wearables, sensor
technology, actuators
INTRODUCTION
One of the strongest predictors of one’s physical health, mental
health, and happiness is the quality
of one’s close relationships. Having high quality relationships
predicts factors that we understand
as life chances, including a longer life, greater creativity, and
higher self-esteem (House et al., 1988;
Argyle, 1992; Holt-Lunstad et al., 2010). However, to date, our
understanding of why high quality
50. social relationships lead to a more fulfilled and healthy life is
relatively limited. The present paper
serves to provide further direction to understanding some
prominent underlying mechanisms
through social thermoregulation theory. In addition, we will
outline how near-future interventions
can be crafted by doing research with novel technologies during
relationship therapy.
Thus far, the evidence linking relationships and life chances
focused at “higher order” levels:
marital couples that regulate each other’s emotions successfully
have fewer marital problems, have
better health, and are more satisfied with their relationship than
couples who do not successfully
co-regulate (Gottman and Levenson, 1992). But our position is
broader: first, disturbances in
health closely relate to dysregulated body temperature
(Benzinger, 1969). Second, temperature
regulation has been a major driving force for sociality in
homeothermic (= warm-blooded) animals
Frontiers in Psychology | www.frontiersin.org 1 May 2017 |
Volume 8 | Article 635
http://www.frontiersin.org/Psychology/
http://www.frontiersin.org/Psychology/editorialboard
http://www.frontiersin.org/Psychology/editorialboard
https://doi.org/10.3389/fpsyg.2017.00635
http://creativecommons.org/licenses/by/4.0/
https://doi.org/10.3389/fpsyg.2017.00635
http://crossmark.crossref.org/dialog/?doi=10.3389/fpsyg.2017.0
0635&domain=pdf&date_stamp=2017-05-01
http://journal.frontiersin.org/article/10.3389/fpsyg.2017.00635/a
bstract
http://loop.frontiersin.org/people/63455/overview
51. http://loop.frontiersin.org/people/360820/overview
http://loop.frontiersin.org/people/44496/overview
http://www.frontiersin.org/Psychology/
http://www.frontiersin.org/
http://www.frontiersin.org/Psychology/archive
fpsyg-08-00635 April 27, 2017 Time: 14:49 # 2
IJzerman et al. Social Thermoregulation Therapy
(Ebensperger, 2001). For humans, the aggregate evidence is
similarly in favor of an evolved reliance of social warmth on
physical warmth (IJzerman et al., 2015a). Finally, the literature
is
in favor of the idea of co-regulation, a lower level dynamic that
can
help down-regulate emotional states socially (Butler and
Randall,
2013).
The present article brings together these three concepts and
asks the question if thermoregulation is crucial for
physiological
co-regulation in close relationships, and, consequently,
proceeds
to ask whether therapists can help improve physiological co-
regulation in couples. Altogether, we propose to rely on novel
technologies that can aid in developing Social Thermoregulation
Therapy (STT) to help optimize people’s social lives.
In this article, we first provide what we see as one of the
main functions of relationships: relationships help distribute
the burdens of the environment and help to co-regulate. Then,
we provide the available evidence on social thermoregulation
theory, integrate co-regulation with social thermoregulation
52. theory, after which we discuss potential interventions to
improve
co-thermoregulation. Most prominently, we point to modern
sensor and actuator technology as tools to help develop
and then implement STT. We clarify what we know and
don’t know, followed by some of the risks we perceive in
moving forward with such novel therapies. We anticipate
that this approach will dramatically reduce the gap between
researchers (theory) and therapists (application). Our position
paper is much needed, as advances in this field will likely
be so rapid that consequential mistakes in crafting novel
relationship therapies are not unimaginable and potentially
disastrous.
THE GENERAL PREMISE:
RELATIONSHIPS ARE FOR
CO-REGULATION
In a seminal 1992 article, Gottman and Levenson (1992)
found that co-regulation is crucial for a relationship’s success.
They found that positive exchanges (e.g., responses through
humor or positive problem descriptions rather than a negative,
defensive response) toward a marriage partner were predictive
of
lower chance on divorce later, better health, and greater finger
amplitude (indicative of autonomic activation). In the early days
of this research, co-regulation was mostly understood through
the regulation of emotions at higher, more conscious forms
of attending to the other’s emotion (e.g., through humor or
positive problem descriptions). With more advanced equipment,
researchers have also started to pay greater attention to lower
level dynamics that used to be much harder to capture.
As but one example, Coan et al. (2006) found that simply
holding the partner’s hand while under distress decreased
stress-
related activation in the brain while under threat of electric
53. shock.
These insights on lower level dynamics led Butler and Randall
(2013) to redefine co-regulation as the “bidirectional linkage of
oscillating emotional channels (subjective experience,
expressive
behavior, and autonomic physiology) between partners (a
linkage
that) contributes to emotional and physiological stability for
both
partners in a close relationship” (p. 203), which thus
incorporates
lower level (autonomic) regulation with more conscious forms.
Butler and Randall’s (2013) perspective supplements the early
views imparted by Gottman and Levenson (1992) with a type
of social emotion regulation that is less “in the head” and more
distributed and dynamic, relying on an “a�ective attunement”
between close partners (e.g., romantic partners or caregiver and
infant).
The general aim of such a�ective attunement is to achieve
an allostatic balance in the relationship through distributing
risks of environmental threats, leading to an o�oading of
energetic demands created by such threats (e.g., Beckes and
Coan, 2011; Fitzsimons et al., 2015). The field of behavioral
ecology has illustrated this idea of load sharing with
conspecifics.
Ostriches, for example, increase the rate of eating when
they are in the presence of other ostriches, which can look
out for predators (Bertram, 1980; Krebs and Davies, 1993).
Homeothermic animals, like rodents, huddle up to other
animals when cold to o�oad the energetic demands of
warming up (Ebensperger, 2001). Thus, beyond distributing
threat, one of the constant and very demanding threats to
allostatic balance is the near-constant change in environmental
54. temperature. For most animals their ilk help downregulate the
environmental challenge that fluctuations of temperature pose
on
them.
WHY SOCIAL THERMOREGULATION IS
VITAL FOR CO-REGULATION: THE
AVAILABLE EVIDENCE
Despite modern conveniences like heaters or cloths, temperature
regulation remains a considerable challenge for humans. From
that perspective, Social Thermoregulation Theory complements
basic approaches to co-regulation, detailing how “social
warmth”
(i.e., trustworthiness and social predictability) relies on more
ancient needs of physical warmth. Strong evidence for the
relationship between social interaction and thermoregulation
can be found in studies across homoeothermic animals. In
rodents, social thermoregulation has been shown to be one
of the most important motivating forces behind group living,
especially when temperatures drop (Ebensperger, 2001). As but
one example, the Octodon Degus (a Chilean rodent) used 40%
less energy and achieved a higher surface temperature when
housed with three or five others (versus alone; Nuñez-Villegas
et al., 2014). Studies of vervet monkeys show somewhat more
complex mechanisms, with larger social networks bu�ering
their core temperatures from the cold (McFarland et al.,
2015), while even grooming a dead vervet monkey’s pelt
insulates against temperature variations (McFarland et al.,
2015).
For humans, the aggregate evidence is similarly in favor of
the evolved reliance of social on physical warmth.
Psychological
research has consistently shown that temperature fluctuations
(either outside or lab temperature) is causally tied to social
55. behaviors ranging from renting romance movies (Hong and
Frontiers in Psychology | www.frontiersin.org 2 May 2017 |
Volume 8 | Article 635
http://www.frontiersin.org/Psychology/
http://www.frontiersin.org/
http://www.frontiersin.org/Psychology/archive
fpsyg-08-00635 April 27, 2017 Time: 14:49 # 3
IJzerman et al. Social Thermoregulation Therapy
Sun, 2012) to house-purchasing decisions (Van Acker et al.,
2016) to basic e�ects on perception, language use, and memory
(IJzerman and Semin, 2009; Schilder et al., 2014; Messer
et al., 2017). The e�ect also works the other way around:
if people feel the environment to be socially unpredictable,
they perceive temperatures as lower, whereas the reverse is
true if people feel psychologically safe (Zhong and Leonardelli,
2008; IJzerman and Semin, 2010; IJzerman et al., 2015b, 2016;
Ebersole et al., 2016). The link between psychological safety
and thermoregulation extends to consumer behavior: brands
that are regarded as more trustworthy induce perceptions of
higher temperature, while the degree to which one is a�ected
by temperature determines what one would pay for the brand
(IJzerman et al., 2015b). This led IJzerman et al. (2015b) to
conclude that temperature perceptions are a sort of social
“weather report,” or a temperature prediction system on the
basis
of which people know whether to rely on their social context (or
not)1.
Although it seems unlikely that social thermoregulation is still
heavily involved in adult social interactions, one has to note
56. that
the evolutionary window of availability of modern conveniences
(like heaters and clothes) to regulate temperature has likely
been
too brief to make a noticeable di�erence in the reliance of
social
on physical warmth. As a result, the need for physical warmth
likely has formed as a model, or template, through which
humans
come to understand and interpret their social interactions.
Accordingly, interaction with others outside people’s
direct relationships should similarly rely on “temperature
estimates.” And indeed, in humans (unlike penguins) social
thermoregulation is not just about huddling, but instead about
attaching to di�erent people in di�erent contexts. Perhaps the
most compelling evidence on attaching in a variety of contexts
from recent work on social integration and climatic variation.
IJzerman et al. (2017b) found in a relatively large sample in 12
di�erent countries that the lower people’s core temperatures,
the
more they engage in complex social integration (i.e., engage in
contact with di�erent people in di�erent social contexts); they
also found that this integration bu�ers their core against
distance
from the equator (as a proxy for colder climates). In short, the
available evidence is strongly in favor of the idea that people’s
social networks – even the more complex ones – protect them
from the cold, and that humans adapt their social behaviors and
cognitions to temperature changes.2
1The field of social thermoregulation in humans is its infancy.
Nevertheless, a
considerable amount of evidence has been gathered on the
relationship between
temperature regulation and social behavior. This does not mean
57. that this field
is without its criticism (and rightfully so). Given the discussion
on power in
psychological science, it may then also not come as a surprise
that also in the field of
thermoregulation some e�ects failed to replicate (Vess, 2012;
LeBel and Campbell,
2013). Yet, other e�ects did replicate (IJzerman and Semin,
2009; Schilder et al.,
2014; Inagaki et al., 2015; Ebersole et al., 2016; IJzerman et al.,
2016). Further,
original studies with larger Ns do exist, with some studies with
participant samples
between 100 and 500 (e.g., IJzerman et al., 2015b; Van Acker et
al., 2016), and
some outliers even with samples around 30,000 (Hong and Sun,
2012) and above 6
million (Zwebner et al., 2013). We think that the criticisms
should likely be directed
at better specifying the models relevant for social
thermoregulation theory, for
which we see this paper as an important step in the right
direction.
2Note that the more dynamic view of social thermoregulation
diverges
substantially from what one may understand as conceptual
embodiment, a view
HOW SOCIAL THERMOREGULATION
SUPPORTS CO-REGULATION:
EVIDENCE AND SPECULATIONS
We have reviewed evidence that temperature a�ects our social
behavior and cognitions in myriad ways, while we have also
reviewed evidence that shows that complex social networks still
protect us against the cold. But at present, it is still unclear
58. exactly how humans help regulate each other’s temperature
through more complex dynamics, if at all. Although there is
now
considerable evidence that social thermoregulation is (causally)
tied to social cognitions and behaviors, the literature regarding
co-thermoregulatory patterns is scarce. At best, we can extract
some elementary e�ects and speculate about further
mechanisms.
Despite the limited evidence, we feel comfortable providing
some
first direction given the current state of diverse, but converging
literatures.
For example, emotions like anxiety and sadness have
come to be associated with lowered peripheral temperature
(Ziegler and Cash, 1938; Ekman et al., 1983; McFarland, 1985;
Ekman, 1993; Nummenmaa et al., 2014). Relatedly, adults’
peripheral temperatures drop when they feel socially excluded
(IJzerman et al., 2012).3 Peripheral temperature changes also
extend to early social interactions: when a mother leaves the
room in the Strange Situation, the infant’s skin temperature
drops. Skin temperature only returns to baseline once the
mother returns (and not so when a stranger enters the room;
Mizukami et al., 1990). Further, people respond to close
others’ sadness (either partners or infants) with an increase
in peripheral temperature (Vuorenkoski et al., 1969; IJzerman
et al., 2015a). That these e�ects may be co-regulatory in
nature could be inferred from studies that show that physical
warmth downregulate the need for social contact after a lack
of social warmth (IJzerman et al., 2012; Zhang and Risen,
2014).4,5
Why is the regulation of body temperature so important
to our social regulation systems? Human infants – like
advocated by for example Lako� and Johnson (1999). They
59. propose that warmth
becomes paired with a�ection at an early age, and that such
peripherally related
constructs form a mental representation of relationships. Our
view instead relies
on more dynamic, and innate, co-regulation systems for which
the infant searches
from birth on, and that it may form an internal mental
representation of its social
network, sca�olded onto such early innate predispositions to
search for warmth
(cf. Bowlby, 1969; Mandler, 1992).
3We would like to note that when we discuss peripheral
temperatures here, we
mostly talk about the extremities. Little is known about
temperature changes
throughout the body in response to social situations, but
temperature changes in
the extremities are for example likely to di�er from temperature
changes in the
face. Indeed, social exclusion has been found to lead to
decreases in the extremities
(IJzerman et al., 2012) but increases in the face (Paolini et al.,
2016).
4Furthermore, the evidence on physiological patterns
converging with social
thermoregulation (like oxytocin and serotonin) converge with
these ideas on
co-thermoregulation (e.g., Beckes et al., 2015; Raison et al.,
2015).
5We have not discussed the di�erences between core and
peripheral temperature.
Core temperatures are relatively stable, although they are
influenced by time of day,
distance from the equator, sex, and the quality of one’s social
network. Peripheral
60. temperature is much more prone to change throughout the day.
For example,
peripheral temperatures drop when environmental temperatures
drop and even
drop about 0.7� after being socially excluded. This is so
because the periphery
serves as a defense mechanism from changes to the core.
Frontiers in Psychology | www.frontiersin.org 3 May 2017 |
Volume 8 | Article 635
http://www.frontiersin.org/Psychology/
http://www.frontiersin.org/
http://www.frontiersin.org/Psychology/archive
fpsyg-08-00635 April 27, 2017 Time: 14:49 # 4
IJzerman et al. Social Thermoregulation Therapy
many other altricial species – are not able to regulate their
temperature independently and need to rely on the caregiver
to thermoregulate. Early attachment processes of the human
child are thus focused on its need to keep warm, likely
forming the basis for an evolved model, or, rather, template,
for mental (attachment-like) models concerning the relationship
between physical and social warmth. Experimental evidence
supports the temperature-template-attachment view: attachment
has been found to moderate people’s responses to temperature
cues in a variety of reports (see, e.g., IJzerman et al., 2013).
Furthermore, Vergara et al. (2017, unpublished) found that
individual di�erences in need for social thermoregulation
and preference for temperature predict not only individual
di�erences in attachment but also stress and health, providing
further support for thermoregulation as essential feature of our
attachment system.6
61. Thermoregulation – across animals – is crucial for survival.
The available evidence in humans also points to a robust link
with
social behavior and cognition, one that seems to be crucial for
attachment. We therefore strongly suspect that thermoregulation
becomes integrated into higher-order prediction systems and
that
this “temperature prediction system” supports us in navigating
our social environment. Trustworthiness of brands for example
do not only increase temperature perceptions, they also drive
purchasing decisions (IJzerman et al., 2015b), while
temperature
fluctuations also influence people’s conformity to the majority
appeal (Huang et al., 2014) or their decisions to engage in
social interactions (Hong and Sun, 2012; Van Acker et al.,
2016).
And there are some indications that responses to others’
emotions manifest through peripheral temperature changes. This
is why, in line with previous work (IJzerman et al., 2015b), we
have reason to believe that the “weather report” we have used as
a metaphor relies on peripheral temperature to provide people
with information on the basis of which they adapt to social
situations. “Spending” this on others should thus only happen
if we expect to be “paid back” in the future. Wagemans and
IJzerman (2015, unpublished) for example found that peripheral
temperature increases, but only if the relationship is communal.
Szymkow et al. (2013) and IJzerman et al. (2015b) find that
people estimate temperature higher, but only if the target is
trustworthy (and only if lab temperatures are lower; Ebersole
et al., 2016; IJzerman et al., 2016). Finally, people’s need to
thermoregulate is higher, but again only if they perceive others
as trustworthy (i.e., are securely attached; Vergara et al., 2017,
unpublished).
62. In other words, there is considerable variation in the degree to
which we (literally) warm up to others. There is also variation
in
the degree to which we perceive benefits from others in relation
to
thermoregulation and consequently the degree to which people
“spend” their thermoregulation on others. This “spending”
should be contingent not only on one’s past experiences, but
also on the quality of the relationship. With novel technological
6We stress that the relationship between social
thermoregulation and health to date
has only been found in correlational studies, and no prospective
studies have been
conducted.
inventions it becomes possible to study these dynamics in a
methodologically sound fashion, cost e�ciently, and in real
time.
SOCIAL THERMOREGULATION’S
PHYSIOLOGICAL MECHANISMS:
TOWARD PREDICTING DYNAMIC
PATTERNS
The key to understanding temperature prediction systems –
and how they help us adapt to social contexts – is the
economy of action (Pro�tt, 2006; Schnall et al., 2010; Beckes
and Coan, 2011; Coan and Sbarra, 2015). The premise
is simple: organisms need to take in more energy than
they exert, and overspending the energy expenditure budget
is a threat to allostatic balance. In other animals, the
metabolic costs of thermoregulation are decreased when
regulated socially (Gilbert et al., 2006). We believe that social
emotion regulation is (partly) rooted in the need to maintain
temperature homeostasis and that helping to regulate another’s
63. sadness will cost to support if our own periphery rises
in peripheral temperature. We will thus only o�er emotion
regulation if we suspect the other to “pay back” in the
future (and we ask, is the relationship with the other is
communal?).
In other words, the ‘economy’ of relationships can be
understood by calculating who in the social network “pays”
for survival and – in more modern days and relationships –
who “pays” by facilitating day-to-day emotional functioning.
Human relationships are therefore a bit like being modern-
type penguins, but then in the sense that people’s “modern”
emotional systems are reliant on much older (penguin)
systems. We think that this modern emotional system
could rely on a “temperature monetizing system” that helps
us regulate and bargain toward temperature homeostasis
(Satino�, 1978, 1982; Anderson, 2010). At present, there is
virtually no research detailing how thermoregulation and
metabolism relate to social emotion regulation, but there
is some support for the fact that attachment-like processes
rely on metabolic regulation. For example, people who are
more avoidant in their relationship orientation have higher
levels of fasting glucose, indicating a higher reliance on their
own metabolic resources (Coan and Sbarra, 2015; Ein-Dor
et al., 2015; see also Henriksen et al., 2014; IJzerman et al.,
2015a).
Relationships and Co-thermoregulation
One of the goals of a relationship is thus to maintain a form
of “temperature homeostasis”; keeping track of the health of
the relationship through temperature helps us maintain an
optimized social network. Despite the considerable evidence
linking thermoregulation to social behaviors and cognitions,
the underlying dynamics we need to understand to e�ectively
integrate social thermoregulation theory into therapy are still
highly speculative. We know that our need for social warmth
64. relies on our need for physical warmth; we also know that the
lack
Frontiers in Psychology | www.frontiersin.org 4 May 2017 |
Volume 8 | Article 635
http://www.frontiersin.org/Psychology/
http://www.frontiersin.org/
http://www.frontiersin.org/Psychology/archive
fpsyg-08-00635 April 27, 2017 Time: 14:49 # 5
IJzerman et al. Social Thermoregulation Therapy
of high quality relationships is metabolically costly; we further
know that high quality relationships protect us from the cold;
and we also know that both experiencing emotions ourselves
and seeing emotions in others are associated with peripheral
temperature changes in ourselves. Based on these di�erent, but
converging literatures, we thus strongly suspect that people co-
thermoregulate close others by warming one’s skin or hugging
the
other when sad, and that both acts are metabolically costly. Yet,
whether this is true, and how they exactly interrelate is not at
all
clear.7
We further strongly suspect that co-thermoregulation can be
responsive or unresponsive, based on how reliable the partners
perceive the relationship to be (communality), or how reliable
they themselves perceive the world in general to be (attachment
style). With “responsive co-thermoregulation” – a new term we
would like to introduce for relationship research and therapy –
we
mean the (non-conscious) regulation of each other’s temperature
65. toward homeostasis in dyads. The degree to which one
participates is thus contingent upon perceived social
predictability
(i.e., a combination between attachment and communality
of the relationship). Unresponsive co-thermoregulation would
thus imply not hugging the partner when he or she is sad,
and not increasing peripheral temperature when the other is
in need. What constitutes responsive and unresponsive co-
thermoregulation is still in need of very specific classification.
Acknowledging that relationships are complex and that
multiple factors contribute to successful regulation, further
caution is warranted in applying this perspective on co-
thermoregulation in therapy. That is, the perceived social
predictability can be accurate or inaccurate as in some
situations
being non-responsive to one’s partner’s emotions might be
functional. When one’s partner has a very bad temper or can
be abusive, avoiding one’s partner’s anger – as opposed to
engaging – can be considered more beneficial. Thus, part of
classifying responsive versus unresponsive co-thermoregulation
is the understanding of the social context in which co-
thermoregulation occurs.
FROM SPECULATION TO APPLICATION:
THE ROLE OF TECHNOLOGICAL
ADVANCEMENTS
We have acknowledged that the dynamics of co-
thermoregulation are yet unclear. Specifically, it is unclear
how strong, in which situation, and for which types of
emotion one’s peripheral temperature should in- or decrease.
At the same time, the available evidence supports the idea
that understanding co-thermoregulation is vital to achieve
7We have not even scratched the surface of the interrelationship
66. between
peripheral temperature changes and facial expression of
emotions. We think it
is likely that peripheral temperature changes are connected to
facial expressions
and other manifestations of emotions, which are thus
dynamically connected to
co-regulate emotions. Furthermore, we also have not even
considered the link
between individual di�erences in empathy or perspective
taking. We suspect such
relationships to exist, but how these links should be understood
is beyond the scope
of this article.
optimal social functioning. Thermoregulation has further been
implicated in (mental) health, such as depression (Pechlivanova
et al., 2010), insomnia (Bach et al., 2002; Van den Heuvel et
al.,
2004; Pechlivanova et al., 2010), anxiety (Parry, 2007), and
many others. Furthermore, physiological processes related to
thermoregulation (like …
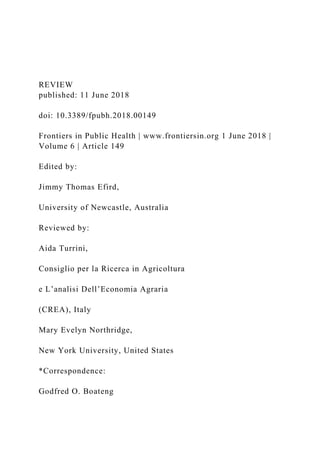
![[email protected]
Specialty section:
This article was submitted to
Epidemiology,
a section of the journal
Frontiers in Public Health
Received: 26 February 2018
Accepted: 02 May 2018
Published: 11 June 2018
Citation:
Boateng GO, Neilands TB,
Frongillo EA, Melgar-Quiñonez HR and
Young SL (2018) Best Practices for
Developing and Validating Scales for
Health, Social, and Behavioral
Research: A Primer.
Front. Public Health 6:149.
doi: 10.3389/fpubh.2018.00149
Best Practices for Developing and](data:image/gif;base64,R0lGODlhAQABAIAAAAAAAP///yH5BAEAAAAALAAAAAABAAEAAAIBRAA7)