
Recommended
Recommended
More Related Content
Similar to Directions Diversity among individuals, as well as cultures, prov.docx
Similar to Directions Diversity among individuals, as well as cultures, prov.docx (20)
More from lynettearnold46882
More from lynettearnold46882 (20)
Recently uploaded
Recently uploaded (20)
Directions Diversity among individuals, as well as cultures, prov.docx
- 1. Directions: Diversity among individuals, as well as cultures, provides a challenge for nurses when it comes to delivering meaningful health promotion and illness prevention-based education. How do teaching principles, varied learning styles (for both nurses and patients), and teaching methodologies impact the approach to education? How do health care providers overcome differing points of view regarding health promotion and disease prevention? Provide an example. Use at least one reference. MAT 510 – Homework Assignment Homework Assignment 5 Due in Week 6 and worth 30 points The data in below table lists country code and the order to remittance (OTR) time for hardware / software installations for the last 76 installations (from first to last). OTR is the time it takes from an order being placed until the system is installed and we receive payment (remittance). Because this company does business internationally, it also notes the country of installation using a country code. This code is listed in the first column. Table: Country Code and OTR Cycle Time for Software Systems Installation Country Code Cycle Time Country Code
- 2. Cycle Time 1 20 5 29 1 24 6 40 1 46 7 157 1 26 8 19 14 38 5 24 1 15 1 81 1 15 7 53 17 23 7 26 1 31 1
- 6. 48 1 22 5 21 1 50 1 19 Use the date in table above and answer the following questions in the space provided below: 1. Does the OTR time appear to be stable? Why or why not? 2. If you were to use a control chart to evaluate stability, which chart would you use? Why? 3. What can you learn about the distribution of the installation process? 4. Does it appear that the country has an impact on installation time? Why or why not? Type your answers below and submit this file in Week 6 of the online course shell: 1. The OTR time appears to be unstable. When taking in consideration the cycle time, the times are organized according to every respectively country code. The minimum time frame in the time cycle is 5 which is related to the country code 5 and the maximum is 150 which corresponds to the country code 14. By analyzing every country code, the perception of every cycle time frame is different. For example, the country code 1 is 19<x<89. The country code 5 is 5<x<129. The country code 6 is 26<x<79. The country code 7 is 7<x<157. The country code 8 is 19<x<47. The country code 14 is 24<x<150. The country code 17 is 13<x<43. These examples show how the entire time table reflects an unstable OTR time.
- 7. 2. The control chart that will best evaluate the stability will be the time plot run chart. The time plot allows us to analyze from one point to another point and easily identify each cycle time and also visualize the UCL and LCL according to the average median line and also identify what part of the time cycle spread above or below the analytical UCL and LCL limit. The ideal control chart would be a time plot run chart. 3. The table chart may reflect a cause of variation in the distribution of the installation process as described before. First, the process starts with the order placement, then the payment is received and finally the installation occurs. Therefore, the thing that we can learn about this chart is that it is unstable which means that either the process will have some difficulties in the installation to be able to finish the project or when the payment is supposed to be received before proceeding into the installation. For example, most of the time in construction, a payment needs to be received first before the installation occurs. First of all, a price estimation is given when clients approved the project, then second, once the design is ready, the client needs to make a payment of 50% of the total price and then finally the client needs to pay the other 50% in order to complete the installation. So we can conclude that the installation process always goes according to the payment received which can be a cause of variation if the process becomes unstable. 4. As the table mentioned, the installation time does not have any relation with the country code because of the different variation of each country results and cycle time frame. Each country code, according to the facts, has a UCL and LCL different from a country to another. This fact is mainly due to some data that have not been provided before the analysis. For example, the country code 1 and the country code 7 are the only ones that have enough data to see which part of the cycle time is going beyond the UCL limit and therefore creates a cause of variation that makes the process unstable.
- 8. CODE ANALYSIS 17CountsCountry CodeCycle TimeMoving Range (MR)Avg.UCLLCLCountry CodeAverage Cycle TimeAvg. Moving RangeUCLLCL1172329.2964.750.00129.2913.3364.750.002174 11829.2964.750.00317212029.2964.750.0041723229.2964.750.0 0517131029.2964.750.00617412829.2964.750.0071743229.2964 .750.0029.285714285713.333333333329.285714285764.752380 95240 Country Code #17 1 2 3 4 5 6 7 23 41 21 23 13 41 43 29.285714285714285 UCL 1 2 3 4 5 6 7 64.752380952380946 64.752380952380946 64.752380952380946 64.752380952380946 64.752380952380946 64.752380952380946 64.752380952380946 64.752380952380932 LCL 1 2 3 4 5 6 7 0 0 0 0 0 0 0 0 Average 1 2 3 4 5 6 7 29.285714285714285 29.285714285714285 29.285714285714285 29.285714285714285 29.285714285714285 29.285714285714285 29.285714285714285 29.285714285714281 Observation number OTR (minutes) CODE ANALYSIS 14CountsCountry CodeCycle TimeMoving Range (MR)Avg.UCLLCLCountry CodeAverage Cycle TimeAvg. Moving RangeUCLLCL1143859.20229.440.00159.2064.00229.440.0021 415011259.20229.440.003142412659.20229.440.00414421859.2 0229.440.0051442059.20229.440.0059.26459.2229.440 Country Code #14 1 2 3 4 5 38 150 24 42 42 59.2 UCL 1 2 3 4 5 229.44 229.44 229.44 229.44 229.44 229.44 LCL 1 2 3 4 5 0 0 0 0 0 0 Average 1 2 3 4 5
- 9. 59.199999999999996 59.199999999999996 59.199999999999996 59.199999999999996 59.199999999999996 59.2 Observation number OTR (minutes) CODE ANALYSIS 8CountsCountry CodeCycle TimeMoving Range (MR)Avg.UCLLCLCountry CodeAverage Cycle TimeAvg. Moving RangeUCLLCL184337.5084.850.00137.5017.8084.850.0028281 537.5084.850.0038471937.5084.850.0048192837.5084.850.0058 422337.5084.850.006846437.5084.850.0037.517.837.584.8480 Country Code #8 1 2 3 4 5 6 43 28 47 19 42 46 37.5 UCL 1 2 3 4 5 6 84.848000000000013 84.848000000000013 84.848000000000013 84.848000000000013 84.848000000000013 84.848000000000013 84.848000000000013 LCL 1 2 3 4 5 6 0 0 0 0 0 0 0 Average 1 2 3 4 5 6 37.5 37.5 37.5 37.5 37.5 37.5 37.5 Observation number OTR (minutes) CODE ANALYSIS 7CountsCountry CodeCycle TimeMoving Range (MR)Avg.UCLLCLCountry CodeAverage Cycle TimeAvg. Moving RangeUCLLCL171146.76139.700.00146.7634.94139.700.00271 4346.76139.700.0037412746.76139.700.0047182346.76139.700. 0057422446.76139.700.006744246.76139.700.007715711346.76 139.700.00875310446.76139.700.0097262746.76139.700.00107 502446.76139.700.00117292146.76139.700.00127613246.76139 .700.00137882746.76139.700.0014778146.76139.700.00157534 646.76139.700.0016753046.76139.700.0017748546.76139.700.0 046.764705882434.937546.7647058824139.69845588240 Country Code #7 1 2 3 4 5 6 7 8 9 10 11 12 13 14 15 16 17 11 14 41 18 42 44 157 53
- 10. 26 50 29 61 88 7 53 53 48 46.764705882352942 UCL 1 2 3 4 5 6 7 8 9 10 11 12 13 14 15 16 17 139.69845588235296 139.69845588235296 139.69845588235296 139.69845588235296 139.69845588235296 139.69845588235296 139.69845588235296 139.69845588235296 139.69845588235296 139.69845588235296 139.69845588235296 139.69845588235296 139.69845588235296 139.69845588235296 139.69845588235296 139.69845588235296 139.69845588235296 139.6984558823529 LCL 1 2 3 4 5 6 7 8 9 10 11 12 13 14 15 16 17 0 0 0 0 0 0 0 0 0 0 0 0 0 0 0 0 0 0 Average 1 2 3 4 5 6 7 8 9 10 11 12 13 14 15 16 17 46.764705882352942 46.764705882352942 46.764705882352942 46.764705882352942 46.764705882352942 46.764705882352942 46.764705882352942 46.764705882352942 46.764705882352942 46.764705882352942 46.764705882352942 46.764705882352942 46.764705882352942 46.764705882352942 46.764705882352942 46.764705882352942 46.764705882352942 46.764705882352935 Observation number OTR (minutes) CODE ANALYSIS 6CountsCountry CodeCycle TimeMoving Range (MR)Avg.UCLLCLCountry CodeAverage Cycle TimeAvg. Moving RangeUCLLCL166442.75110.390.00142.7525.43110.390.00262 63842.75110.390.0036472142.75110.390.0046272042.75110.39 0.005627042.75110.390.0066401342.75110.390.0076793942.75 110.390.0086324742.75110.390.0042.7525.428571428642.7511 0.390
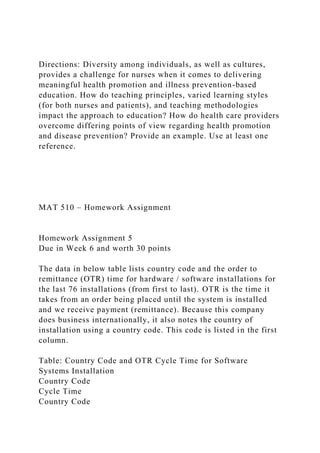
- 11. Country Code #6 1 2 3 4 5 6 7 8 64 26 47 27 27 40 79 32 42.75 UCL 1 2 3 4 5 6 7 8 110.39 110.39 110.39 110.39 110.39 110.39 110.39 110.39 110.39 LCL 1 2 3 4 5 6 7 8 0 0 0 0 0 0 0 0 0 Average 1 2 3 4 5 6 7 8 42.75 42.75 42.75 42.75 42.75 42.75 42.75 42.75 42.75 Observation number OTR (minutes) CODE ANALYSIS 5CountsCountry CodeCycle TimeMoving Range (MR)Avg.UCLLCLCountry CodeAverage Cycle TimeAvg. Moving RangeUCLLCL152936.25148.730.00136.2542.29148.730.00254 41536.25148.730.003593536.25148.730.00455436.25148.730.00 55292436.25148.730.006524536.25148.730.007512910536.2514 8.730.00852110836.25148.730.0036.2542.285714285736.25148. 730 Country Code #5 1 2 3 4 5 6 7 8 29 44 9 5 29 24 129 21 36.25 UCL 1 2 3 4 5 6 7 8 148.73000000000002 148.73000000000002 148.73000000000002 148.73000000000002 148.73000000000002 148.73000000000002 148.73000000000002 148.73000000000002 148.73000000000002 LCL 1 2 3 4 5 6 7 8 0 0 0 0 0 0 0 0 0 Average 1 2 3 4 5 6 7 8 36.25 36.25 36.25 36.25 36.25 36.25 36.25 36.25 36.25 Observation number OTR (minutes) CODE ANALYSIS 1CountsCountry CodeCycle TimeMoving Range (MR)Avg.UCLLCLCountry CodeAverage Cycle TimeAvg. Moving
- 12. RangeUCLLCL112034.0084.210.00134.0018.8884.210.0021244 34.0084.210.0031462234.0084.210.0041262034.0084.210.00511 51134.0084.210.006115034.0084.210.0071311634.0084.210.008 131034.0084.210.009132134.0084.210.00101151734.0084.210.0 0111897434.0084.210.00121365334.0084.210.0013133334.0084 .210.00141211234.0084.210.0015122134.0084.210.0016150283 4.0084.210.00171813134.0084.210.00181285334.0084.210.0019 134634.0084.210.0020134034.0084.210.00211521834.0084.210. 00221193334.0084.210.00231442534.0084.210.00241331134.00 84.210.00251191434.0084.210.0013418.8753484.20750 Country Code #1 1 2 3 4 5 6 7 8 9 10 11 12 13 14 15 16 17 18 19 20 21 22 23 24 25 20 24 46 26 15 15 31 31 32 15 89 36 33 21 22 50 81 28 34 34 52 19 44 33 19 UCL 1 2 3 4 5 6 7 8 9 10 11 12 13 14 15 16 17 18 19 20 21 22 23 24 25 84.20750000000001 84.20750000000001 84.20750000000001 84.20750000000001 84.20750000000001 84.20750000000001 84.20750000000001 84.20750000000001 84.20750000000001 84.20750000000001 84.20750000000001 84.20750000000001 84.20750000000001 84.20750000000001 84.20750000000001 84.20750000000001 84.20750000000001 84.20750000000001 84.20750000000001 84.20750000000001 84.20750000000001 84.20750000000001 84.20750000000001 84.20750000000001 84.20750000000001 LCL 1 2 3 4 5 6 7 8 9 10 11 12 13 14 15 16 17 18 19 20 21 22 23 24 25 0 0 0 0 0 0 0 0 0 0 0 0 0 0 0 0 0 0 0 0 0 0 0 0 0 Average 1 2 3 4 5 6 7 8 9 10 11 12 13 14 15 16 17 18 19 20 21 22 23 24 25 34 34
- 13. 34 34 34 34 34 34 34 34 34 34 34 34 34 34 34 34 34 34 34 34 34 34 34 Observation number OTR (minutes) HistogramCountsCountry CodeCycle Timebin11200212420BinFrequency31464000412660201451158 04030611510060237131120803813114010039132160120010115 140111189160212136More013133141211512216150171811812 819134201342115222119231442413325119 Histogram Frequency 0 20 40 60 80 100 120 140 160 More 0 14 30 23 3 3 0 1 2 0 Bin Frequency Sheet3Country CodeCycle TimeCountry CodeCycle Time120529124640146715712681914385241151811157531723 72613112813113466413452975054415213211911514471114150 71472918917231741679741171313663284376117218428288467 18788847142462677647133595129742174155174362714426271 442133753744753121748122521150119