
Recommended
Recommended
More Related Content
Similar to For the last 50 years, the world economy has benefited fro.docx
Similar to For the last 50 years, the world economy has benefited fro.docx (20)
More from lmelaine
More from lmelaine (20)
Recently uploaded
Recently uploaded (20)
For the last 50 years, the world economy has benefited fro.docx
- 1. For the last 50 years, the world economy has benefited from a demographic boom that has contributed 1.8 percent to average annual global GDP increases, helping to generate an unprecedented level of growth.1 This demographic tailwind is coming to an end. With populations aging and fertility rates dropping around the world, the growth rates of the past 50 years may prove to be the exception, not the rule. The latest research of the McKinsey Global Institute (MGI) suggests that unless increases in labor productivity compensate for an aging workforce, the next 50 years will see a nearly 40 percent drop in GDP
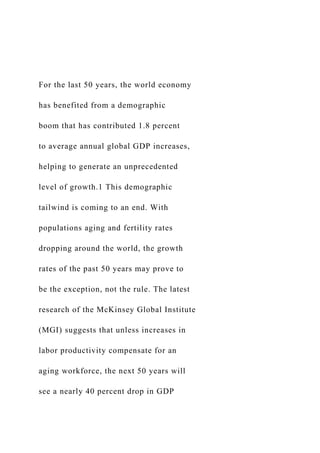
- 2. growth rates and a roughly 20 percent drop in the growth rate of per capita income around the world. The potential for diminished growth varies considerably among countries. In the developed world, Canada and Germany are poised for the biggest drops in GDP growth rates. Saudi Arabia, Mexico, Russia, and Brazil are most at risk in developing countries (Exhibit 1). Richard Dobbs, Jaana Remes, and Jonathan Woetzel Productivity gains could make the difference in an aging world. Where to look for global growth Societies that fail to raise their game for the productivity needed to sustain growth will find it harder to achieve a host of desirable goals, such as reducing poverty in developing economies and
- 3. meeting current social commitments in developed ones. But the research also suggests reasons for optimism. Among the countries we studied, fully 75 percent of the needed productivity increases through 2025 could occur if lagging companies and public-sector institutions caught up to the productivity of their best- performing peers. Emerging markets have the biggest opportunities to do so. These opportunities are known and currently available, and they represent a critical link in the virtuous cycle of emerging-market development: rising labor productivity goes hand in hand with growth in disposable income, consumption, and GDP.
- 4. To close the gap, companies must seize the opportunity to accelerate productivity J A N U A R Y 2 0 1 5 2 Exhibit 1 Web 2014 MGI Global Growth Exhibit 1 of 2 Source: UN population statistics; McKinsey Global Institute analysis The demographic drag on growth will vary considerably across countries over the next 50 years. GDP per capitaGDP Projected change in growth rate by 2064, assuming historical productivity growth, % −26South Korea −39 −40Australia −36 −7Japan −36 −57Canada −53
- 5. −28United States −34 −6France −18 −11United Kingdom −10 −2Germany −52 −14Italy −36 −12China −30 −11Indonesia −32 1India −27 −67Saudi Arabia −73 24Turkey −23 39Nigeria 7 −33Brazil −60 −60Mexico −66 51South Africa −30 2Argentina −37 −20Russia −60 D e v
- 6. e lo p e d E m e rg in g 3 processing—accounts for a range of 1 to 3 percent of GDP in the countries we studied. Globally, the sector’s productivity is 20 percent higher than total worldwide productivity, but significant gaps remain among countries. The overall productivity of food processing could rise by an estimated 59
- 7. percent, mostly in developing economies, through operational improvements, such as lean manufacturing, and bigger processing facilities to take advantage of scale effects. Automotive. The automotive sector, which accounts for an estimated 1.6 percent of global GDP, boasts productivity that is, on average, roughly 95 percent higher than that of other industries. Big differences exist among regions, however, reflecting the productivity performance of tier- two and tier-three component-supplier operations. (For example, in aggregate, auto manufacturing in India operates at less than one-quarter of the productivity level in the United States.) MGI estimates
- 8. that the automotive industry could raise its overall productivity by 90 percent as of 2025. The opportunity varies by region. The largest—in China and India, which today employ over 40 percent of all automotive workers—involve greater scale and improved manufacturing processes.2 Retail. In most economies, 5 to 12 percent of all employees work in the retailing industry—and more when wholesale is included—so retail matters. Globally, productivity in this growth and the value-creation potential it holds, while governments will need to support them by assessing regulatory barriers to competition in product and labor markets. While these actions tend
- 9. to grab less attention than, say, the pursuit of boundary-pushing possibilities (such as artificial intelligence and the Internet of Things), boosting productivity by rethinking regulatory barriers holds enormous potential for the global economy. MGI’s micro-to-macro analysis shows plenty of upside in global sectors such as agriculture, food processing, automotive, retail, and healthcare. As Exhibit 2 shows, the bulk (but by no means all) of these opportunities are found in emerging economies. Agriculture. Productivity in agriculture, which accounts for only 4 percent of employment in developed economies but for about 40 percent in emerging ones,
- 10. could more than double by 2025. The largest opportunities for mechanization and scale are in emerging regions, where, according to UN calculations, nearly 30 percent of crop cultivation is still done by hand. In developed economies— which tend to have larger farms, higher levels of mechanization, and more advanced practices in applying fertilizers, herbicides, and pesticides—further gains are available from technology, including the use of precision sensors and satellite data to increase crop yields. Food Processing. The manufacture of food and beverages—or food 4 Exhibit 2
- 11. Web 2014 MGI Global Growth Exhibit 2 of 2 The biggest opportunities to accelerate productivity growth are in emerging markets. Productivity-level potential in 20251 Index: base year2 = 100 139 229Agriculture 138 208 130 198 Food processing Retail 133 Healthcare,3 overall Emerging Developed 151 255 Automotive
- 12. 1Estimated for Brazil, China, Germany, India, Japan, Russia, the United Kingdom, and the United States. 2Base year = latest available data. For full methodology, see Global growth: Can productivity save the day in an aging world?, on mckinsey.com. 3Metrics for healthcare outcomes are lacking. Estimates are based on opportunities to reduce costs for delivering the same quality and access while maintaining or improving health outcomes. Underestimates overall productivity potential from increased quality and access. Separate data for developed and emerging markets are not available. Source: McKinsey Global Institute analysis sector is 30 percent lower than average productivity across all sectors. Retailing is also an industry with large, sustained productivity differences between developed and emerging economies, as well as among countries at similar income levels. The opportunities in the retail sector fall into three broad areas: increasing the share of more productive formats, narrowing the gap between the
- 13. least and most productive outlets in a particular format, and improving even the best performers’ productivity by using new technologies and processes. These hold the promise of boosting worldwide retail productivity by more than half. Healthcare. Healthcare spending accounts for 10 percent of GDP among the member countries of the Organisation for Economic Cooperation and Development (OECD) and for an average of roughly 6 percent of GDP in the four leading emerging 5 1 For a preliminary scoping of the challenge and opportunity, see James Manyika, Jaana Remes, and Jonathan Woetzel, “A productivity perspective on the future of growth,” McKinsey Quarterly, September 2014. For a fuller treatment of the
- 14. issues discussed in this article, see Global growth: Can productivity save the day in an aging world?, McKinsey Global Institute, January 2015. Both are available on mckinsey.com. 2 World Input-Output Database, 2012 release, wiod.org. Richard Dobbs and Jonathan Woetzel are directors of the McKinsey Global Institute, where Jaana Remes is a partner. Copyright © 2015 McKinsey & Company. All rights reserved. economies: Brazil, China, India, and Russia. Moreover, total healthcare spending is growing faster than global GDP, heightening the need to deliver healthcare as efficiently as possible. MGI analysis finds opportunities to save nearly 25 percent of overall healthcare spending by 2025, without compromising health outcomes. Countries could realize this potential by catching up
- 15. to best practices in operations and procurement, by reducing the number of clinically ineffective procedures, and by developing innovative delivery models (notably, providing care outside of hospital settings and using new digital technologies). Having ample opportunity to improve productivity does not guarantee that we will do so. There is a robust debate about how much growth is actually desirable, given the economic, social, and environmental externalities that rapid change often creates. Yet without growth, the world is a poorer place—and fulfilling social and debt commitments becomes harder. Business can and should upgrade its capital and technology,
- 16. pursue innovation, and mobilize talented workers. Governments need to assess whether and how to go on opening up their economies and integrating them into the world economy. Since the rate at which different countries and sectors exploit the opportunities before them is bound to vary, global business leaders will need strong antennae to understand where new opportunities are arising, how to adapt accordingly, and what new competitors they are likely to meet along the way. ExEcutivE summary Global Growth: can productivity savE thE day in an aGinG world?
- 17. January 2015 Copyright © McKinsey & Company 2015 The McKinsey Global Institute (MGI), the business and economics research arm of McKinsey & Company, was established in 1990 to develop a deeper understanding of the evolving global economy. Our goal is to provide leaders in the commercial, public, and social sectors with the facts and insights on which to base management and policy decisions. MGI research combines the disciplines of economics and management, employing the analytical tools of economics with the insights of business leaders. Our “micro-to-macro” methodology examines microeconomic industry trends to better understand the broad macroeconomic forces affecting business strategy and public policy. MGI’s in-depth reports have covered more than 20 countries and 30 industries. Current research focuses on six themes: productivity and growth, natural resources, labor markets, the evolution of global financial markets, the economic impact of technology and innovation, and urbanization. Recent reports have assessed global flows; the economies of Brazil, Mexico, and Nigeria; China’s digital
- 18. transformation; India’s path from poverty to empowerment; affordable housing; and the economics of tackling obesity. MGI is led by three McKinsey & Company directors: Richard Dobbs, James Manyika, and Jonathan Woetzel. Michael Chui, Susan Lund, and Jaana Remes serve as MGI partners. Project teams are led by the MGI partners and a group of senior fellows, and include consultants from McKinsey & Company’s offices around the world. These teams draw on McKinsey & Company’s global network of partners and industry and management experts. In addition, leading economists, including Nobel laureates, act as research advisers. The partners of McKinsey & Company fund MGI’s research; it is not commissioned by any business, government, or other institution. For further information about MGI and to download reports, please visit www.mckinsey.com/mgi. www.mckinsey.com/mgi James Manyika | San Francisco Jonathan Woetzel | Shanghai Richard Dobbs | London
- 19. Jaana Remes | San Francisco Eric Labaye | Paris Andrew Jordan | New York January 2015 Global Growth: can productivity savE thE day in an aGinG world? in briEf Global Growth: can productivity savE thE day in an aGinG world? What are the prospects for growth in the decades ahead? What will it take to get global growth going? These are contentious questions that MGI has attempted to answer in a new report focused on the G19 (the G20 minus the European Union) and Nigeria, which generate 80 percent of global GDP. The main findings include: � GDP growth was exceptionally brisk over the past 50 years, fueled by rapid growth in the number of workers and in their productivity. Now the first of these is weakening, and even reversing in some countries. Employment growth of 1.7 percent between 1964 and 2014 is set to drop to just 0.3 percent a year. Peak employment
- 20. is likely to occur within 50 years. � The onus is therefore on productivity to drive long-term GDP growth. Even if productivity were to grow at the (rapid) 1.8 percent annual rate of the past 50 years, the rate of GDP growth would decline by 40 percent over the next 50—slower than in the past five years of recovery from recession. The global economy expanded sixfold in the 50 years after 1964 but would grow only threefold between 2014 and 2064, making it more difficult to meet social and debt obligations. To compensate fully for slower employment growth, productivity growth would need to be 80 percent faster, at 3.3 percent a year. � The declining prime-working-age population share implies a 19 percent decrease in per capita income growth over the next 50 years. The waning of demographic tailwinds is expected to affect both developed and emerging economies. In Australia, Canada, Saudi Arabia, Brazil, and Mexico, per capita GDP could fall by more than 30 percent at historical productivity-growth rates. Globally, the standard of living would rise 2.3 times in the next 50 years from 2.8 times over the previous 50. To sustain past per capita income growth, historical productivity growth would need to accelerate by 22 percent. � Five sector case studies—agriculture, food processing, automotive, retail, and health care—suggest that annual productivity growth to 2025 in the
- 21. G19 and Nigeria could be as high as 4 percent, more than needed to counteract demographic trends. About three- quarters of the potential comes from the broader adoption of existing best practices— “catch-up” productivity improvements. The remaining one- quarter—counting only what we can foresee—comes from technological, operational, and business innovations that go beyond today’s best practices and “push the frontier” of the world’s GDP potential. � Ten enablers could lift global GDP growth closer to its potential—although this will be extremely challenging—by creating transparency and competition, incentivizing innovation, mobilizing labor, and further integrating the world economy. � We need a new, frank conversation about the tough trade- offs that will be required. We need more attention on resource productivity to avoid rapid growth imposing undue damage on the environment, and on how the fruits of growth are distributed not just between nations but within them. Finally, we need to improve how we measure growth. Auto assembly line, Cologne, Germany © Alamy
- 22. ExEcutivE summary Over the past 50 years, the global economy expanded sixfold as the world’s population and per capita income each grew at unprecedented speed. The global population more than doubled while average per capita income almost tripled to about $13,000 at 2012 purchasing power parity (Exhibit E1). However, there are significant doubts that this growth bonanza will continue in the long term given that the demographic tailwinds of the past half century are now waning. Views on the outlook for long-term growth diverge. Many people question whether growth is measured well (see Box E1, “GDP: Strengths and weaknesses”). Some even question whether growth should be a primary aspiration. However, the McKinsey Global Institute (MGI), the business and economics research arm of McKinsey & Company, has undertaken a major research effort on economic growth because we believe it matters. We do not see growth as an end in itself but as a critical enabler for meeting a much broader set of 6x expansion in global GDP 1964–2014 3x over next 50 years
- 23. Countries’ population and per capita GDP have each grown strongly over the past 50 years1 Exhibit E1 SOURCE: The Conference Board Total Economy Database; McKinsey Global Institute analysis 1 Based on data for 99 countries, 1964–2014. 70 30 10 5.5 80 5.04.50 1.5 2.0 3.00.5 2.51.0 40 20 6.56.04.03.5 50 7.0 60 90
- 24. Country population Billion Per capita GDP $ thousand, 2012 purchasing power parity United States Germany Japan France Italy Russia Mexico China India Nigeria Indonesia Brazil Turkey Luxembourg 1964 2.9 billion 2014 6.6 billion
- 25. McKinsey Global Institute Executive summary 2 desirable goals. Growth is a way to expand economic opportunities to the many millions of people who remain vulnerable and poor. The challenges of meeting pension and other social obligations that increase as the population ages and of managing public debt are less severe in a growing economy. Forthcoming MGI research suggests that countries such as the United Kingdom and France would need to achieve long- term GDP growth that is more than 50 percent faster than historically in order to start reducing the ratio of public debt to GDP, given current fiscal balances and interest rates.1 The deep uncertainty about long-term growth prospects makes it difficult for decision makers in the public and private sectors to prepare for the future. This research is an attempt to clarify the potential paths ahead. The analysis draws on nearly a quarter century of MGI research on economic growth across the globe. The aim is to provide a fact base of past performance and future outcomes if current trends continue, and then to identify and estimate the size of the levers that could alter the long-term growth trajectory. This report focuses on the G19 and Nigeria, looking in particular at trends in employment—people working outside the home as employees or self-employed (including subsistence farmers)— and productivity, the two major drivers of long-term GDP growth.2
- 26. 1 Given that debt levels are fixed at nominal currency, what matters for debt level reduction are changes in nominal GDP levels, not real GDP that is adjusted for inflation and is the focus in the rest of the report. This means that the 50 percent acceleration requirement applies to nominal GDP growth and can be met with different real GDP growth and inflation levels. Assuming inflation remains at historical levels, real GDP would need to accelerate by 50 percent; higher inflation in turn would reduce the real GDP growth threshold. The calculation on the GDP-growth acceleration required to start deleveraging assumes fixed projected interest rates on government bonds and inflation rates. For analysis on this topic, see the forthcoming McKinsey Global Institute report on debt and deleveraging. 2 For many countries, time-series data going back 50 years is limited for both employment components and labor productivity, defined as output per employee, by industry. For this reason, we chose to focus on 20 countries: the G19 (the G20 grouping without the European Union as a composite member) plus Nigeria. These 20 countries include a wide range of economies at different stages of their development with a major impact on global GDP and employment. Together, they account for 63 percent of the global population and 80 percent of global GDP. Box E1. GDP: Strengths and weaknesses We use changes in gross domestic product (GDP) as the metric for economic growth. Given the 50-year historical horizon of our analysis, there are no measures for assessing the overall economic evolution of a large number of countries other than GDP, the most widely available and commonly used metric.1 We anchor our
- 27. analyses on changes in aggregate GDP and look at changes in per capita GDP as a component of the total. Per capita GDP growth indicates improvements in material living standards and is itself a key economic indicator. The size of the overall economy matters, too. For companies, the market opportunities for their products and services reflect the number of consumers in each market as well as their average incomes. To assess environmental sustainability nationally and globally, incorporating the impact of the overall 1 The one alternative could be gross national income (GNI), which allocates income from production by the nationality of the owner rather than the output of production based on the physical domicile of operations. However, for our analysis that looks at how employment and labor productivity contribute to changes in output, the geographic data available on jobs and establishments makes the latter a more suitable choice. population is critical. More broadly, demographic trends can dramatically shape the economic, social, and political challenges and opportunities facing governments (for example, the capacity to meet social and debt obligations). We fully acknowledge the many measurement challenges and conceptual shortcomings associated with GDP and welcome the many initiatives under way to refine and broaden the measurement of growth.2 2 For an overview of the evolution of GDP as a measure of economic performance and the challenges in its measurement
- 28. and use, see Diane Coyle, GDP: A brief but affectionate history, Princeton University Press, 2014. For further discussion, see Human Development Reports published by the United Nations Development Programme since 1990 at www.hdr.undp.org/en; Millennium Development Goals reports and Beyond 2015 reports at www.un.org/millenniumgoals/reports.shtml; and the OECD’s Better Life Index at www.oecdbetterlifeindex.org/. Also see Joseph Stiglitz, Amartya Sen, and Jean-Paul Fitoussi, Report by the Commission on the Measurement of Economic Performance and Social Progress, 2009; Yusuf J. Ahmad, Salah El Serafy, and Ernst Lutz, eds., Environmental accounting for sustainable development, World Bank, June 1989; and Moving towards a common approach on green growth indicators, Green Growth Knowledge Platform scoping paper, April 2013. See Chapter 6 for further discussion. 3McKinsey Global Institute Global growth: Can productivity save the day in an aging world? Rapid GDP growth over the past 50 years was exceptional Over the past 50 years, two factors powered exceptionally fast GDP growth: a rapidly expanding labor force and rising average productivity. Growth in the labor force was fueled by two demographic trends. The first was brisk population growth, reflecting initially high fertility rates, falling infant-mortality rates, and lengthening life expectancy as hygiene and health-care provision advanced and expanded,
- 29. and casualties of war were reduced.3 The second was a rising share of those of working age in the population—a demographic dividend. Over time, the number of children in each family declined, and the share of people of working age—15- to 64- year-olds—in the population climbed sharply, from 58 percent in 1964 to 68 percent in 2014. Employment in the G19 and Nigeria grew at an annual rate of 1.7 percent in this period, doubling the total labor force and contributing about 48 percent of GDP growth in these economies. Rising productivity generated the other 52 percent of GDP growth. Productivity grew at an average annual rate of 1.8 percent between 1964 and 2014. A number of factors propelled productivity growth, including a shift from low-productivity agriculture to more productive manufacturing and service-sector jobs in cities, automation and more efficient operations, and increasing integration of the world economy that led to more productive modern businesses gaining share from less productive ones. The average employee generates 2.4 times as much output today as in 1964. Although the average pace of productivity growth was brisk, there were significant differences in the rate of that growth among economies. In Western European nations and the United States, labor productivity grew by between 1.5 percent and 1.9 percent a year from 1964 to 2014 from a relatively high base. Productivity growth during this period was exceptionally strong in South Korea and Japan, rising 4.6 and 2.8 percent per annum respectively, allowing
- 30. these economies to narrow their aggregate productivity gaps with Western Europe and the United States. Productivity in developed economies today remains almost five times that of emerging economies. Among developing economies, the variance in productivity performance has been much wider. There is no typical rate of productivity growth in these economies. China’s productivity grew at an annual pace of 5.7 percent between 1964 and 2014. In contrast, Mexico and Saudi Arabia clocked less than 1 percent annual productivity growth over this period. Overall, it is striking that the absolute gap between productivity in emerging and developed economies has not narrowed. Productivity in developed economies today remains almost five times that of emerging economies. Narrowing this gap is one of the biggest opportunities for—and challenges to—long-term global growth.4 Peak employment will occur in most countries within 50 years The strong demographic tailwind that powered GDP growth has come to an end and is starting to turn into a headwind in some countries. Fertility rates have declined, in many countries falling below the replacement threshold that needs to be met to keep the population steady. Population growth is expected to fall in all countries in the G19 but continue to grow rapidly in Nigeria. The boost to growth from a favorable shift in age structure has also come to an end. As the bulge of working-age
- 31. people grows older, the 3 Robert S. McNamara and James G. Blight, Wilson’s ghost: Reducing the risk of conflict, killing, and catastrophe in the 21st century, Public Affairs, 2003. 4 MGI has studied the reasons for sustained productivity gaps in more than 20 countries over the past 20 years. For more on this research, see www.mckinsey.com/mgi. www.mckinsey.com/mgi McKinsey Global Institute Executive summary 4 average share of the prime-working-age population in the G19 and Nigeria is expected to fall to 61 percent from 68 percent today. Only Nigeria bucks this trend. Taking all factors into account, average employment growth in the 20 countries studied is expected to wane to 0.3 percent a year over the next 50 years, less than one-fifth of the 1.7 percent growth observed between 1964 and 2014. There is a distinct prospect that employment in the 20 countries overall could peak around 2050 and then settle into a declining path (Exhibit E2). Employment prospects vary significantly. The number of employees has already peaked and started to decline in Germany, Italy, Japan, and Russia; their labor pools could shrink by up to one-third by 2064. In most other countries, employment is likely to peak within
- 32. 50 years. In China and South Korea, the peak is expected as early as 2024. China and India, the countries with the largest and second-largest populations in the world, respectively, are expected to follow very different paths. India’s labor pool could expand by 54 percent over the next 50 years, but China’s could shrink by one-fifth. Other nations, including Indonesia, South Africa, and the United States, are likely to continue to experience rising employment, albeit at slower rates. There is scope to use policy to boost labor-market participation among women, young people, and those aged 65-plus. We estimate that it is possible to double employment growth from 0.3 percent today to 0.6 percent in the 20 countries studied. However, achieving this doubling would require each gender and age group across countries to close Employees in G19 and Nigeria, 1990–2064E Billion, at best activity and unemployment rates, 2007–12 The global number of employees is likely to peak around 2050 Exhibit E2 Germany 2000 Japan 2003 China
- 33. South Korea 2024 Brazil 2041 Saudi Arabia 2045 Turkey 2048 Mexico 2055 Argentina 2057 India 2061 Italy 2010 Russia 2011 Historical Forecast Peak employment Total
- 34. Emerging Developed SOURCE: The Conference Board Total Economy Database; United Nations Population Division; W orld Bank; International Labour Organisation; McKinsey Global Institute analysis 1.5 2.5 1.0 0.5 2.0 0 20 401990 5010 302000 206460 5McKinsey Global Institute Global growth: Can productivity save the day in an aging world? the employment gap with high performers for the group—which would be very difficult.5 In any case, even 0.6 percent growth in employment is still only about one-third of the rate of the past 50 years, and insufficient to counter the erosion of the growth of the labor pool. At historical productivity-growth rates, long-term GDP growth would be 40 percent
- 35. slower than its rate of the past 50 years If productivity growth continued to rise over the next 50 years at its average rate between 1964 and 2014, the rate of global GDP growth would decline by 40 percent in the G19 and Nigeria—from 3.6 percent a year to only 2.1 percent (Exhibit E3). Putting this into perspective, average GDP growth over the next five decades would be one-third lower than it was over either the past five years of recovery from the global recession or the energy- crisis decade of 1974 to 1984. Over the course of 50 years, such a slowdown in growth would add up to a significant shift in the world’s growth trajectory. While the global economy expanded sixfold in the 50 years from 1964, it would grow only threefold between 2014 and 2064 (Exhibit E4). 5 To estimate the size of the potential to expand employment, we assume that all countries close current gaps to the employment rate of top-quintile performing nations in each demographic category. For prime-working- age women (aged 15 to 64), Norway and Canada, with a participation rate of 75 percent and unemployment at 5 percent, are the benchmarks. For young people, pre- recession United States is the benchmark, with a 55 percent participation rate and 10 percent unemployment rate. For prime-working-age men, the benchmark is 90 percent participation and, at most, 5 percent unemployment. For those aged 65-plus, the potential participation rate is set at 25 percent and unemployment rate at 10 percent. For nations that exceed these benchmarks in any of the categories, we use their current participation rates instead.
- 36. At past rates of productivity growth, GDP growth would slow down by about 40 percent and per capita GDP growth by about 20 percent Exhibit E3 SOURCE: The Conference Board Total Economy Database; United Nations Population Division; McKinsey Global Institute analysis NOTE: Numbers may not sum due to rounding. GDP Per capita GDP G19 and Nigeria Compound annual growth rate, % 1.7 1.8 1.8 0.3 2.1 -40%Productivity growth Next 50 years at historical productivity growth
- 37. Employment growth Past 50 years 3.6 1.8 1.8 -0.2 0.3 Employment per capita growth Past 50 years Productivity growth 2.1 Next 50 years at historical productivity growth 1.7 -19%
- 38. McKinsey Global Institute Executive summary 6 1.4 1.3 3.2 3.5 1.7 1.3 1.8 0.7 2.7 1.1 3.2 1.3 2.5 1.4 2.1 0.9 3.3
- 45. -33 -67 -11 -12 -14 -2 -11 -5 -28 -57 -7 -40 -26 At historical productivity-growth rates, GDP and per capita GDP growth are set to slow in most G19 countries Exhibit E4 NOTE: Numbers may not sum due to rounding. SOURCE: The Conference Board Total Economy Database; United Nations Population Division; International Labour
- 46. Organisation; McKinsey Global Institute analysis Change, % GDP growth Per capita GDP growth Change, % CAGR, past 50 and future 50 years Employment, productivity, and growth Medium UN population scenario, best activity and unemployment rates, 2007–12; compound annual growth rate (CAGR), %; future 50 years assumes past productivity growth rates for next 50 years CAGR, past 50 and future 50 years Productivity growthEmployment growth Employment per capita growth 7McKinsey Global Institute Global growth: Can productivity save the day in an aging world? The expected impact of waning demographic tailwinds on the global standard of living measured by per capita GDP is not as dramatic as it is on GDP growth. The expected fall in the share of the prime-working-age population age implies a 19 percent decline in the
- 47. growth rate of per capita income from the rate of the past 50 years. This would mean the standard of living rising by 2.3 times over the next half century compared with an increase of 2.8 times over the previous 50 years. Changing the long-term growth trajectory that appears to be in prospect will largely depend on the rate of productivity growth. Princeton University professor Alan Blinder commented in November 2014, “Maybe some of the copious attention now being devoted to assessing labor-market slack should be redeployed to studying productivity growth. It might be more productive.”6 Faster productivity gains can compensate for the waning of demographic tailwinds. To do so fully, productivity growth over the next 50 years would need to be 80 percent faster than the already high rate of the past 50 years. Productivity would need to accelerate by 22 percent to compensate for the shift in demographics on per capita income. In turn, productivity growth that is below its historical rate would mean even slower GDP and per capita income growth. There is large potential to improve productivity if all available levers are fully deployed MGI developed five sector case studies—agriculture, food processing, automotive, retail, and health care—to help us to understand the potential scope for accelerating productivity growth.7 Drawing on this analysis, we find that it is possible— but extremely challenging—to
- 48. boost the annual rate of productivity growth in the G19 and Nigeria to as much as 4 percent a year over the next decade. This would be more than the 80 percent acceleration required to compensate fully for waning demographic tailwinds. However, all available means to boost productivity growth would need to be deployed. The issue, in our view, is not that the world is running out of technological potential for growth but rather how to ensure that governments and company managers have a strong incentive to pursue higher productivity by adopting proven best practices from others and by innovating. Achieving a step change in productivity growth would necessitate strenuous efforts by business owners, managers, and workers to change established ways of doing things and to adopt new approaches that improve how they operate. Efforts to improve the traditionally weak productivity performance of large and growing government and health-care sectors around the world will be particularly important. 6 Alan S. Blinder, “The unsettling mystery of productivity,” The Wall Street Journal, November 25, 2014. 7 We used MGI’s micro-to-macro approach to assess opportunities for productivity gains in our five sector case studies. The sectors we studied are large employers that collectively represent diverse industries and productivity patterns. We drew on sector data from the World Input-Output Database, dozens of MGI country and industry studies, and McKinsey’s industry expertise across regions to understand patterns in productivity performance. We limit our projections to the period to 2025
- 49. rather than to 2064 because that is the period for which understanding today’s starting position can help to guide informed projections. 4% annual productivity growth potential McKinsey Global Institute Executive summary 8 Catching up to best-practice productivity could deliver three- quarters of the opportunity Roughly three-quarters of the total global potential for productivity growth that MGI has estimated comes from the broader adoption of existing best practices—which we can characterize as “catch-up” productivity improvements (Exhibit E5). The positive message here is that these types of opportunity are all known to us and exist somewhere in the world. Eighty percent of the overall opportunity to boost productivity in emerging economies comes from catching up. Opportunities include increasing the share of modern retail formats, increasing the scale and capacity utilization of auto assemblers, improving operational efficiency in health care, reducing waste in food processing, and shifting to a greater share of higher-value products or services. In developed economies, more than half—55 percent—of the productivity gains that MGI’s analysis finds are feasible could come from closing the gap between low-productivity
- 50. companies and plants and those that have high productivity. There are opportunities to continue to incorporate leaner supply-chain operations throughout retail, and to improve the allocation of the time spent by nurses and doctors in hospitals and health-care centers, for example. Across countries, large differences in average productivity within the same industry indicate industry-wide opportunities for improvement. For instance, low productivity in retail and other service sectors in Japan and South Korea reflects a large share of traditional small-scale retailers. High costs in the US health-care system partly reflect the excessive use of clinically ineffective procedures. Even agriculture, automotive manufacturing, and other sectors that have historically made strong contributions to productivity growth have ample room to continue to diffuse innovations and become more efficient.8 8 For additional examples, see the MGI reports Growth and renewal in the United States: Retooling America’s economic engine, February 2011; European growth and renewal: The path from crisis to recovery, July 2011; Beyond Korean style: Shaping a new growth formula, April 2013; and Why the Japanese economy is not growing: Micro barriers to productivity growth, McKinsey Global Institute, July 2000. For further examples of cross-country productivity gaps in different industries based on MGI’s productivity research over more than 20 years, also see James Manyika, Jaana Remes, and Jonathan Woetzel, “A productivity perspective on the future of growth,” McKinsey Quarterly, September 2014.
- 51. Approximately three-quarters of the productivity potential identified comes from catching up, and the rest from pushing the frontier SOURCE: McKinsey Global Institute analysis Exhibit E5 Emerging G19 75% 18% 45% 6 Developed 255% 82% 425% Pushing the frontierCatching up Potential per annum productivity growth rate % 9McKinsey Global Institute Global growth: Can productivity save the day in an aging world?
- 52. Pushing the productivity frontier through innovation could deliver the remaining one- quarter of the opportunity The remaining one-quarter of the opportunity to boost productivity growth—or about one percentage point a year—comes from technological, operational, and business innovations that go beyond today’s best practices and that “push the frontier” of the world’s GDP potential. In contrast to some observers, we do not expect a drying up of technological or business innovations to constrain growth. On the contrary, we see a strong innovation pipeline in developed and emerging economies in the sectors we studied.9 We cannot account for future developments that we cannot foresee today, and it is quite possible that waves of innovation may push the frontier far more than we can anticipate on the current evidence. In contrast to some observers, we do not expect a drying up of technological or business innovations to constrain growth. Some opportunities require simply continuing existing industry research programs, such as agricultural research into tailoring and improving seeds and agronomical practices to raise crop yields in new geographies, and automotive industry initiatives to power cars using more efficient fuel technology. Others rely on technological innovations that could potentially transform many different industries. For example, highly efficient and intelligent robots—
- 53. or bots—are already boosting efficiency in retail warehouses where they are deployed, mobile technology is increasingly being used to deliver health care in remote regions, and automobile manufacturers are installing a broader range of digital features in cars. Advanced materials such as nanolaminates—edible lipids or polysaccharide compounds—can be sprayed on food to provide protection from air or moisture and reduce food spoilage, while carbon-fiber composites can make cars and airplanes both more resilient and lighter.10 The Internet of Things can cut time spent in production processes by detecting potential failures early, increase crop yields by measuring the moisture of fields, and cut the cost of monitoring health dramatically.11 Such innovations are not confined to developed economies but are happening in emerging economies, too. For instance, Aravind Eye Care of India, which has become the largest eye-care facility in the world, performs cataract surgeries at one-sixth of the cost and with fewer infections than the National Health Service in the United Kingdom achieves.12 9 MGI has published extensively on the outlook for technology. See, for example, Big data: The next frontier for innovation, competition, and productivity, May 2011; Internet matters: The Net’s sweeping impact on growth, jobs, and prosperity, May 2011; The social economy: Unlocking value and productivity through social technologies, July 2012; China’s e‑tail revolution: Online shopping as a catalyst for growth, March 2013; Game changers: Five opportunities for US growth and renewal, July 2013; Lions go digital: The Internet’s
- 54. transformative potential in Africa, November 2013; Disruptive technologies: Advances that will transform life, business, and the global economy, May 2013; Global flows in a digital age: How trade, finance, people, and data connect the world economy, April 2014; and China’s digital transformation: The Internet’s impact on productivity and growth, July 2014. Also see the discussion of the transformative power of technology in Manufacturing the future: The next era of global growth and innovation, McKinsey Global Institute, November 2012. 10 Manufacturing the future: The next era of global growth and innovation, McKinsey Global Institute, November 2012. 11 Disruptive technologies: Advances that will transform life, business, and the global economy, McKinsey Global Institute, May 2013. 12 “Driving down the cost of high-quality care: Lessons from the Aravind Eye Care System,” Health International, McKinsey & Company’s Health Systems & Services Practice, issue 11, 2012. Visit www.mckinsey.com/client_ service/healthcare_systems_and_services/latest_thinking/health _international/archive/issue_11. McKinsey Global Institute Executive summary 10 The cross-cutting effects of digitization, including big data, and combinations of these technologies could yield astounding results. Think of the impact of a combination of big data and synthetic biology. The cost of gene sequencing is falling
- 55. sharply, making a huge amount of genetic data available. Scientists and companies are using these data to develop new techniques to write DNA and insert it into cells and are even designing DNA from scratch to produce desired traits—a practice known as synthetic biology.13 Ten enablers need to be in place to fuel long-term global growth Having ample opportunities to improve productivity does not guarantee that they will be realized. MGI first identified some of the productivity gaps that persist today more than ten years ago. Drawing on many years of analysis of productivity and growth as well as the new case studies in this report, we detail ten key enablers that would need to be in place to boost productivity growth and thereby help to lift the world economy’s long-term growth rate closer to its potential. These enablers broadly fall into four groups. � Enabling catch-up by creating transparency and competition. The first group of three reflects the barriers to catching up found in our sector case studies, as well as what we have learned from past MGI productivity studies: remove barriers to competition in service sectors, focus on efficiency and performance management in public and regulated sectors, and invest in physical and digital infrastructure, especially in emerging markets. � Helping to push the frontier by incentivizing innovation. The next four enablers
- 56. reflect the case studies in this report and MGI’s research on the economic impact of technology: craft a regulatory environment that incentivizes productivity and supports innovation, foster demand for and R&D investment in innovative products and services, exploit existing and new data to identify transformational improvement opportunities, and harness the power of new actors in the productivity landscape through digital platforms and open data. � Mobilizing labor to counter the waning of demographic tailwinds. The third group of enablers draws on the demographic analysis in Chapter 2 of this report as well as MGI’s body of analysis on global labor markets: put in place regulation and social support to boost labor-market participation among women, young people, and older people; and improve education and matching skills to jobs, and make labor markets more flexible. � Opening up economies to cross-border economic flows, from trade in goods and services to flows of people. Being open to global economic activity allows companies and economies to benefit from competition, the flow of ideas, and better practices and personal connections. This enabler draws on our sector case studies and previous MGI analysis of global flows.14 Companies are crucial to seizing the full range of opportunities to boost productivity growth. Much of the scope to improve productivity can be
- 57. achieved independently from government policy, whether this involves mechanization in agriculture in emerging countries or the adoption of best practices in merchandising and online retailing. Businesses need to play a full part as investors in upgrading capital and technology. They need to take risks by investing in R&D and unproven technologies and processes. They are central to efforts to mitigate the erosion of the growth of the labor pool by providing a more flexible working environment for women and older workers, and training and mentorship for young people. In an environment of potentially weaker global economic growth, and certainly evolving growth dynamics, executives need to be adaptable and informed. They need to anticipate where 13 Disruptive technologies: Advances that will transform life, business, and the global economy, McKinsey Global Institute, May 2013. 14 Global flows in a digital age: How trade, finance, people, and data connect the world economy, April 2014. 11McKinsey Global Institute Global growth: Can productivity save the day in an aging world? market opportunities are coming from, and the competitors they will meet in those markets. Above all, companies need to be competitive in a world where productivity will increasingly be the arbiter of success or failure.
- 58. In this report, we have looked at growth from a traditional economic standpoint. We have defined growth as expanding GDP and rising per capita GDP. But we acknowledge that this approach has limitations and that some big questions now being actively debated have not been addressed in any detail in this report. Some of the productivity enablers we have discussed will require making trade-offs that might be uncomfortable. Continued rapid growth will require increasing attention on productivity in resources if that growth is not to place undue strain on our environment. The good news here is that MGI has identified opportunities for being smarter about how we use our resources and therefore achieve growth that is ecologically responsible. The issue of how the fruits of growth are distributed has also become subject to intense debate in recent years. Rapid GDP growth has contributed to a significant closing of the income gap among nations but there appears to be increasing inequality within nations. While perspectives vary on potential solutions to rising inequality, the reality is that changes in average income will not be enough to increase demand if most of the gains accrue to individuals whose needs have already been met. Broad-based income gains will therefore also matter for the growth of markets for many products and services. We welcome these questions and hope that this report represents the start of a broader conversation about the nature of long-term growth and its implications for society.
- 59. ••• The past 50 years have been ones of extraordinary economic expansion around the world. But now one of the twin engines of growth—rapid labor-pool growth—has lost power. The world economy must forge ahead with just one remaining engine, productivity, firing at full throttle. Boosting productivity growth is now the only way to drive growth. However, the business and policy changes needed to sustain and accelerate productivity gains will undoubtedly involve tough trade-offs. We need to be clear- minded and have a frank discussion about the difficult decisions ahead. Leaders of companies will need to think even harder about every aspect of how they do business. Governments need to act on many fronts to help craft an environment that is conducive to growth. Only sweeping change—and being smarter about growth—will meet the challenge. Productivity and innovation need to be at the core of all conversations about long-term growth. Without giving them our full attention, global prosperity is in jeopardy. Mother with child holding plant © Alamy www.mckinsey.com/mgi E-book versions of selected MGI reports are available at MGI’s
- 60. website, Amazon’s Kindle bookstore, and Apple’s iBooks Store. Download and listen to MGI podcasts on iTunes or at www.mckinsey.com/mgi/publications/multimedia/. Cover image: Asian woman at construction site © Getty Images. Cover insets (left to right): Teaching apprentice in workshop © Alamy; biologist with microscope © Getty Images; young couple at a shopping center © Getty Images. Infographic by Darby Films, Inc. www.mckinsey.com/mgi www.mckinsey.com/mgi/publications/multimedia/ McKinsey Global Institute January 2015 Copyright © McKinsey & Company www.mckinsey.com/mgi @McKinsey_MGI McKinseyGlobalInstitute Big companies are finding growth in new markets by harnessing an underused asset—their brands. At a time of stagnating markets, technological disruption, and rapid changes in consumer
- 61. behavior, where can big brands find growth? One popular path is through brand extension: stretching a brand into an adjacent market where its value proposition is still relevant to consumers. Classic cases include Colgate’s sideways move from toothpaste to toothbrushes, Nivea’s from body care to hair care, and Gillette’s from razor blades to shaving foam. However, some incumbents are taking this approach a step further by using their brand as a springboard to drive innovation in an entirely new market. Take the Weather Company, which owns the Weather Channel, as an example. It has used its deep weather-data assets to move beyond the TV business, extending successfully into new markets by supplying data and forecast models that help companies make better decisions. Analyzing its data, for example, the Weather Company has learned that insect repellent sells well in the spring in Dallas when there is a below-average dew point, but spring bug-spray sales in Boston do well when the dew point is above average.1 Apple’s introduction of the iPhone is, of course, a well-known
- 62. example of how it became an attacker by carving out new business spaces that capitalize on the unique link its brands have forged with consumers. What is less well known, however, is that innovations not only achieve impressive results in their own right, but they often also create a halo effect by attaching new cachet to the original brand. In the year the iPhone was launched, for instance, sales of Apple Mac computers rose by 16 percent—almost eight times the growth rate for personal computers overall.2 This kind of brand-driven innovation has come of age in the past few years for a number of reasons. If you are an incumbent with a dominant position in a saturated market, your chances of gaining much more share may be slim. Entering a new category could be your only realistic option to achieve internal and external growth targets. In addition, brands are increasingly defined not by what they communicate or the campaigns they run but by the kind of customer experiences they provide. What’s more, brand-driven innovation can be a tool to strengthen or sharpen a brand’s positioning: consider how Apple’s brand strength seems to grow
- 63. with each new category it enters. Incumbents as attackers: Brand-driven innovation Jean-Baptiste Coumau, Victor Fabius, and Thomas Meyer M A Y 2 0 1 5 1 Katherine Rosman, “Weather Channel now also forecasts what you’ll buy,” Wall Street Journal, August 14, 2013, wsj.com. 2 Ed Sutherland, “Apple’s iPhone ‘halo effect’ boosts Mac sales 16.4 percent,” Cult of Mac, December 1, 2009, cultofmac.com. 2 Finally, the advent of 3-D printing and rapid-prototyping techniques, coupled with a “trial and error” mind-set and A/B testing capabilities, has made it easier for corporate innovation teams to pitch, trial, and continuously improve their brand ideas. All of which is to say: innovation isn’t just for start-ups. With the right brand equity, incumbents can do it too. The new attackers
- 64. Some powerful brands have highly distinctive characteristics or associations in consumers’ minds. When they capitalize on them to enter new territories— rather than simply colonizing a neighboring category—they bring innovation to their new domain. Here are three examples. Disney’s venture into the $4 billion children’s English-language teaching business in China capitalizes on its brand essence of representing the American way of life, entertaining children, and offering a great customer experience.3 Disney English opened its first school in Shanghai in 2008, just as the Shanghai Disneyland Park went into development, and has since expanded to 33 language centers in nine cities. The centers offer English- language courses that seek to make learning fun for 2- to 12-year-olds: children “interact” with Disney characters and stories via huge video monitors, and they are taught in small classes by native English speakers supported by bilingual Chinese assistants. In a country where Disney’s films and merchandising have yet to establish a broad market presence, using language learning to attract small children and their
- 65. families looks like a great entry point to the world’s biggest market and a sound investment in nurturing a future consumer base for Disney products. Another company harnessing its brand to drive innovation is of course Virgin, which recently used its “maverick outsider” image to power its challenger business in UK retail banking. Launched as Virgin Direct in 1995 with a limited product range, it bought Northern Rock in 2012, rebranded branches as Virgin Money, and introduced a full suite of banking and insurance products. Seeking to set itself apart from the distrust surrounding established banks in the wake of the global financial crisis, Virgin positioned itself as the customer’s champion with its “quest to make banking better,” opening inviting customer lounges as an alternative to the stuffy formality of established banks and branches. The strategy paid off: by 2013, new deposit as well as mortgage accounts were significantly outpacing the market average. A year later, Virgin Money launched a successful initial public offering. BMW, for its part, joined the attacker ranks with its entry into
- 66. the car-sharing business in 2011. DriveNow, a joint venture with rental company Sixt, provides urbanites with access to cars. In return for a registration fee and time-based charges, customers can choose from a f leet of Minis and BMWs. Via an app, drivers find the nearest available car, use a card to unlock it, and later 3 “Middle Kingdom meets Magic Kingdom,” Economist, August 26, 2010, economist.com. 3 leave it in any parking space in the city when their journey is complete. BMW described the venture as a “strategic response to the growth in urban living and shared ownership.”4 Starting in Germany, DriveNow has subsequently rolled out to London, San Francisco, and Vienna, so far. What differentiates BMW’s offering from competing initiatives is the appeal of driving stylish BMWs (including the i3 in some locations) and Minis, thereby—on the back of its brand strength—positioning itself as the car-sharing service for premium cars. Importantly, with the
- 67. initiative seen as a way to explore new forms of mobility, it has strengthened BMW’s reputation as an innovator.5 After early successes, DriveNow plans to expand to 15 more cities in Europe.6 These examples suggest that being good at line extensions gives incumbents a better chance of succeeding with brand extensions. Consider how Disney has gone from movies to theaters to amusement parks to merchandising, or how Amazon seems to do a line extension every few months. What it takes Incumbents have a number of assets and advantages that they can exploit to act as attackers in new markets. We believe there are three fundamental success factors: � Distinctive brand equity and trust. Virgin’s entry into High Street banking at a time when trust in the sector was at an all-time low enabled it to take advantage of its status as a brand known for giving customers a better deal. An established brand name can also act as a powerful form of endorsement in new markets: National Geographic Society’s shift from magazines to television channels, expeditions, and more recently, retail stores—that sell
- 68. books, clothes, and travel gear—is just one example. � Strong relationships with customers. BMW used its understanding of customers’ mobility needs as well as its existing perception of being a premium brand to enter a new category with a service that enables it to tap into a different need state. It also further strengthens its relationship with consumers who could, in the future, move out of town and buy its products. Similarly, the German baby-food manufacturer HiPP entered the baby-care market by appealing to customers’ desire for organic, natural, and caring products for their new babies. The brand is now the main challenger in the German baby- and child-care category, with a market share of 4.5 percent, trailing only the top three international incumbents. � Access to data, capabilities, and other institutional assets. Disney’s expertise in delivering distinctive customer experiences enabled it to rethink language learning in the Chinese market and create and execute a value proposition that no other provider could match. In Europe, Inditex, owner of the Zara fashion chain, combined its
- 69. intimate knowledge of customer preferences with its extensive supply and distribution networks and operational expertise to launch its interiors chain Zara Home in 2003. The Zara brand proposition of making runway 4 Sarah Spary, “BMW taps into sharing economy with launch of DriveNow across London,” Marketing Magazine, December 5 2014, marketingmagazine.co.uk. 5 Joan Voight, “BMW moves into Zipcar’s territory,” Adweek, May 16, 2014, adweek.com. 6 Andy Sharman, “BMW to launch pay-as-you-go car club in London,” Financial Times, November 30, 2014, ft.com. 4 fashion accessible to all has made a successful transition to the home-furnishing sector, with ten new markets entered in 2013 alone and almost 400 stores in 45 countries. Other types of assets can range from the technical—such as know-how, which drove Honda Motor Company’s
- 70. extension from cars to lawn mowers—to emotional, as seen in the “companionship” offered by Sony Corporation’s MP3 players and TVs. Successful brand extensions are likely to make use of all three of these advantages, rather than one in isolation. For instance, Disney’s venture into English- language teaching is built on its established brand equity in entertainment, its deep understanding of how to engage customers, and its operational capabilities and expertise in multiple countries and cultures. How to begin Not every established brand can succeed at entering new markets. To find out if yours can, start by asking, Does it have brand extension “angles,” or emotional benefits that could travel to other categories? If so, what might those categories be? And how can you use your benefits to create something new and different? Next, Where do you want to play? Define your brand’s aspirations to ensure you focus your innovation efforts appropriately. Then identify trends and discontinuities in tangential markets,
- 71. analyze the competitive landscape, and evaluate any customer relationships your brand may already have. Also important: successful attackers are careful to deconstruct their assets and understand which ones can drive value in new markets. Having selected your target markets, define your brand’s value proposition in them—a process that calls for a good dose of creativity, deep immersion in customer needs, and sharp insight into decision journeys. Many extensions have failed through lack of brand relevance. So ask, What is our brand’s value proposition? Does our brand fit this new angle? Does it serve an unmet need? As an incumbent, you need to assess a new market as thoroughly as a start-up would. The best performers invest in detailed analysis to estimate the scale of an opportunity. Is the growth potential worth the effort? What do the competitive dynamics look like? Such an analysis should uncover unmet needs that can highlight how much scope there is to introduce disruptive products or services. To understand customer needs and customer decision journeys, leading companies go beyond
- 72. the basics of existing data sets, focus groups, and surveys by adopting advanced qualitative research techniques. They use ethnographic studies, home interviews, in-store observations, mobile-photo journals, “netnography” (customer-sentiment mining), “shop alongs,” and a range of other innovative methods to check the fit between their proposed brand extension and their target consumers.7 7 For more on new market-research techniques, see Leah Boucher and John Forsyth, “Winning the research revolution—Take two,” McKinsey on Marketing and Sales, December 2014, mckinseyonmarketingandsales.com. 5 Once you’ve identified the right angle for your brand extension, embark on a rapid prototyping phase. Accept that some innovations—like Virgin Cola—won’t succeed, and adopt a test-and- learn, “fail fast” mentality. That way, an operation that f lops can be quickly closed down before
- 73. it does any real damage to your brand. We find that some pilots can be launched in as little as 12 weeks. Don’t allow a failure to drag on; it will weigh down your brand and taint it with mediocrity. Use conjoint analysis on any feedback you get to assess product trade-offs and define the value attached to various features. Finally, make sure your organization is fully prepared and ready to go. By definition, a brand- driven innovation will take you outside your core expertise. Make sure you have enough knowledge about the new business to judge the right moment to enter. Develop a rigorous “reverse profit and loss” that helps clarify the objectives and assumptions underlying your business model. Think about how competitors might react and what your response should be. Check out any regulatory aspects governing the new market and identify the variables that could affect cost projections and supply. Although it’s too early to judge how successful the new wave of incumbent attackers will be, it provides food for thought for established businesses seeking untapped pockets of growth outside
- 74. their core markets. Caution is needed; not every big brand has what it takes. But some brands, it seems, are so important to us that their entry into new markets can have dramatic effects—not only carrying consumers with them but also kick-starting new growth and giving a boost to core products too. Jean-Baptiste Coumau is a principal in McKinsey’s Paris office, where Victor Fabius is an associate principal; Thomas Meyer is a senior expert in the London office. Copyright © 2015 McKinsey & Company. All rights reserved. Journal of Management Research Vol. 11, No. 3, December 2011, pp. 131-137 Ajit Prasad Professor of Strategy SP Jain Institute of Management & Research DN Road, Andheri (W), Mumbai 400058 (India) The Impact of Non-Market forces on Competitive Positioning Understanding Global Industry Attractiveness
- 75. through the Eyes of M. E. Porter Ajit Prasad Abstract In 1980 Michael E Porter gave us the 5 forces model for analyzing industry attractiveness. These forces have their own individual determinants, but being behaviorally determined, they are obviously subject to the history and culture of the social fabric in which they operate. The paper looks at each of the forces and isolates non market influences like history, religion and culture that have influenced the competitive positioning of firms in specific markets. The instances discussed are obviously not completely exhaustive in their determination of the competitive positioning, but suggest a methodology that may be adopted for looking at the international attractiveness of foreign markets. It may thus be used to support and verify market entry decisions for MNCs. Keywords: Competition, industry analysis, culture and religion In 1980, Michel E Porter of the Harvard Business School gave us his understanding of competitive strategy based on the now famous 5 Forces Model (5FM) . Between 1980 and now, the 5FM has emerged as a unique tool in the analysis of the environment. It has also been used effectively as a
- 76. tool to support decision making in strategic choices1. It has been often criticized; it has more often been applauded; but it has never been ignored. In 1996, Mr. Andrew Grove, the then CEO of Intel added to the model a 6th force: the “Force of the Complementors” making the model even more complete to take into account the role of the government and the other environmental factors. In brief, Porter’s model tries to look at the environment and the strategic positioning of the firm in terms of the stability of the different forces that the firm has to contend with. Primarily these forces are: the bargaining powers of buyers and suppliers, (which between them take care of the input throughput output process); the threat of new entrants; the threat of substitutes, and of course the eternal “jockeying” for position among
- 77. the different players in the industry. These five coupled with the “Role of Complementors2”, which could be either positive or negative, gives the complete model of the factors that determine the competitive strategy of the firm. Consider the very basic 5FM for the airline industry. In the “jockeying for position” we have airlines like British Airways, Lufthansa, and United, each competing on its own differentiating factor. The Buyers can be segmented into the business travelers, vacationers etc. The Suppliers would be inputs like air-traffic control, food, newspapers, oil etc. The Substitutes, would be private jets and in the extreme case even trains. The New Entrants would be firms considering entering into the 132 Journal of Management Research market; and the Complementors can be
- 78. government policy or even (regretfully) any terrorist group that can shift the consumer preference from airlines to trains, i.e. change the balance of forces within the industry from outside. The five forces model has been used very effectively for defining market entry decisions. From the producers point of view the most favorable matrix of force intensity is one in which all the elements are “low” is the one which is favorable for market entry. On the other hand the sanguineness of moving from a “low “to a “high” market characteristics may be questioned. An often ignored factor in the determining of the force intensity has been the role of history and culture. Since the determination of the force intensity essentially tends to be an ordinal exercise the role of behavioral characteristics tend to be very strong. For example what would
- 79. explain why the buyers in Britain are much stronger group that buyers in America. Or on the other hand what would explain the inherent competitiveness of the Japanese industry, or why Bargaining Power of Suppliers “Jockeying for Position Bargaining Power of Buyers Threat of New Entrants Threat of Substitutes Role of the Complimentors PORTER’S FIVE FORCES MODEL Table 1: The impact of Non-market Forces on the Five Forces The forces Decomposition Historical Validation 1. Bargaining Power of Buyers Size, cross elasticities of UK (1756), the rise of the
- 80. demand, segmentation protestant ethics and the Industrial Revolution 2. Bargaining Power of Suppliers Size, relative market share, USA, civil war 1861, north south criticality, inventory management divide, role of catholic Vs protestants 3. Threat of new entrants Entrepreneurship, ability to South Korea (1960), the rise of cross- subsidize the Chaebols 4. Threat of substitutes Back to generics India (1930), Gandhian Economics, generic products etc 5. “Jockeying” for position Industry competitiveness Japan (1868), the Meji restoration and Matsukata’s boom and bust policy 6. Role of complementors Outside-the-industry influencers USSR (1991), Perestroika and Glasnost and the Role of McDonalds is it that Indian supermarkets will never see 73 varieties of bread, so common in its western counterparts, even if the income elasticities were the same. The answer would lie steeped in history
- 81. and culture that has determined the intensity of the forces. Volume 11, Number 3 • December 2011 133 Consider the above table which lists the five forces and their broad decomposition. The last column also isolates historical instances3 which have tended to influence the behavioral parameters that will influence the intensity of the forcers. Consider the following historical developments that have shaped the culture of a nation and has an impact on the intensity of different forces. THE PROTESTANT ETHIC AND THE RISE OF CAPITALISM The work of Max Webber is fairly exhaustive on this. The separation of the Church of England from Rome, and the resultant rise of the protestant ethic had a lasting impact on consumption pattern
- 82. in society. Weber clearly documents how the spirit of Protestantism led to low consumption rates and thus to high savings rates, which was basically funneled to finance the industrial revolution. Not only did capital movements have their own impact on the nature of expenditure pattern, but also the changing nature of consumption. The non- ostentation style of the Protestants was substantially different from the conspicuous consumption that characterized the Church in Rome. In Porter’s terminology, with the shift from the catholic ethic to the protestant one, the bargaining power of the buyer increased, and also his ability to say no to a large number of producers. This also explains in later centuries the phenomenal success of standardized discount stores like M&S and ASDA. The average British4 buyer today is very conscious of even penny
- 83. discounts, and has no problems shifting loyalty. The bargaining power of buyers here in the British society is probably higher than say in Germany or France who have not gone through this transition. THE MEJI RESTORATION With Commander Perry’s gun boat diplomacy, the restoration of the Meji, the role the then Finance Minister, Matsukata is essential in understanding the inherently competitive behavior of the Japanese industry. What has been often forgotten is that Matsukata’s inflationary boom-and-bust policy was the key to weeding out inefficient firms. With a farsightedness far beyond the conventional knowledge of economics, Matsukata followed a classic sine wave policy so far as fiscal policy was concerned. Having introduced an inflationary situation over a period of 5 years, wherein industry would grow substantially because of the cheap
- 84. availability of credit, he would for the next cycle, have a deflationary policy. This would lead to the inefficient industry being closed down. This policy followed over cycles spread over 30 years, ensured that the inefficient firms were effectively “weeded” out of the industry. It is this historical peculiarity that explains why the “Jockeying for position” tends to be higher in the Japanese industry than else where, something which also explains the generic strategy that Japanese firms tend to follow, based mainly on cost leadership than on product differentiation. THE US CIVIL WAR 1861-65 The War split the country between the industrial north and the agricultural south. The forefront issue was the issue of slavery. The secession of the south was not even considered because of the hidden agenda of the need to protect the cheap
- 85. supply of not only labor but wage goods that provided the stability for the industrial growth of the north. The south not only provided the essential raw materials, but because of their relatively higher incomes (income distribution was relatively skewed), following the low costs of production (slavery!), also served as a good market for the finished goods that were predominately produced in the north. The economic basis of the civil war has been well recognized, and perhaps explains in substantial detail, the initial competitiveness of the American firms in the area of supply chain management, which unfortunately they lost out to the Japanese in the post 60’s primarily on account of lagging behind so far as the innovation cycle was concerned. The federal structure of the US constitution, a necessary outcome of the civil war, can also explain to a large
- 86. degree the loss in competitiveness5. In Porters’ terminology, the bargaining power of suppliers will 134 Journal of Management Research be historically and culturally determined by events like the civil war. GANDHIAN ECONOMICS The Indian commodity and factor market has been extremely influenced by the thoughts of Mahatma Gandhi (affectionately christened as “the Father of the Nation”). Gandhian economics attacked the basics of consumer theory in that it questioned the fundamental premise that more consumption does not give more utility. In the spirit of Levitt’s differentiation between the core (generic) product and the peripheral product, Gandhi questioned the basis of product differentiation, in that his valuation of the utility of the peripheral product
- 87. was close to zero. For Gandhi the “core” product was all in all important, which he demonstrated in his personal life too. Examples abound from his loin cloth dress, to his habit of writing with a pencil stub, to his fasting to cutting down of more- than-necessary calories. This has affected the consumption habit of Indians (Generation X today of course is not too affected by the Gandhian philosophy) in terms of the Indians inevitable quest for the substitute generic product, which will alter the demand of the product. As an example we can see the differences between force intensities of substitutes between France and India so far as Shampoos are concerned., In France this threat is likely to be low. In India this threat is likely to be high because of the prevalent use of generic alternatives like “reetha” or “mud packs”. In some cases even legislation can increase the threat of
- 88. substitutes. Medical legislation in the US which prohibits doctors from prescribing brand names actually increases the threat from generic substitutes. SOUTH KOREAN CHAEBOLS The Korean chaebol is perhaps one of the unique institutions of the world. Post partition, the major source of growth in South Korea has been the growth of the chaebol (the family owned business). The top 3 (Hyundai, Samsung, LG) are well known brands all over the world, representing among them a high complex interrelated ownership structure and of course highly diversified conglomerates. This has been both a strength and weakness of the Korean economy, fuelling high growth on one hand, and as events of 1997 have proven can also prove to be the Achilles’ heel of the growth process. The existence of the chaebols
- 89. had contributed substantially to the growth of the market and industry structure not only in Korea but also in other countries where the group is present in a significant manner. In Porterspeak, this translates into, among other things, reducing the threat of potential entrants. The balance of forces in the Indian FMCG industry has been altered substantially by the entry of LG, which was hitherto only in the consumer durable industry. With LG’s decision to enter into the product categories of shampoos, toothpaste etc, the existing players in the industry have been wary of further capacity expansions, because of the inherent strength of LG in its ability to cross subsidize. This makes LG a formidable player not only in existing markets but also in potential markets that it may decide to enter into. PERESTROIKA, GLASNOST AND
- 90. MCDONALDS The influence of the external environment is extremely important in defining industry balance and attractiveness. This is explained by an example no better than the Russian experience of reforms (Perestroika) and openness (Glasnost). The contributions of Gorbachov towards reforming the Russian economy, given the disastrous economic consequences of its ill-timed expansionist policy in Afghanistan, were also influenced by the impact of western culture. Two events come to mind, the first the often quoted advent of McDonalds in Moscow and the now famous photographs of long overnight queues of aspiring customers waiting on a cold winter night, and the second, what I personally consider as having been underplayed by history, the impact of the Lennon-McCartney composition, “Back to the
- 91. USSR” in the sixties, which going by underground sales would have made it one of the biggest hits of its time. Both instances prove that the external Volume 11, Number 3 • December 2011 135 environment plays a significant role in determining the intensity of the forces that will define industry attractiveness. The recent advent of rock stars in India (Sting, Pink Floyd, Elton John etc) proves that the Indian market is an attractive one for western music. What often gets underplayed is the role that satellite television (MTV, Channel V, etc) has had in playing the role of the complementor. Two additional points may be taken into cognizance so far as the impact of culture on the Five Forces Model is concerned. One is the dimension of culture that be defined in the Hofstede’s framework. If we look at the four
- 92. dimensions of power distance, gender issues, risk averseness and individualism, and the now added time orientation, it is clear that these factors will also affect the intensity of the determining forces. Table 2 attempts to list some of the dimensions that need to be kept in mind. Thus international markets that have a greater proportion of women customers, or matriarchal driven societies are likely to have a different balance of forces than patriarchal societies. In India the differences between the markets of Kerala and Punjab come to mind immediately, as would in Europe, the differences between the French and German markets. The second factor that also needs to be kept in consideration is Porter’s own National Diamond for determining international competitiveness. In his 1990 treatise, he explores the determinants of
- 93. national competitiveness in terms of four factors, demand conditions, role of supporting industries and firm strategy, structure and rivalry. Each of these will have their own impact on the balance of the forces. The National Diamond The 5F Equivalent 1 Demand Conditions Bargaining Power of the Buyers 2 Factor Conditions Bargaining Power of the Suppliers 3 Role of Supporting Role of the Comple- Industries mentors, Threat of Substitutes 4 Firm Strategy, Structure Threat of New and Rivalry Entrants, Jockeying for Position Both Hofstede’s and Porter National Diamond bring a common understanding to the 5 forces model: that the behavioral element is important in understanding industry attractiveness. The study of
- 94. the present is important; the study of the past perhaps is more important. The understanding that history gives us of the present can also influence the strategies that we would follow in the future. One may well remember Orwell’s reflection, “who controls the present controls the past; who controls the past controls the future.” Table 2: Impact of Culture on the Five Forces Model Hofstede’s Determinants Influencing 1. Power Distance Decision making, relationship between Consumer and Customer, role of MIS, game theory, designing organizational structures etc 2. Masculinity Compensation designs, impacts on social costs, litigations, sexual harassments, inefficiencies associated with preferential policies 3. Uncertainty Avoidance Impact on entrepreneurship, the equation between risk and return etc 4. Individualism Impact on buyer behavior, market segmentation, costs of communication; approach to cluster behavior 5. Time Orientation Cycle times, inventory management, supply chain logistics, width and depth of distribution channel etc.
- 95. 136 Journal of Management Research CONCLUSIONS Constructing the five forces model even in the best of times is not an easy thing to do. Not only does it require a high degree of intellectual clarity and precision, but because of the essentially ordinal values of the force intensity, it also requires a good grounding in behavioral sciences, particularly history. Understanding the intensity of the different forces requires an in-depth analysis of the social fabric that surrounds the industrial organization. This appreciation of the social fabric is heightened by the knowledge of history and the resulting culture of the society and economy that the researcher would be considering. Multinational firms will find this approach invaluable in taking
- 96. decisions relating to market entry or even market exit, something that the traditional models, including Porter’s National Diamond itself may not be able to afford a definitive view. What we have suggested is an approach that may sound pedantic. Before a five forces model is constructed the researcher must delve into the social history that will determine constituent behavior. It is only by this process will the model so constructed will be reasonably robust to stand the test of researcher bias. This process will also bring out the true “beauty” of the five forces model in its use of intellectual rigor combined with pragmatic understanding of the social context. Our analysis is undoubtedly limited in that in the true spirit of comparative statics we have looked at individual events and their impact across the different forces. A more thorough approach would
- 97. involve a possibly computable GE model to take into account the simultaneity of the various factors that will determine the intensity of the forces. Nevertheless, in the true spirit of social science research, the paper does attempt to offer a model that can be followed in the further development of industry attractiveness analysis. NOTES 1. This is a use of the model that is often ignored. In the ideal situation the intensity of all the forces should be low. This serves as a good guideline in establishing decision criterion in making strategic choices. 2. Grove has taken a rather narrow view of the “Complementors” in that he would like to “think of them as “fellow travelers””. Possibly a broader view of the term is called for: firms that are outside the industry, but nevertheless have the power to influence the balance of forces within the industry. Complementors thus can play both positive and negative roles. 3. I would like to emphasize here that these are only singular
- 98. examples and are neither representative nor exhaustive. In reality there will be a large complex number of instances that will influence the behavioral characteristics. We are focusing on a finite set of instances merely to establish a methodology. 4. George Mikas, How to be an Alien: When people say England, they sometimes mean Great Britain, sometimes the United Kingdom, sometimes the British Isles, but never England. 5. In strict economic terms, a federal structure of the polity will lead to market segmentation, both in terms of the product and the factor markets. Segmentation has inherent inefficiencies built in the system which can explain the loss of competitiveness. It may be interesting to compare the strong federal structure of the US (and the now emerging federal structure in India) with the absence of the federal structure in Britain and in Japan to explain differences in competitiveness. This will of course have to be empirically tested. SELECT BIBLIOGRAPHY Appiah, K. A. and Gates, H. L. (1999), A Dictionary of Global Culture, Penguin. Collins, Larry and Lapierre, Domonique (1978), Freedom at Midnight, Bell Books.
- 99. Encyclopedia Britannica (1994), Relevant Sections. Holfstede, G. (1984), Culture’s Consequences, Sage. Volume 11, Number 3 • December 2011 137 Lee, K. (1999), Corporate Governance and Growth in Korean Chaebols, SNU. Leitzel, Jim (1995), Russian Economic Reform, Routledge. Levitt, Theodore (1980), Marketing Success through Differentiation, Harvard Business Review. Orwell, George (1977), 1984, Signet Classic, Penguin. Porter, M. E. (1990), The Competitive Advantage of Nations, Harvard Business Review. Porter, M. E. (1980), How Competitive Forces Shape Strategy, Harvard Business Review. Rawls, J. (1973), A Theory of Justice, Oxford. Spear, Percival, (1995), The Oxford History of India, Oxford. Weber, Max (1992), The Protestant Ethic and the Sprit of Capitalism, Harper Collins. Copyright of Journal of Management Research (09725814) is the property of South Asia Publications and its
- 100. content may not be copied or emailed to multiple sites or posted to a listserv without the copyright holder's express written permission. However, users may print, download, or email articles for individual use.