Download to read offline

![The challenge of raising productivity
The success stories—and failures—of the
1995-to-2000 productivity acceleration show why
companies need a comprehensive approach to
productivity.9
Walmart prioritized lowering costs
to offer higher-value-added goods, invested in a
hub-and-spoke distribution model to decrease
logistics costs, and deployed IT systems
specifically designed to improve in-store employee
efficiency. Intel prioritized ongoing development
of next-generation chips, standardized training,
and overhauled production processes to enable
quicker shifts to new higher-value-added products
that would sustain growth. Both companies
delivered significant productivity gains.
On the other hand, retail banking companies
created a more convenient customer experience
with online banking but failed to shift customers
from legacy products to higher-value-added
services. They made significant investments in
technology but not in employee training, ending up
9
McKinsey Global Institute, “US productivity growth, 1995–2000,” 2001.
10
Growth in GDP per capita, productivity and ULC, OECD.Stat; Over the 10 years preceding the [financial] crisis, trend labor productivity
growth declined in all G7 countries, particularly in France, Italy, and the United Kingdom. In the case of Canada, the United Kingdom and the
United States, the decline since the end of the 1990s marked a reversal of growth that coincided with the IT revolution. In other countries,
trend labor productivity growth has shown a gradual decline over the past 40 years [ending 2015] from relatively high rates; “Productivity
trends in G7 countries,” OECD iLibrary, Chapter 5.
with unused computing power that went beyond
the capabilities of the organization to leverage.
Hotels made significant investments in CRM
systems but continued to operate in silos, with
poor data sharing across properties, limiting the
potential benefits from creating better customer
experiences. They missed an opportunity to
extract more value from revenue management
systems because of a lack of employee training
and capability building.
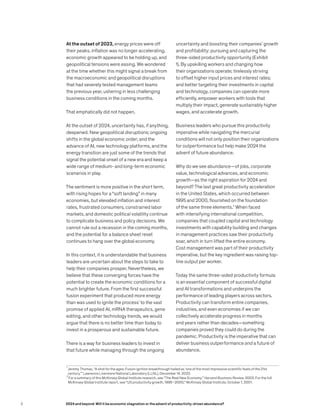
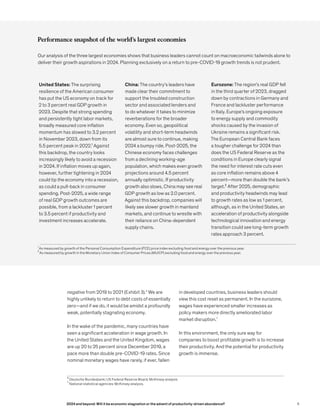
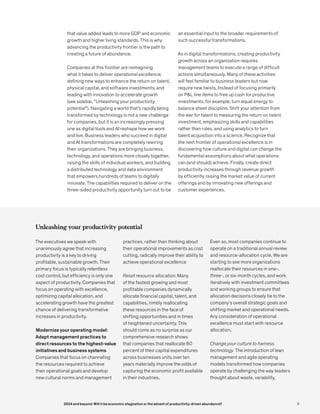
The challenge of creating productivity growth at
the economy level is likewise high, as the record
of G7 countries makes clear. In the 1995–2005
decade, growth in GDP per hour worked across
the G7 countries averaged just above 2 percent
annually (higher at the beginning of this period and
lower at the end). From 2010 to 2019, productivity
growth was just below 1 percent. In 2022,
productivity was negative in four G7 countries,
creating a roughly 0.5 percent decline for the
seven countries combined (Exhibit 4).10
Exhibit 4
Rates of productivity growth have been declining in G7 countries.
Trend GDP per hour worked, constant prices¹
1
Trend productivity growth derived using the Hodrick Prescott filter.
Source: OECD; McKinsey analysis
Rates of productivity growth have been declining in G7 countries.
McKinsey & Company
–2
–1
0
1
2
3
4
5
6
1970 1980 1990 2000 2010 2020
US
UK
Japan
Italy
Germany
France
Canada
13
2024 and beyond: Will it be economic stagnation or the advent of productivity-driven abundance?](https://image.slidesharecdn.com/2024-and-beyond-will-it-be-economic-stagnation-or-the-advent-of-productivity-driven-abundance-240410231536-614a0a6b/85/2024-and-beyond-will-it-be-economic-stagnation-or-the-advent-of-productivity-driven-abundance-pdf-13-320.jpg)
![Even productivity success can create unintended
consequences as the “creative destruction”
critical to productivity growth displaces existing
jobs, businesses, and industries.11
The last wave
of globalization lifted millions out of poverty but
entailed many consequences that were either
ignored, minimized, or simply missed along the
way. For example, the repercussions of labor
market polarization in the United States and
Europe (where high-education, high-wage and
low-education, low-wage jobs grew but middle-
paying jobs stagnated) are still being felt today.12
Governments, international institutions, and
businesses can choose to intentionally create an
environment conducive to productivity growth
and spend the resources to actively manage the
transition to new jobs, business opportunities,
and entire industries. Collectively this would lead
to prosperity that can be shared by all.
11
Shigeru Fujita, “Creative Destruction and Aggregate Productivity Growth,” Philadelphia Fed Business Review, Q3 2008; As originally
articulated by Joseph Schumpeter: “The fundamental impulse that keeps the capital engine in motion comes from the new consumers’
goods, the new methods of production and transportation, the new markets… [The process] incessantly revolutionizes from within,
incessantly destroying the old one, incessantly creating a new one. This process of Creative Destruction is the essential fact of
capitalism.” Joseph Schumpeter, “Capitalism, Socialism, and Democracy,” Third Edition, 1942.
12
David Autor; “Polanyi’s Paradox and the Shape of Employment Growth”, NBER Working Paper 20485, September 2014
Business productivity gains not only improve
company performance but translate into GDP
growth and higher living standards. Business
leaders who make decisions with this broader
view in mind have a higher chance of raising
shareholder returns while delivering on the
corporate purpose they had set out to achieve.
While delivering sustained productivity growth
is not easy, management teams have repeatedly
surmounted seemingly impossible challenges
over the past four years by taking unprecedented
actions, with exceptional speed, in the face of
enormous uncertainty. Leaders who internalize
these hard-won lessons and incentivize the
behaviors that have helped them weather the
recent period can significantly raise their odds of
outperformance and help make 2024 the advent
of future abundance.
Copyright © 2024 McKinsey & Company. All rights reserved.
Ezra Greenberg is a partner in McKinsey’s Stamford office, Asutosh Padhi is a senior partner in the Chicago office and
the North America managing partner, Sven Smit is chair of the McKinsey Global Institute and a senior partner in the
Amsterdam office.
The authors would like to thank Matt Banholzer, Vincent Bérubé, Rebecca Doherty, Steven Eklund, Arvind Govindarajan,
Sebastian Kohls, Alina Malinauskaite, Jake Matthews, Jake Milner, Nicholas Pingitore, Richard Sellschop, Erik Schaefer,
Zachary Silverman, Scott Schwaitzberg, Sarah Walker, Joris Wijpkema, and Shubo Yin for their contributions to this article.
14 2024 and beyond: Will it be economic stagnation or the advent of productivity-driven abundance?](https://image.slidesharecdn.com/2024-and-beyond-will-it-be-economic-stagnation-or-the-advent-of-productivity-driven-abundance-240410231536-614a0a6b/85/2024-and-beyond-will-it-be-economic-stagnation-or-the-advent-of-productivity-driven-abundance-pdf-14-320.jpg)

The document discusses the economic outlook for 2024 and beyond, arguing that pursuing productivity gains through upskilling workers, optimizing capital investments, and operating with excellence can lead to either economic stagnation or a new era of abundance. It notes uncertainties around inflation, interest rates, and demographic shifts that may constrain growth. However, it asserts that accelerating productivity across companies similar to the 1990s US can boost overall economic performance and standards of living if business leaders actively pursue the "three-sided productivity opportunity" of changing how their organizations operate, investing in technology and innovation, and offsetting higher costs. The document aims to convince readers that prioritizing productivity is the best path forward for both business success and economic prosperity in 2024