The document contains data from the 2017 Youth Risk Behavior Survey on various risk behaviors of high school students in the United States, including television watching, contraceptive use, number of sexual partners, computer/video game use, and history of sexual intercourse. The data is broken down by demographic categories such as sex, race/ethnicity, grade, sexual identity, and sex of sexual contacts.
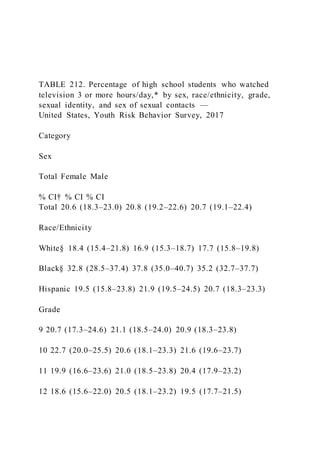
TABLE 212. Percentage of high school students who watched tele
1. TABLE 212. Percentage of high school students who watched
television 3 or more hours/day,* by sex, race/ethnicity, grade,
sexual identity, and sex of sexual contacts —
United States, Youth Risk Behavior Survey, 2017
Category
Sex
Total Female Male
% CI† % CI % CI
Total 20.6 (18.3–23.0) 20.8 (19.2–22.6) 20.7 (19.1–22.4)
Race/Ethnicity
White§ 18.4 (15.4–21.8) 16.9 (15.3–18.7) 17.7 (15.8–19.8)
Black§ 32.8 (28.5–37.4) 37.8 (35.0–40.7) 35.2 (32.7–37.7)
Hispanic 19.5 (15.8–23.8) 21.9 (19.5–24.5) 20.7 (18.3–23.3)
Grade
9 20.7 (17.3–24.6) 21.1 (18.5–24.0) 20.9 (18.3–23.8)
10 22.7 (20.0–25.5) 20.6 (18.1–23.3) 21.6 (19.6–23.7)
11 19.9 (16.6–23.6) 21.0 (18.5–23.8) 20.4 (17.9–23.2)
12 18.6 (15.6–22.0) 20.5 (18.1–23.2) 19.5 (17.7–21.5)
2. Sexual identity
Heterosexual (straight) 20.2 (18.3–22.2) 20.8 (19.1–22.6) 20.5
(19.0–22.1)
Gay, lesbian, or bisexual 27.2 (23.4–31.3) 22.1 (16.9–28.3) 25.6
(22.3–29.2)
Not sure 23.7 (17.5–31.2) 24.1 (16.3–34.1) 24.4 (19.9–29.4)
Sex of sexual contacts
Opposite sex only 21.3 (19.0–23.8) 22.5 (20.3–24.8) 21.9
(20.1–23.8)
Same sex only or both sexes 25.3 (20.6–30.7) 18.6 (11.2–29.4)
23.6 (18.7–29.3)
No sexual contact 20.5 (18.4–22.8) 19.3 (17.0–21.9) 19.9 (18.1–
21.9)
* On an average school day.
† 95% confidence interval.
§ Non-Hispanic.
TABLE 153. Percentage of high school students who did not use
any method to prevent pregnancy during last sexual
intercourse,* by sex, race/ethnicity, grade, sexual
identity, and sex of sexual contacts† — United States, Youth
Risk Behavior Survey, 2017
Category
4. Sex of sexual contacts
Opposite sex only 13.8 (10.8–17.4) 9.5 (7.8–11.6) 11.5 (9.7–
13.7)
Both sexes 22.6 (17.8–28.4) 10.2 (3.4–26.8) 20.8 (15.7–27.0)
* Among the 28.7% of students nationwide who were currently
sexually active.
† Students who had no sexual contact and students who had
sexual contact with only the same sex are excluded from the
analyses by sex of sexual contacts.
§ 95% confidence interval.
¶ Non-Hispanic.
TABLE 137. Percentage of high school students who had sexual
intercourse with four or more persons during their life, by sex,
race/ethnicity, grade, sexual identity, and
sex of sexual contacts* — United States, Youth Risk Behavior
Survey, 2017
Category
Sex
Total Female Male
% CI† % CI % CI
Total 7.9 (6.6–9.5) 11.6 (10.0–13.4) 9.7 (8.4–11.3)
Race/Ethnicity
5. White§ 8.5 (6.7–10.7) 8.6 (7.1–10.5) 8.6 (7.1–10.3)
Black§ 7.0 (5.1–9.7) 23.2 (18.5–28.7) 14.8 (11.7–18.5)
Hispanic 6.8 (4.9–9.4) 12.0 (9.9–14.5) 9.4 (7.5–11.8)
Grade
9 1.8 (1.1–3.0) 6.0 (4.6–7.9) 4.0 (3.0–5.3)
10 5.1 (3.8–6.7) 9.7 (7.6–12.2) 7.3 (5.8–9.2)
11 9.1 (7.0–11.7) 12.2 (10.3–14.4) 10.6 (8.8–12.6)
12 16.5 (13.8–19.5) 19.5 (16.2–23.3) 18.0 (15.5–20.8)
Sexual identity
Heterosexual (straight) 6.5 (5.5–7.8) 11.5 (9.8–13.5) 9.1 (7.9–
10.5)
Gay, lesbian, or bisexual 15.0 (11.2–19.9) 13.5 (8.8–20.3) 14.7
(11.2–18.9)
Not sure 8.0 (3.6–16.7) 10.7 (5.8–18.8) 9.9 (5.8–16.3)
Sex of sexual contacts
Opposite sex only 12.5 (10.7–14.6) 22.1 (19.3–25.2) 17.7
(15.5–20.1)
Same sex only or both sexes 30.1 (23.2–38.0) 24.2 (16.8–33.6)
28.6 (22.1–36.2)
* Students who had no sexual contact are excluded from the
analyses by sex of sexual contacts.
6. † 95% confidence interval.
§ Non-Hispanic.
TABLE 210. Percentage of high school students who played
video or computer games or used a computer 3 or more
hours/day,* by sex, race/ethnicity, grade, sexual
identity, and sex of sexual contacts — United States, Youth
Risk Behavior Survey, 2017
Category
Sex
Total Female Male
% CI† % CI % CI
Total 43.1 (40.3–45.9) 43.0 (40.5–45.5) 43.0 (41.1–44.9)
Race/Ethnicity
White§ 39.6 (35.4–44.0) 41.7 (38.0–45.5) 40.7 (37.7–43.8)
Black§ 46.7 (41.7–51.8) 47.7 (42.7–52.7) 47.2 (43.4–51.1)
Hispanic 46.8 (42.3–51.4) 43.9 (40.8–47.1) 45.4 (42.5–48.3)
Grade
9 44.0 (39.6–48.6) 45.7 (42.5–49.0) 45.0 (41.7–48.2)
10 46.5 (42.0–51.1) 43.6 (39.3–48.1) 45.1 (42.3–47.8)
7. 11 43.4 (39.2–47.7) 41.1 (36.5–45.8) 42.3 (38.5–46.1)
12 37.5 (33.6–41.5) 40.8 (37.6–44.1) 39.2 (36.7–41.8)
Sexual identity
Heterosexual (straight) 42.8 (40.4–45.2) 42.6 (40.3–45.0) 42.6
(41.0–44.3)
Gay, lesbian, or bisexual 51.5 (47.5–55.5) 57.4 (51.5–63.0) 52.9
(49.0–56.8)
Not sure 46.8 (38.4–55.5) 47.3 (38.2–56.7) 47.4 (39.3–55.6)
Sex of sexual contacts
Opposite sex only 46.0 (42.6–49.4) 40.7 (38.3–43.1) 43.1
(41.3–44.9)
Same sex only or both sexes 51.6 (45.7–57.4) 52.8 (43.8–61.5)
51.9 (46.1–57.6)
No sexual contact 42.4 (40.2–44.8) 46.3 (43.2–49.4) 44.3 (42.3–
46.3)
* Counting time spent on things such as Xbox, PlayStation, an
iPad or other tablet, a smartphone, texting, YouTube, Instagram,
Facebook, or other social media, for something that was not
school work, on an average school day.
† 95% confidence interval.
§ Non-Hispanic.
8. TABLE 134. Percentage of high school students who ever had
sexual intercourse, by sex, sexual identity, and sex of sexual
contacts* — selected U.S. sites, Youth Risk
Behavior Surveys, 2017
Site
Sex
Total
Sexual identity Sex of sexual contacts
Female Male
Heterosexual
(straight)
Gay, lesbian, or
bisexual Not sure Opposite sex only
Same sex only or
both sexes
% CI† % CI % CI % CI % CI % CI % CI % CI
State surveys
Alaska 38.7 (32.9–44.9) 35.3 (30.3–40.6) 36.9 (32.7–41.3) —§
— — — — — — — — —
Arizona 32.3 (27.3–37.8) 35.8 (31.2–40.7) 34.0 (29.8–38.5)
32.7 (28.9–36.8) 46.3 (35.7–57.3) 33.2 (18.9–51.5) — — — —
Arkansas 43.5 (36.8–50.5) 44.8 (36.4–53.6) 44.2 (38.6–49.9)
41.9 (36.6–47.5) 68.1 (55.4–78.5) 14.9 (5.2–35.7) 83.8 (78.9–
87.7) 82.0 (61.7–92.8)
15. 71.9 (65.5–77.5) 69.4 (57.8–79.0)
Palm Beach County, FL 32.1 (27.6–37.0) 38.3 (34.2–42.7) 35.2
(31.7–38.9) 33.9 (30.0–38.1) 44.1 (37.0–51.4) 38.1 (25.7–52.2)
74.2 (70.2–77.9) 69.6 (60.9–77.1)
Philadelphia, PA 35.7 (28.7–43.4) 45.9 (37.3–54.7) 40.4 (33.6–
47.6) 39.6 (32.3–47.3) 48.4 (38.4–58.5) 26.3 (15.0–41.8) 82.2
(76.0–87.1) 73.7 (61.4–83.1)
San Diego, CA 28.6 (24.6–32.9) 33.4 (29.8–37.2) 31.0 (27.7–
34.4) 31.1 (27.5–34.9) 38.1 (30.9–46.0) 18.7 (12.1–27.6) 65.3
(60.8–69.6) 60.6 (50.6–69.8)
San Francisco, CA 18.2 (15.1–21.6) 25.4 (22.5–28.4) 21.7
(19.3–24.2) 21.5 (19.0–24.2) 29.4 (20.9–39.6) 10.0 (5.5–17.4)
71.0 (66.8–74.9) 56.4 (44.1–68.0)
Shelby County, TN 37.7 (32.7–42.9) 52.8 (48.7–56.9) 44.4
(40.5–48.4) 44.3 (40.3–48.3) 49.8 (41.0–58.6) 18.2 (7.1–39.4)
80.7 (75.1–85.3) 74.0 (60.4–84.2)
Median 32.2 42.7 37.2 36.0 49.1 23.4 77.3 69.5
Range 18.2–45.6 25.4–54.6 21.7–49.2 21.5–49.1 29.4–57.6
10.0–38.1 65.3–85.6 50.1–80.9
* Students who had no sexual contact are excluded from the
analyses by sex of sexual contacts.
† 95% confidence interval.
§ Not available.
16. TABLE 136. Percentage of high school students who had sexual
intercourse for the first time before age 13 years, by sex, sexual
identity, and sex of sexual contacts* —
selected U.S. sites, Youth Risk Behavior Surveys, 2017
Site
Sex
Total
Sexual identity Sex of sexual contacts
Female Male
Heterosexual
(straight)
Gay, lesbian, or
bisexual Not sure Opposite sex only
Same sex only or
both sexes
% CI† % CI % CI % CI % CI % CI % CI % CI
State surveys
Alaska 2.8 (1.6–4.9) 4.6 (2.7–7.5) 3.7 (2.5–5.6) —§ — — — —
— — — — —
Arizona 1.1 (0.5–2.4) 4.3 (1.9–9.1) 2.7 (1.4–5.1) 2.4 (1.3–4.7)
5.4 (2.3–12.2) 0.3 (0.0–2.8) — — — —
Arkansas 4.5 (2.7–7.6) 5.3 (3.1–9.0) 4.9 (3.3–7.2) 3.3 (1.9–5.9)
17.9 (10.9–28.0) 5.6 (1.2–23.0) 6.6 (3.8–11.3) 17.8 (9.3–31.5)
20. Median 2.1 4.3 3.3 2.7 6.9 5.8 5.8 12.8
Range 1.0–4.5 2.2–8.4 2.1–6.0 1.4–4.8 2.7–17.9 0.3–12.7 2.8–
9.7 7.6–18.5
Site
Sex
Total
Sexual identity Sex of sexual contacts
Female Male
Heterosexual
(straight)
Gay, lesbian, or
bisexual Not sure Opposite sex only
Same sex only or
both sexes
% CI† % CI % CI % CI % CI % CI % CI % CI
Large urban school district surveys
Baltimore, MD — — — — — — — — — — — — — — — —
Boston, MA 1.8 (0.9–3.3) 11.3 (8.8–14.3) 6.6 (5.3–8.3) 6.4
(4.9–8.2) 7.9 (4.1–14.6) 5.2 (1.6–15.9) 11.2 (8.5–14.6) 15.3
(8.7–25.5)
23. Median 1.8 7.3 4.7 4.3 7.1 4.7 9.2 12.2
Range 0.6–3.2 3.9–15.5 2.7–9.0 2.7–9.9 3.2–10.4 0.0–10.9 4.8–
15.7 9.0–18.6
* Students who had no sexual contact are excluded from the
analyses by sex of sexual contacts.
† 95% confidence interval.
§ Not available.
TABLE 155. Percentage of high school students who drank
alcohol or used drugs before last sexual intercourse,* by sex,
race/ethnicity, grade, sexual identity, and sex of
sexual contacts† — United States, Youth Risk Behavior Survey,
2017
Category
Sex
Total Female Male
% CI§ % CI % CI
Total 15.9 (14.1–17.9) 21.6 (19.3–24.2) 18.8 (17.1–20.5)
Race/Ethnicity
White¶ 16.6 (14.2–19.4) 20.9 (17.6–24.7) 18.7 (16.6–21.0)
Black¶ 16.0 (10.7–23.1) 23.9 (19.3–29.2) 20.1 (16.8–23.8)
Hispanic 12.6 (9.7–16.2) 22.6 (18.0–27.8) 17.7 (14.5–21.4)
24. Grade
9 17.8 (12.2–25.3) 24.2 (17.2–32.9) 21.3 (15.9–27.8)
10 14.1 (10.3–19.1) 25.6 (20.1–31.9) 19.7 (16.6–23.2)
11 13.8 (10.9–17.3) 14.8 (11.4–19.0) 14.2 (12.1–16.6)
12 17.5 (15.0–20.3) 23.3 (18.9–28.5) 20.3 (17.8–23.2)
Sexual identity
Heterosexual (straight) 14.1 (12.1–16.4) 21.3 (18.8–24.2) 18.0
(16.0–20.1)
Gay, lesbian, or bisexual 20.2 (15.4–26.1) 21.5 (10.1–39.8) 20.3
(16.0–25.3)
Not sure 30.7 (17.8–47.6) 35.1 (14.2–63.9) 34.6 (22.5–49.1)
Sex of sexual contacts
Opposite sex only 13.2 (11.2–15.4) 21.7 (19.0–24.7) 17.7
(15.7–20.0)
Same sex only or both sexes 26.1 (19.6–33.7) 20.0 (9.4–37.5)
24.8 (18.7–32.1)
* Among the 28.7% of students nationwide who were currently
sexually active.
† Students who had no sexual contact are excluded from the
analyses by sex of sexual contacts.
§ 95% confidence interval.
¶ Non-Hispanic.
25. TABLE 133. Percentage of high school students who ever had
sexual intercourse, by sex, race/ethnicity, grade, sexual identity,
and sex of sexual contacts* — United
States, Youth Risk Behavior Survey, 2017
Category
Sex
Total Female Male
% CI† % CI % CI
Total 37.7 (34.3–41.2) 41.4 (38.6–44.3) 39.5 (36.8–42.4)
Race/Ethnicity
White§ 38.7 (34.4–43.2) 38.5 (35.5–41.6) 38.6 (35.4–41.9)
Black§ 39.4 (34.6–44.4) 52.7 (46.8–58.5) 45.8 (41.3–50.3)
Hispanic 37.9 (33.0–43.0) 44.1 (39.4–48.9) 41.1 (36.5–45.9)
Grade
9 17.2 (14.2–20.7) 23.3 (19.9–27.2) 20.4 (17.8–23.2)
10 34.4 (30.2–38.8) 38.0 (34.1–41.9) 36.2 (32.9–39.5)
11 45.8 (41.4–50.3) 48.8 (45.1–52.5) 47.3 (44.1–50.6)
12 55.8 (51.0–60.5) 58.9 (54.5–63.2) 57.3 (53.1–61.4)
26. Sexual identity
Heterosexual (straight) 36.3 (32.6–40.1) 41.6 (38.6–44.7) 39.1
(36.1–42.2)
Gay, lesbian, or bisexual 50.1 (44.3–55.8) 42.5 (35.2–50.2) 48.4
(43.9–52.9)
Not sure 25.7 (19.0–33.8) 30.8 (21.7–41.7) 28.4 (22.2–35.5)
Sex of sexual contacts
Opposite sex only 76.6 (72.2–80.5) 79.6 (76.9–82.0) 78.2
(75.1–81.0)
Same sex only or both sexes 74.0 (67.7–79.4) 76.1 (69.5–81.6)
74.5 (69.9–78.7)
* Students who had no sexual contact are excluded from the
analyses by sex of sexual contacts.
† 95% confidence interval.
§ Non-Hispanic.
TABLE 135. Percentage of high school students who had sexual
intercourse for the first time before age 13 years, by sex,
race/ethnicity, grade, sexual identity, and sex of
sexual contacts* — United States, Youth Risk Behavior Survey,
2017
Category
Sex
27. Total Female Male
% CI† % CI % CI
Total 2.0 (1.6–2.5) 4.8 (4.0–5.7) 3.4 (3.0–3.9)
Race/Ethnicity
White§ 1.8 (1.2–2.5) 2.3 (1.7–3.2) 2.1 (1.7–2.6)
Black§ 2.5 (1.4–4.5) 12.8 (9.7–16.7) 7.5 (5.9–9.5)
Hispanic 1.9 (1.2–3.1) 6.0 (4.9–7.2) 4.0 (3.3–4.7)
Grade
9 2.2 (1.4–3.5) 5.7 (4.3–7.7) 4.1 (3.2–5.2)
10 2.2 (1.4–3.4) 4.6 (3.4–6.1) 3.4 (2.6–4.4)
11 1.2 (0.6–2.4) 3.5 (2.6–4.5) 2.3 (1.8–2.9)
12 1.9 (1.3–2.9) 5.1 (3.9–6.6) 3.5 (2.8–4.4)
Sexual identity
Heterosexual (straight) 1.3 (0.9–1.8) 4.6 (3.8–5.6) 3.0 (2.5–3.7)
Gay, lesbian, or bisexual 5.2 (3.6–7.4) 8.1 (4.5–14.1) 6.1 (4.6–
8.0)
Not sure 2.5 (1.2–5.3) 4.6 (2.1–9.8) 4.1 (2.5–6.4)
Sex of sexual contacts
Opposite sex only 2.8 (2.0–4.0) 8.4 (7.0–10.0) 5.8 (4.9–7.0)
28. Same sex only or both sexes 8.2 (6.1–11.1) 17.5 (10.3–28.0)
10.5 (8.0–13.7)
* Students who had no sexual contact are excluded from the
analyses by sex of sexual contacts.
† 95% confidence interval.
§ Non-Hispanic.