2. j o u r n a l o f m a t e r i a l s p r o c e s s i n g t e c h n o l o g y 2 0 4 ( 2 0 0 8 ) 486–491 487
Fig. 1 – A standard pilger die. The location of the residual
stress measurement and the orientation of the X-ray are
indicated by a circle and a double-headed arrow,
respectively in the insert.
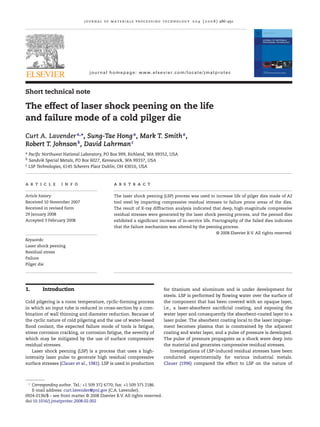
residual stresses and the fatigue properties of various met- Fig. 2 – The results of the residual stress measurement for
als and alloys based on the results of previously reported the LSP-die and the standard die.
´
studies. Hong and Chengye (1998) and Rubio-Gonzalez et al.
(2004) investigated the effects of LSP on the material proper-
ties including fatigue life and fatigue crack growth of 2024-T62
2. Methods
aluminum alloy (Hong and Chengye, 1998) and 6061-T6 alu-
´
minum alloy (Rubio-Gonzalez et al., 2004). The results of the
The pilger dies used for this study, as shown in Fig. 1, were
both studies showed that the fatigue life of the LSP processed
fabricated from A2 tool steel with a hardness of between 57
specimens were significantly improved. According to Hong
and 59 Rockwell C by double tempering at 510 ◦ C. The chemical
and Chengye (1998), the fatigue behavior improvements were
composition of A2 tool steel (ASM, 1993) is listed in Table 1. The
attributed to a combination of increased dislocation density,
tapered-groove in the die was ground in a stepwise movement
decreased surface roughness and compressive residual stress
with a circumferential sweeping pattern across the section
induced by the laser shock waves. Montross et al. (2002) also
of the groove. The pilger reduction selected for the test was
provided an excellent review regarding the current status of
a pass used to produce a nominal 6.35 mm outside diameter
research and development on LSP.
(OD) Ti3Al2.5V texture-controlled aircraft hydraulic tube from
The objective of this study was to investigate the effect of
an input tube with an initial OD of 9.14 mm with 78% reduction
LSP on the life and failure behavior of pilger dies made of A2
of area. The LSP-dies were prepared by laser shock peening
tool steel. First, the life of a LSP processed die (or simply LSP-
die) was determined by in-process inspection of the formed
tubes. Next, the residual stress on the LSP-die as a function of
depth was measured by X-ray diffraction (XRD) analysis and
chemical milling. Finally, the failure of the LSP-die was ana-
lyzed using a scanning electron microscope (SEM). The life,
residual stress, and the failure of the LSP-die were compared
with those of a die made by a standard die production process.
Table 1 – The chemical composition (wt%) of A2 tool steel
C 0.95–1.05
Cr 4.75–5.50
Si 0.5 max
Ni 0.3 max
Mn 1.00 max
Mo 0.9–1.40
V 0.15–0.50 Fig. 3 – Surface appearance of the LSP-die before
Fe Balance
experiments.
3. 488 j o u r n a l o f m a t e r i a l s p r o c e s s i n g t e c h n o l o g y 2 0 4 ( 2 0 0 8 ) 486–491
of standard dies at LSP Technologies Inc. (LSPT; Dublin, OH)
using a power density of 10 GW/cm2 . Standard dies that had
not received any peening were used as a comparison to the
performance of the LSP-dies.
The life of the pilger die was determined by in-process
visual inspection of the tubes being processed. Visual inspec-
tion of the OD surface of the in-process sample tube, selected
on a pre-determined schedule, was performed to look for evi-
dences of die cracks. When the pilger die begins to crack, a
small impression of the crack is rolled into the tube surface
and is visible to a trained operator at 35× magnification. As the
pilger process cycles the die, the crack grows and the impres-
sion becomes larger. When the crack impression could not be
Fig. 4 – The failure locations of the LSP-die and the removed from the tube surface with light sanding using 400
standard die relative to the key slot. grit sandpaper, the die was considered “cracked-out” and the
length of the tube processed for the die was recorded as the
life of the die.
XRD residual stress measurements were performed on the
LSP-die and the standard die using the sin2 method in accor-
Fig. 5 – The failure regions associated with the “cracked out” rating for (a) the LSP-die and (b) the standard die, respectively.
Note that the unit of the scales in the pictures is mm.
4. j o u r n a l o f m a t e r i a l s p r o c e s s i n g t e c h n o l o g y 2 0 4 ( 2 0 0 8 ) 486–491 489
dance with SAE HS-784 (2003), employing the diffraction of
Cr K␣ radiation from the (2 1 1) planes of the BCC structure
of the A2 steel. The XRD residual stress measurements were
made at the surface and at various nominal depths up to
approximately 1.6 mm. The location of the residual stress
measurement and the orientation of the X-ray are indicated in
the insert in Fig. 1 by a rectangle and a double-headed arrow,
respectively and indicating that the X-ray was oriented to best
approximate the hoop residual stress.
3. Results and discussion
The LSP process was effective at creating deep compressive
residual stress in the root radius of the pilger die. As shown by
the residual stress plot in Fig. 2, the LSP-die and the standard
die showed similar compressive residual stresses (≈1.05 GPa)
at the surface. However, at approximately 0.01 mm depth, the
residual stress in the standard die dropped to near 0 whereas
the residual stress in the LSP-die was still nearly 900 MPa.
Remarkably the LSP-die had a compressive residual stress of
approximately 200 MPa at 1 mm depth and the residual stress
finally dropped to near 0 at about 1.5 mm depth.
The die surface finish was visually inspected after LSP, and
pits were observed. The pits were attributed to the peening
process and were subsequently eliminated in later LSP trials;
the LSP-dies discussed in this paper had the pitting. The mor-
phology of the pits is shown in Fig. 3 and they were found
to be approximately 0.2 mm in diameter and very shallow
(creating difficulties for photographing). However, even with
the small pits, the LSP-die-set produced approximately 300%
more tubing than the average standard production die set
before failure and showed the highest die life ever measured Fig. 6 – Cracked areas approximately 25 mm from the
for this pass. The increase of 300% represented a statistically “cracked out” regions shown in Figs. 4 and 5 for (a) the
significant life improvement and was more than 8 standard LSP-die and (b) the standard die, respectively.
deviations greater than the average standard production die
life.
The LSP-die failed in nominally the same location relative scattered short cracks in the damaged area in contrast to the
to the fixed key slot position as the standard die as shown in continuous cracks in the standard die.
Fig. 4 and the location is typical of standard production die Higher magnification views of the regions associated with
failure location. Note that the location of the groove within die “crack out” are given in Fig. 7(a–c). Comparison of Fig. 7(a)
the die is controlled by a key slot used to index the die in the and (b) shows that the LSP-die failed by a flaking process
grinder. The optical photographs in Fig. 5(a) and (b) show the rather than a sharp propagating crack as observed in the stan-
specific regions of the die associated with the “cracked out” dard die. With a higher magnification in Fig. 7(c), it can be
rating from the previously described visual inspection for the seen that there are no sharp or propagating cracks associated
LSP-die and the standard die, respectively and suggest that with the cracked out region of the LSP-die and that materials
the failure of the dies was related to the cracks/pits in the has flaked and fallen from the die as opposed to the rela-
root of the groove. The occurrence of the failure in the root tively undeformed and failed section of the standard die in
of the groove is reasonable since the pilgering process, which Fig. 7(b).
reduces the diameter of the tube, induced an opening mode The “flaked” appearance of the LSP-die failure could be
to the groove, and it is intuitive that the highest stress should related to corrosion given that the extended life resulted in
occur at the root of the groove. Importantly, Fig. 5(a) and (b) also the die being in the mill for many more days, however more
shows that the die cracks in the standard die had propagated likely the flaked appearance of the LSP-die failure may be
along the groove out of the field of view whereas the cracks in related to the interaction of the crack process zone and the
the LSP-die were rather isolated and did not propagate much. deep (and high) compressive residual stress similar to that
The difference in the crack propagation behavior of the LSP-die described by Rosenfield (1981) for sheet rolling dies. In this
and the standard die also can be seen in the SEM micrographs scenario the die fails by plastic deformation and ultimately
in Fig. 6(a) and (b), which were taken at approximately 25 mm “flaking” rather than the easy crack propagation observed in
to the narrower end of the tapered-groove from the “cracked low fracture toughness materials like A2. Given the extended
out” regions. Fig. 6(a) and (b) confirms that the LSP-die shows life, it is also possible that the failure of the LSP-die has been
5. 490 j o u r n a l o f m a t e r i a l s p r o c e s s i n g t e c h n o l o g y 2 0 4 ( 2 0 0 8 ) 486–491
Fig. 7 – SEM images of the most severe regions of the cracks for (a) the LSP-die and (b) the standard die, respectively. (c) A
higher magnification of the failed surface of the LSP-die in Fig. 6(a).
originated from other mechanism, for example, wear or fric- • LSP was effective at increasing the life of the pilger die as
tion. measured by the length of tubing produced. The laser pro-
It is possible that the pits associated with LSP process cessed die had the highest life of all dies used to process this
caused the small and isolated cracks, which may accelerated tube size and exceeded the average die life by three times.
the initiation of the “flaked” appearance failure of the LSP- • Pitting associated with laser peening process appeared to
die. Undoubtedly, the cracks would ultimately propagate and contribute to the observed cracking in the die and may have
some of the LSP-die cracks are sharp, as shown in the left side limited the die life.
of Fig. 6(a), however due to the very high compressive residual • The failure appearance of the laser-peened die is different
stress the crack growth rate was slowed and consequently the from the standard die and may have been related to corro-
LSP-die failed (“cracked out”) by a different mechanism prior sion or high compressive forming stresses that prevented
to the crack propagation like that observed in the standard die. crack propagation. The die failure mode was changed from
the classic crack propagation observed in low toughness
steels to plastic deformation that resulted in flaking.
4. Conclusions
As a result of this study the following conclusions were
reached: Acknowledgements
The authors would like to acknowledge contributors to this
• LSP was effective at generating deep compressive residual project: Professor M. Ramulu of the University of Washington,
stresses in the pilger die groove. At a depth of 0.1 mm the for advice and motivation and the late Dr. Sidney Diamond of
compressive residual stress in the LSP-die was 900 MPa and the U.S. Department of Energy Office of Fuel Cells and Vehicle
while the compressive residual stress in the standard die Technology for funding and advice on this project collabora-
was nearly 0 at the same depth. tion.
6. j o u r n a l o f m a t e r i a l s p r o c e s s i n g t e c h n o l o g y 2 0 4 ( 2 0 0 8 ) 486–491 491
references Montross, C.S., Wei, T., Ye, L., Clark, G., Mai, Y.-W., 2002. Laser
shock processing and its effects on microstructure and
properties of metal alloys: a review. Int. J. Fatigue 24,
1021–1036.
ASM, 1993. ASM handbook. In: Properties and Selection: Irons, Rosenfield, A.R., 1981. Wear and fracture mechanics. In: Rigney,
Steels and High Performance Alloys, vol. 1. ASM International D.A. (Ed.), Fundamentals of Friction and Wear of Materials.
Metals Park, Ohio. ASM Metal Park, pp. 221–234.
Clauer, A.H., 1996. Laser shock peening for fatigue resistance. In: ´ ˜
Rubio-Gonzalez, C., Ocana, J.L., Gomez-Rosas, G., Molpeceres, C.,
Gregory, J.K., Rack, H.J., Eylon, D. (Eds.), Surface Performance of Paredes, M., Banderas, A., Porro, J., Morales, M., 2004. Effect of
Titanium. TMS, Warrendale, pp. 217–230. laser shock processing on fatigue crack growth and fracture
Clauer, A.H., Holbrook, J.H., Fairand, B.P., 1981. Effects of laser toughness of 6061-T6 aluminum alloy. Mat. Sci. Eng. A 386,
induced shock waves on metals. In: Proceedings of the Society 291–295.
of Photo-Optical Instrumentation Engineers. Plenum Press, SAE HS-784, 2003. Residual stress management by X-ray
New York, pp. 675–702. diffraction. SAE, Warrendale, PA.
Hong, Z., Chengye, Y., 1998. Laser shock processing of 2024-T62
aluminum alloy. Mat. Sci. Eng. A 257, 322–327.