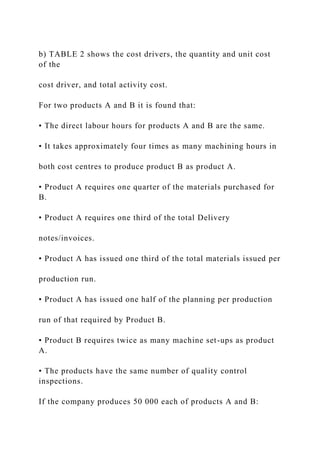
b) TABLE 2 shows the cost drivers, the quantity and unit cost of the
cost driver, and total activity cost.
For two products A and B it is found that:
• The direct labour hours for products A and B are the same.
• It takes approximately four times as many machining hours in
both cost centres to produce product B as product A.
• Product A requires one quarter of the materials purchased for B.
• Product A requires one third of the total Delivery
notes/invoices.
• Product A has issued one third of the total materials issued per
production run.
• Product A has issued one half of the planning per production
run of that required by Product B.
• Product B requires twice as many machine set-ups as product A.
• The products have the same number of quality control inspections.
If the company produces 50 000 each of products A and B:
(i) Complete TABLE 2 to determine the cost driver unit costings in
column 5 for the activities of column 1. Show also the product
quantity splits in column 4 of each activity for product A and B
(e.g. quantity of cost driver Activity Centre 1 is shown as split
100 000 product A and 400 000 product B).
(ii) Determine the overhead activity cost allocations to products A
and B (using the activity proportions calculated in column 4) by
completing TABLE 3.
(iii) Determine the total overhead allocations to products A and B.
(iv) Find the per unit product overhead cost allocations for each
product.
Activity involved
Allocated Cost
Activity Cost
Quantity of Cost
Cost Driver
to Produce Product
of Activity
Driver
Drivers
Unit cost/rate
£
per Cost
Driver £
Activity Centre 1
750 000
Machine Use
500 000
Machining
hours
(100 000 prod A
400 000 prod B)
Activity Centre 2
500 000
Machine Use
250 000
Machining
hours
Product Assembly
400 000
Direct labour hours
100 000
Materials
Procurement
Activities
Product Materials
600 000
Purchase Orders
5000
Purchase
Product Material
240 000
Number of Invoices
3000
Reception/Storage
or Material Delivery
Notes
Materials
225 000
Number of
1500
Issued/Production Run
Production runs
Support Activities
Production Run Planning
150 000
Number of
1500
Production runs
Machine Setting
30 000
Setting up/tooling
750
Up/Tooling
labour hours
Statistical Quality
10 000
Sample
400
Control
inspection and
Test Cost
Total
Activity
Product A
Product B
£
£
Activity Centre 1
1.5
×
100 000
150 000
1.5
×
400 000
600 000
Machining
Activity Centre 2
Machining
Product Assembly
Materials
Procurement
Activities
Product Materials
Purchase
Product Material
Reception/Storage
Materials
Issued/Production Run
Support Activities
Production Run Planning
Machine Setting
.
b) TABLE 2 shows the cost drivers, the quantity and unit cost of the.docx
1. b) TABLE 2 shows the cost drivers, the quantity and unit cost
of the
cost driver, and total activity cost.
For two products A and B it is found that:
• The direct labour hours for products A and B are the same.
• It takes approximately four times as many machining hours in
both cost centres to produce product B as product A.
• Product A requires one quarter of the materials purchased for
B.
• Product A requires one third of the total Delivery
notes/invoices.
• Product A has issued one third of the total materials issued per
production run.
• Product A has issued one half of the planning per production
run of that required by Product B.
• Product B requires twice as many machine set-ups as product
A.
• The products have the same number of quality control
inspections.
If the company produces 50 000 each of products A and B:
2. (i) Complete TABLE 2 to determine the cost driver unit costings
in
column 5 for the activities of column 1. Show also the product
quantity splits in column 4 of each activity for product A and B
(e.g. quantity of cost driver Activity Centre 1 is shown as split
100 000 product A and 400 000 product B).
(ii) Determine the overhead activity cost allocations to products
A
and B (using the activity proportions calculated in column 4) by
completing TABLE 3.
(iii) Determine the total overhead allocations to products A and
B.
(iv) Find the per unit product overhead cost allocations for each
product.
Activity involved
Allocated Cost
Activity Cost
Quantity of Cost
Cost Driver
3. to Produce Product
of Activity
Driver
Drivers
Unit cost/rate
£
per Cost
Driver £
Activity Centre 1
750 000
Machine Use
500 000
Machining
hours
(100 000 prod A
400 000 prod B)
4. Activity Centre 2
500 000
Machine Use
250 000
Machining
hours
Product Assembly
400 000
Direct labour hours
100 000
Materials