
Recommended
More Related Content
Viewers also liked
Similar to Respiration and the Human Transport System Homework
Similar to Respiration and the Human Transport System Homework (20)
More from Mrs Parker
More from Mrs Parker (17)
Recently uploaded
Recently uploaded (20)
Respiration and the Human Transport System Homework
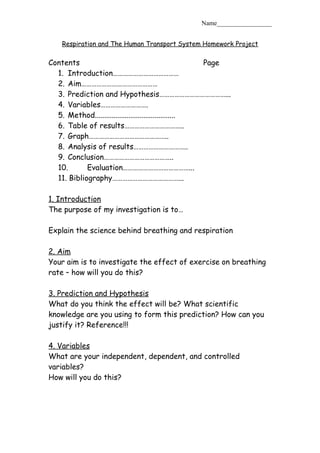
- 1. Name_________________ Respiration and The Human Transport System Homework Project Contents Page 1. Introduction………………………………… 2. Aim……………………………………… 3. Prediction and Hypothesis…………………………………... 4. Variables………………………. 5. Method........................................... 6. Table of results…………………………….. 7. Graph……………………………………….. 8. Analysis of results………………………….. 9. Conclusion………………………………….. 10. Evaluation…………………………………... 11. Bibliography…………………………………... 1. Introduction The purpose of my investigation is to… Explain the science behind breathing and respiration 2. Aim Your aim is to investigate the effect of exercise on breathing rate – how will you do this? 3. Prediction and Hypothesis What do you think the effect will be? What scientific knowledge are you using to form this prediction? How can you justify it? Reference!!! 4. Variables What are your independent, dependent, and controlled variables? How will you do this?
- 2. Name_________________ 5. Method 6. Table of results • All results are listed • Units are present • The degree of precision readings were taken at is noted • Outliers are identified • The mean is calculated • The range is calculated 7. Graph Axis are labelled including units A line of best fit is included Range bars are shown Key given for secondary and primary data Title 8. Analysis of results Statement of trend seen in graph My graph is a _______ correlation, as... (gradient) Comment on scatter to the line of best fit (accuracy) Comment on size of error bars (reliability) Comment on similarities/differences to secondary (other groups) data (repeatability) 9. Conclusion From my investigation I can conclude..... Use examples from your results My conclusion is limited by....
- 3. Name_________________ 10. Evaluation From my graph it can be seen that ___ was the most reliable as the range is only _____. The least reliable test was________. The difference in reliability can be accounted for by… Anomalous results were identified in test ____. These could have been caused by… (Or) No anomalous results were identified in test. This is because... When I recognised an outlier I...... To improve my investigation, hence giving a more reliable conclusion I would… Problems I had (method/technique and equipment) Solutions if I were to this experiment again This would be improvement because.... (accuracy? Precision? Repeatability?) 11. Bibliography Author, A., (Date). Book / Website title. Publisher / URL.