Environmental Kuznets Curve
Econ 328
Dr. Itziar Lazkano
Sustainable Development
Definition
Definition
Development that meets the needs of the present without
compromising the ability of future generations to meet their
own needs
Source: The World Commission on Environment and Development.
The Brundtland Commission report “Our Common Future,” 1987.
Sustainable Development
Challenges
There are four causes of unsustainable economic growth:
1. Natural capital stock (environment and resources)
2. Population growth
3. Poverty and inequality
4. Institutions
Sustainable Development
Definition
What does sustainable development mean in economic terms?
I Continuous economic progress
I Natural capital stock should not decrease over time
Economic growth and environmental quality
The trade-off
Pessimistic view:
I There is a trade-off between economic growth and
environmental quality
I The current generation must stop growing to ensure the well
being of future generations
Evidence
I There are serious environmental dangers associated with
economic growth
I Depletion of exhaustible energy resources
I Such as coal and oil
I Deterioration of the environment
I Through such as CO2 emissions and other greenhouse gases
I Many examples illustrate the negative effect of economic
growth on environmental quality
I Pollution in Mexico city, Tehran, London during
industrialization
Environmental quality could improve with wealth
Some people, however, argue that environmental degradation is
only temporary
Environmental Kuznets Curve
Environmental quality improves with wealth
Recent research finds EKC for certain pollutants:
I Local pollutants (SO2): evidence
I As we become richer, we take care of our local environment
I Global pollutants (CO2): no evidence
I Taking care of our local environment, does not guarantee
better global environment
Technological progress
Optimistic view
The largest criticisms of the Club of Rome is that technological
progress was not taken into account
I New growth theories can reconcile economic growth with
environmental constraints
I New growth theory is based on innovations and directed
technical change
Environmental Kuznets Curve
1. What drives sustained growth in income per capita?
2. Is sustained economic growth possible without environmental
degradation?
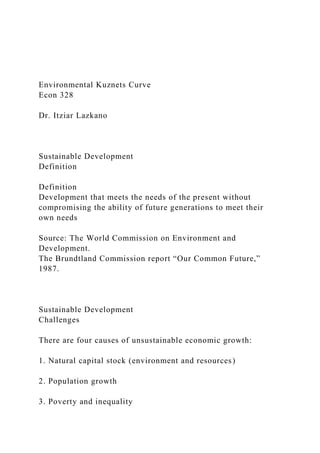
Sulfur dioxide
1. Is there an Environmental Kuznets Curve for sulfur dioxide in
the US? Why? Why not?
Figure 4 and 5, SOX may have linear negative or “inverse-N” relationship with per
capita GDP and logarithmic per capita GDP.
Figure 2-5: Scatter plots of CO2, SOX and GDP
Combined with the qualitative analysis above, this paper uses Selden and Song's (1994)
cubic logarithmic polynomial form to establish the following model:
𝑙𝑛𝑌 = 𝛽0 + 𝛽1𝑙𝑛𝑋 + 𝛽2𝑙𝑛
2𝑋 + 𝛽3𝑙𝑛
3𝑋 + 𝜀
Y is the amount of yearly air pollution (CO2 and SOX), X is per capita GDP, 𝜀 is error
term. The regression of CO2 is divided into t
1. Environmental Kuznets Curve
Econ 328
Dr. Itziar Lazkano
Sustainable Development
Definition
Definition
Development that meets the needs of the present without
compromising the ability of future generations to meet their
own needs
Source: The World Commission on Environment and
Development.
The Brundtland Commission report “Our Common Future,”
1987.
Sustainable Development
Challenges
There are four causes of unsustainable economic growth:
1. Natural capital stock (environment and resources)
2. Population growth
3. Poverty and inequality
2. 4. Institutions
Sustainable Development
Definition
What does sustainable development mean in economic terms?
I Continuous economic progress
I Natural capital stock should not decrease over time
Economic growth and environmental quality
The trade-off
Pessimistic view:
I There is a trade-off between economic growth and
environmental quality
I The current generation must stop growing to ensure the well
being of future generations
Evidence
I There are serious environmental dangers associated with
economic growth
I Depletion of exhaustible energy resources
I Such as coal and oil
3. I Deterioration of the environment
I Through such as CO2 emissions and other greenhouse gases
I Many examples illustrate the negative effect of economic
growth on environmental quality
I Pollution in Mexico city, Tehran, London during
industrialization
Environmental quality could improve with wealth
Some people, however, argue that environmental degradation is
only temporary
Environmental Kuznets Curve
Environmental quality improves with wealth
Recent research finds EKC for certain pollutants:
I Local pollutants (SO2): evidence
I As we become richer, we take care of our local environment
I Global pollutants (CO2): no evidence
I Taking care of our local environment, does not guarantee
better global environment
Technological progress
Optimistic view
4. The largest criticisms of the Club of Rome is that technological
progress was not taken into account
I New growth theories can reconcile economic growth with
environmental constraints
I New growth theory is based on innovations and directed
technical change
Environmental Kuznets Curve
1. What drives sustained growth in income per capita?
2. Is sustained economic growth possible without environmental
degradation?
Sulfur dioxide
1. Is there an Environmental Kuznets Curve for sulfur dioxide
in
the US? Why? Why not?
Figure 4 and 5, SOX may have linear negative or “inverse-N”
relationship with per
capita GDP and logarithmic per capita GDP.
5. Figure 2-5: Scatter plots of CO2, SOX and GDP
Combined with the qualitative analysis above, this paper uses
Selden and Song's (1994)
cubic logarithmic polynomial form to establish the following
model:
��� = �0 + �1��� + �2��
2� + �3��
3� + �
Y is the amount of yearly air pollution (CO2 and SOX), X is per
capita GDP, � is error
term. The regression of CO2 is divided into two periods, the
first period is from 1970
to 1983, per capita GDP ranges from 5246 to 15526 dollars, and
the second period is
from 1984 to 2014, per capita GDP ranges from 17093 to 54484
dollars.
When �1 = �2 = �3 = 0 , environment and economy do not
have significant
relationship. When �1 ≠ 0, �2 = �3 = 0 , only the linear term
influences the
dependent variable, so environment and economy have linear
6. relationship. When �1 >
0, �2 < 0, �3 = 0, the model first is an incremental convex
function until the turning
4000
4500
5000
5500
6000
0 20000 40000 60000
C
O
2
GDP/capita
8.3
8.4
8.5
8.6
8.7
8.5 9 9.5 10 10.5 11 11.5
8. 9.5
10
10.5
10 10.2 10.4 10.6 10.8 11
ln
(S
O
X
)
ln(GDP/capita)
Figure: Scatterplot GDP per capita and sulfur emissions in the
US from
1990 to 2014.
Carbon dioxide
1. Is there an Environmental Kuznets Curve for carbon dioxide
in
the US? Why? Why not?
Figure 4 and 5, SOX may have linear negative or “inverse-N”
relationship with per
capita GDP and logarithmic per capita GDP.
9. Figure 2-5: Scatter plots of CO2, SOX and GDP
Combined with the qualitative analysis above, this paper uses
Selden and Song's (1994)
cubic logarithmic polynomial form to establish the following
model:
��� = �0 + �1��� + �2��
2� + �3��
3� + �
Y is the amount of yearly air pollution (CO2 and SOX), X is per
capita GDP, � is error
term. The regression of CO2 is divided into two periods, the
first period is from 1970
to 1983, per capita GDP ranges from 5246 to 15526 dollars, and
the second period is
from 1984 to 2014, per capita GDP ranges from 17093 to 54484
dollars.
When �1 = �2 = �3 = 0 , environment and economy do not
have significant
relationship. When �1 ≠ 0, �2 = �3 = 0 , only the linear term
10. influences the
dependent variable, so environment and economy have linear
relationship. When �1 >
0, �2 < 0, �3 = 0, the model first is an incremental convex
function until the turning
4000
4500
5000
5500
6000
0 20000 40000 60000
C
O
2
GDP/capita
8.3
8.4
8.5
8.6
8.7
11. 8.5 9 9.5 10 10.5 11 11.5
ln
(C
O
2
)
ln(GDP/capita)
0
5000
10000
15000
20000
25000
20000 30000 40000 50000 60000
S
O
X
GDP/capita
8
12. 8.5
9
9.5
10
10.5
10 10.2 10.4 10.6 10.8 11
ln
(S
O
X
)
ln(GDP/capita)
Figure: Scatterplot GDP per capita and carbon emissions in the
US from
1990 to 2014.
Definition