
Recommended
Recommended
More Related Content
Similar to Concrete Quality Tests
Similar to Concrete Quality Tests (20)
More from Khalid Abdel Naser Abdel Rahim
More from Khalid Abdel Naser Abdel Rahim (12)
Recently uploaded
Recently uploaded (20)
Concrete Quality Tests
- 1. 22 (22-40) Revista Tecnología y Ciencia DOI: https://doi.org/10.33414/rtyc.36.22-40.2019 - ISSN 1666-6933 Universidad Tecnológica Nacional Octubre 2019 / Año 17- Nº 36 Evaluating Concrete Quality using Nondestructive In-situ Testing Methods Evaluación de la calidad del concreto utilizando métodos de prueba in situ no destructivos Presentación: 03/04/2019 Aprobación: 09/09/2019 Khalid Abdel Naser Abdel Rahim Department of Civil Engineering, Faculty of Science and Technology, University of Coimbra, Portugal khalid.ar@outlook.com ABSTRACT This manuscript investigate the quality of concrete using non-destructive in-situ testing. The in-situ testing is a process by which different test are carried out such as rebound ham- mer, ultrasonic pulse veloc-ity, initial surface absorption test and fig air, to determine the in-situ strength, durability and deterioration, air permeability, concrete quality control and performance. Additionally, the quality of concrete was researched using test methods with experimental results. Moreover, this research has found that (1) the increase in w/c ra-tio leads to a decrease in compressive strength and ultrasonic pulse velocity. Thus, lower w/c ratio gives a bet-ter concrete strength in terms of quality, (2) the quicker the ultrasonic pulse travels through concrete indicates that the concrete is denser, therefore, better quality, (3) the lower initial surface absorption value indicates a better concrete with respect to porosity and (4) the w/c ratio plays an important role in the strength and per-meability of concrete. Keywords: Concrete quality, rebound hammer test, ultrasonic pulse velocity, initial surface ab- sorption test, fig air test. RESUMEN Este manuscrito investiga aspectos de la calidad del hormigón utilizando ensayos in situ no des-tructivos. Los ensayos in situ aplican un proceso mediante el cual se realizan dife- rentes pruebas, como martillo de rebote, velocidad de pulso ultrasónico, absorción inicial superficial de agua y permeabilidad al aire de Figg, para determinar la resistencia, durabi- lidad y deterioro in situ, permeabilidad del aire. Además, esta investiga-ción ha comproba- do que (1) el aumento en la relación w/c conduce a una disminución en la resistencia a la compresión y la velocidad del pulso ultrasónico. Por lo tanto, una relación w /c más baja
- 2. 23 (22-40) Revista Tecnología y Ciencia DOI: https://doi.org/10.33414/rtyc.36.22-40.2019 - ISSN 1666-6933 Universidad Tecnológica Nacional Octubre 2019 / Año 17- Nº 36 Evaluating Concrete Quality using Nondestructive In-situ Testing Methods Khalid Abdel Naser Abdel Rahim, et al. proporciona una me-jor resistencia del hormigón en términos de calidad, (2) cuanto más rápido viaja el pulso ultrasónico indica que el hormigón es más denso, por lo tanto, mejor calidad, (3) la absorción inicial superficial de agua cuanto más más bajo su valor indica un mejor hormigón con respecto a la porosidad y (4) en definitiva la relación w/c desempeña un papel importante en la resistencia y permeabilidad del hormigón. Palabras clave: calidad del concreto, prueba de martillo de rebote, velocidad de pulso ultrasóni- ca, prueba de absorción de superficie inicial, prueba de aire de higo. INTRODUCTION Scope of work The BS 1881: Part 201: 1986 Guide to the use of non-destructive methods of test for har- dened con-crete is set to consider the methods of in-situ testing in terms of advantages, limitations and principal ap-plication. This research is a continuation of three ex-perimen- tal investigations (1) Experimental study on the mix design and fresh properties of concre- te, (2) Concrete Specification and Methods of Quality Testing and (3) Experimental Study: Determination of Concrete Reinforcement Conditions ; which were carried out by (Khalid Abdel Naser, 2019). The in-situ testing in the structures laboratory consisted of four tests re- bound hammer, ultrasonic pulse velocity, initial surface velocity test (ISAT) and figg air. The testing has been carried out on four concrete speci-mens with w/c ratios of 0.4, 0.45, 0.6 and 0.75. The dimensions of the squared non-reinforced concrete specimens were 300x300mm with a height of 300mm. In addition, the cement type which was used in the concrete speci- mens was Portland cement. In the first section of this report, the procedures of each test carried out in the lab will be presented. Moreover, the advantages and limitations of each in-situ test will be discussed. The results obtained in the lab for each test will be presented, along with a brief discussion on what they mean and indicate. Fur-thermore, the results will be compared in terms of concrete quality and strength. Finally, the affected quality by concrete strength and rela- tionships be-tween strength test and permeation tests will be re-ported. Aims of the paper The main objectives of the manuscript are: -Achieve a better understanding of the in-situ testing process. -Obtain a greater in-depth knowledge of the in-situ testing procedures and tests carried out in structures laboratory. -Be able to carry out rebound hammer, ultra-sonic pulse velocity, initial surface absorp- tion and fig air tests. -Become familiar with the quality and strength of concrete using such tests. -Be able to define advantages and limitations of each in-situ test. -Finding out how does strength of concrete affect quality. -Distinguishing the relationships between the strength tests and permeation tests.
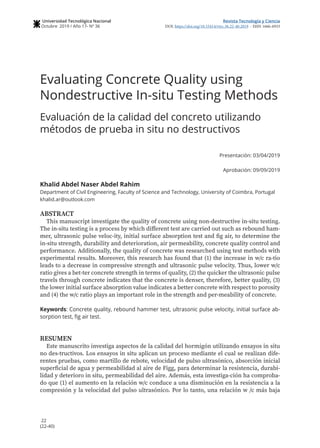
- 3. 24 (22-40) Revista Tecnología y Ciencia DOI: https://doi.org/10.33414/rtyc.36.22-40.2019 - ISSN 1666-6933 Universidad Tecnológica Nacional Octubre 2019 / Año 17- Nº 36 Evaluating Concrete Quality using Nondestructive In-situ Testing Methods Khalid Abdel Naser Abdel Rahim, et al. METHODS AND PROCEDURES OF THE TESTS CARRIED OUT Rebound Hammer Test The push of plunger against the concrete surface causes the release of compression spring and impact of plunger. As demonstrated in figure 1, the plunger responds in the other posi- tion of spring as pushed against concrete surface which activates the hammer mass to im- pact against the concrete. As the mass of spring controller rebounds, the rider on guide rod moves with it. The rider can then be stopped by pressing the locking button and the rebound can then be recorded. The higher the rebound number, the better the compressive strength according to Bungey et al. (2006). Furthermore, the test was carried out in accordance to BS 1881: Part 202 – Determination of Rebound Number. Firstly, the hammer has been at-tached firmly in a perpendicular position to a smooth surface on the concrete and the pressure was gradu-ally increased until the plunger impact. After impact of the plunger the locking button was pressed and the rebound value was recorded. The rebound value was then compared with a hammer rebound vs. compressive strength scale graph (corre-lation graph) which was on the hammer machine to obtain the compressive strength of a certain rebound value. The rebound number has been taken at 9 loca-tions for two surfaces on the concrete cube and the average of each surface has been calculated. Figure 1. Shows the pressure applied on the concrete by the re-bound hammer. Ultrasonic Pulse Velocity Test The ultrasonic pulse velocity is set to find the inter-nal of concrete and velocity of wa- ves. It works by measuring the time taken for a pulse to travel through concrete. There are three ways of measuring the ultrasonic pulse velocity by direct method, semi-direct and indirect. As both the transducers and re-ceiver in linked with concrete surfaces for a direct
- 4. 25 (22-40) Revista Tecnología y Ciencia DOI: https://doi.org/10.33414/rtyc.36.22-40.2019 - ISSN 1666-6933 Universidad Tecnológica Nacional Octubre 2019 / Año 17- Nº 36 Evaluating Concrete Quality using Nondestructive In-situ Testing Methods Khalid Abdel Naser Abdel Rahim, et al. measurement, the transducer starts to send ultrasonic pulses through concrete. The pulse travels through concrete to the receiver on the other face of con-crete. Once the pulse is received by receiver, the time taken for pulse to travel from first face to the oppo-site face is measured. The depth of concrete can then be divided by time to obtain the ultrasonic pulse ve-locity. The test was carried out in accordance to BS 1881: Part 203 – Recommendations for measurement of ultrasonic pulses in concrete. First of all a good amount of gel has been applied to the transducers surfaces. After that the transducers was connected at each end of the cylindrical steel specimen and the SET REF was adjusted at 26.2 seconds. Again an amount of gel was applied on the transducer and re-ceiver surfaces. Then the transducer and receiver were positioned parallel to each other on opposite faces of the concrete surfa- ce. Afterwards the pulse which travelled through the concrete cube was rec-orded as shown in figure 2. The following procedure has been carried out for nine different locations on each concrete cube and the average has been calcu-lated with reference to the concrete society (2000). Figure 2. Shows the pundit machine of the ultrasonic pulse ve-locity test. Initial Surface Absorption Test (ISAT) The initial surface absorption test is used to deter-mine the surface absorption of external part of con-crete, porosity and determine cracks. Figure 3 illus-trates the apparatus used to carry out the initial sur-face absorption test. The test was carried out in ac-cordance to BS 1881: Part 208 – Recommendations for the determination of the initial surface absorption of concrete. Initially, the adjustment of the apparatus has been ensured. Then rubber seal was gently lubricated to the cap of the test apparatus and it was located cen-trally on side surface of the test cube. After that it was fastened tightly in position to make sure that the seal is water tight.
- 5. 26 (22-40) Revista Tecnología y Ciencia DOI: https://doi.org/10.33414/rtyc.36.22-40.2019 - ISSN 1666-6933 Universidad Tecnológica Nacional Octubre 2019 / Año 17- Nº 36 Evaluating Concrete Quality using Nondestructive In-situ Testing Methods Khalid Abdel Naser Abdel Rahim, et al. The next step was to position the tripod stand on top of the cube, closing reservoir tape and filling reser-voir with tape water. Afterwards the tape was opened and the flow of water through rubber tubing was relieved by pinching and raising reservoir. Then once the water reached the concrete surface the stopwatch was started. After 9 minutes the tape was closed, the first reading was taken and the distance water surface travelled along the capillary tube in 1 minute and 2 minutes was recorded in accordance to (Judith, 2010). Figure 3. Shows the apparatus used to carry out the Initial sur-face absorption test. Figg Air Test The Figg air test is commonly used to obtain perme-ability of concrete surface (Figure 4). This is done by measuring the time taken for air pressure inside a vacuum hole in concre- te to increase by a certain pressure, for example, measurement of the time tak-en for the pressure to increase from -60Kpa to -55Kpa. The time measured indicates air permeability of concrete. A testing hole with a diameter of 10mm approxi-mately and a depth of 40mm was dri- lled inside the concrete cube. Then using a rubber seal, the hole was covered. After that a hypodermic needle was insert-ed through the rubber seal inside the hole. After-wards, the air pressure inside the hole has been re-duced to -55Kpa using a hand-operated vacuum pumper with a steady and gentle hand stokes. Sub-sequently, the time taken for pressure to increase from -55Kpa to -50Kpa has been measured using a stop watch and recorded. The following procedure was carried out for two hole in the concrete speci-men Bungey et al. (2006).
- 6. 27 (22-40) Revista Tecnología y Ciencia DOI: https://doi.org/10.33414/rtyc.36.22-40.2019 - ISSN 1666-6933 Universidad Tecnológica Nacional Octubre 2019 / Año 17- Nº 36 Evaluating Concrete Quality using Nondestructive In-situ Testing Methods Khalid Abdel Naser Abdel Rahim, et al. Figure 4. Shows the procedures used for the fig air test. ADVANTAGES AND LIMITATIONS OF EACH IN-SITU TEST Rebound Hammer The main usage of rebound hammer test is to meas-ure the surface region hardness of concrete. The re-bound number is directed by the stiffness and strength of concrete. This test have many ad-vantages, such as, it is simple method of testing, quick in operation and cost effective. On the other hand, problems such as variability can occur, influ-enced by aggregate size, concrete type, moisture lev-els of specimen and surface quality. Moreover, a true estimation of concrete strength can not be obtained using this test. Finally, the vertica- lity position of the hammer can have an effect on the rebound number, by giving results will errors and not close to reality as stated by Neville (1996) and BS 1881: Part 124. Ultrasonic Pulse Velocity The ultrasonic pulse velocity test is related to con-crete density and is set to determine internal quality of concrete element. This may include measuring the concrete uniformity, dynamic physical properties, strength of in-situ concrete elements, transformation in pro- perties with time and presence of cracks or voids. The advantages of this test are its reliabi- lity as a method of testing internal part of the concrete in a non-destructive way. Moreover, it is considered to be easy in terms of operating quick and reasonably cheap. The limitations that can influence the meas-urement of pulse velocity are the size and shape of specimen, content of moisture, voids and cracks. Additionally, the huge number of variables can result in boundary predictions of concrete strength and af-fects the relationship between pulse velocity and strength. Finally, this test requires a good surface contact between concrete surface, transmitter and receiver with respect to BS 1881: Part 203. Initial Surface Absorption Test (ISAT) Initial surface absorption test is generally used to measure the surface absorption of the
- 7. 28 (22-40) Revista Tecnología y Ciencia DOI: https://doi.org/10.33414/rtyc.36.22-40.2019 - ISSN 1666-6933 Universidad Tecnológica Nacional Octubre 2019 / Año 17- Nº 36 Evaluating Concrete Quality using Nondestructive In-situ Testing Methods Khalid Abdel Naser Abdel Rahim, et al. external part of concrete and flow of water rate in concrete spec-imen. It is an ideal test to measure the porosity of concrete and to detect cracks and voids. The ad-vantages of ISAT are that it is reasonable in cost, simple in operation and quick test in terms of proce-dures. Alternatively, the result can be affected by the moisture content of concrete in accordance to Neville (1996). Figg Air Test This test is mostly used to find the relationships be-tween air pressure and time, to obtain the permeabil-ity of concrete surface and mass and to give predic-tions on concrete durabi- lity. Moreover, it is used to provide indication of the air permeability in the con-crete. The advantages of fig air test are that it is moderate in cost, simple in operation and quick test in terms of procedures. On the other hand, the result can be influenced by the moisture con- tent of con-crete with reference to Neville (1996). RESULTS FOR EACH CONCRETE SPECIMEN Rebound hammer Tables 1 to 4 shows the rebound hammer test results obtained in the lab for concrete spe- cimens of 0.4, 0.45, 0.60 and 0.75 w/c ratios. Face 1 Face 2 Rebound Number Compressive Strength [N/mm²] (α = 90°) Rebound Number Compressive Strength [N/mm²] (α = 90°) 54 62 49 50 55 64 50 53 51 55 51 55 49 50 47 46 52 57 52 57 55 64 50 53 54 62 50 53 51 55 53 59 55 64 51 55 Average 59.2 Average 53.4 Therefore, the Average Compressive Strength (N/mm2 ) = [(Compressive strength at face 1) + (Compressive strength at face 2)] / 2 = (59.2 + 53.4) / 2 = 56 N/ mm2 Table 1. Results of rebound hammer test for 0.40 w/c ratio.
- 8. 29 (22-40) Revista Tecnología y Ciencia DOI: https://doi.org/10.33414/rtyc.36.22-40.2019 - ISSN 1666-6933 Universidad Tecnológica Nacional Octubre 2019 / Año 17- Nº 36 Evaluating Concrete Quality using Nondestructive In-situ Testing Methods Khalid Abdel Naser Abdel Rahim, et al. Face 1 Face 2 Rebound Num- ber Compressive Strength [N/mm²] (α = 90°) Rebound Number Compressive Strength [N/mm²] (α = 90°) 44 52 48 48 51 54 48 48 49 51 48 48 51 54 48 48 55 64 50 52 50 52 44 40 46 44 48 48 50 52 49 49 54 62 48 48 Average 53.9 Average 47.7 Therefore, the Average Compressive Strength (N/mm2 ) = [(Compressive strength at face 1) + (Compressive strength at face 2)] / 2 = (53.9 + 47.7) / 2 = 51 N/mm2 Table 2. Results of rebound hammer test for 0.45 w/c ratio. Face 1 Face 2 Rebound Number Compressive Strength [N/mm²] (α = 90°) Rebound Number Compressive Strength [N/mm²] (α = 90°) 44 40 42 34 46 50 44 40 40 - 46 48 45 42 42 34 46 48 46 48 48 50 45 42 49 52 42 34 45 42 43 35 44 40 42 34 Average 45.5 Average 38.8 Therefore, the Average Compressive Strength (N/mm2 ) = [(Compressive strength at face 1) + (Compressive strength at face 2)] / 2 = (45.5 + 38.8) / 2 = 42 N/mm2 Table 3. Results of rebound hammer test for 0.60 w/c ratio.
- 9. 30 (22-40) Revista Tecnología y Ciencia DOI: https://doi.org/10.33414/rtyc.36.22-40.2019 - ISSN 1666-6933 Universidad Tecnológica Nacional Octubre 2019 / Año 17- Nº 36 Evaluating Concrete Quality using Nondestructive In-situ Testing Methods Khalid Abdel Naser Abdel Rahim, et al. Face 1 Face 2 Rebound Num- ber Compressive Strength [N/mm²] (α = 90°) Rebound Num- ber Compressive Strength [N/mm²] (α = 90°) 37 26 36 25 42 36 39 30 40 32 40 32 39 30 36 25 40 32 38 28 40 32 40 32 38 28 38 28 41 33 39 30 44 40 48 48 Average 32.1 Average 30.9 Therefore, the Average Compressive Strength (N/mm2 ) = [(Compressive strength at face 1) + (Compressive strength at face 2)] / 2 = (32.1 + 30.9) / 2 = 32 N/ mm2 Table 4. Results of rebound hammer test for 0.75 w/c ratio. Tables 1 to 4 show the results obtained in structures lab for rebound hammer test. The results demon-strate rebound number against compressive strength for w/c ratios concrete specimens of 0.40, 0.45, 0.60 and 0.75. As shown in table 1 for different regions of 0.4 w/c ratio concrete cube, the values was slight-ly close in terms of rebound number value. Thus, the compressive strength at these regions was obviously in the same range. The average compressive strength for face 1 and 2 was 59.2 and 53.4 N/mm2 respec-tively. Therefore, the average compressive strength for this concrete cube was 56 N/mm2. According to table 5, the value of 56 N/mm2 demonstrates a very good concrete quality. For 0.45 w/c ratio cube as shown in table 2 the average compressive strength was 51 N/mm2. Hence, this has a very good concrete quality in accordance to table 5. The results for con-crete cube with 0.60 w/c ratio as can be seen in table 3 had a value of 42 N/mm2 for the average compres-sive stren- gth. Moreover, it is still consider being very good in terms of concrete quality as stated in table 5. Finally, the average compressive strength for 0.75 w/c ratio was 32 N/mm2 as show in table 4. In ac-cordance to table 5 this expresses the concrete as to be of good quality. Generally speaking, the 0.4 w/c ratio concrete cube showed the highest average compres- sive strength among the other concrete specimens of different w/c ratio with a 56 N/mm². According to the above re-sults (tables 1-4) as the w/c ratio increases the com-pressive stren- gth decreases. As shown in graph 1 this indicates that the lower w/c ratio the better concrete is in terms of stiffness and strength.
- 10. 31 (22-40) Revista Tecnología y Ciencia DOI: https://doi.org/10.33414/rtyc.36.22-40.2019 - ISSN 1666-6933 Universidad Tecnológica Nacional Octubre 2019 / Año 17- Nº 36 Evaluating Concrete Quality using Nondestructive In-situ Testing Methods Khalid Abdel Naser Abdel Rahim, et al. Graph 1. The graph shows the w/c ratio vs. average compres-sive strength. Average Rebound Number Quality of Concrete Above 40 Very good Between 30 and 40 Good Between 20 and 30 Fair Less than 20 Poor and / or delaminated Table 5. The table shows relationship between average com-pressive strength and the strength of concrete by The Concrete Society (2000). UPV – Ultrasonic pulse velocity Tables 6 shows the ultrasonic pulse velocity test results obtained in the lab for concrete specimens of 0.4, 0.45, 0.60 and 0.75 w/c ratios. While equation 1 below was used to calculate the velocity for each test: Velocity (m/s) = Depth of concrete (m) / Average UPV (s) (1)
- 11. 32 (22-40) Revista Tecnología y Ciencia DOI: https://doi.org/10.33414/rtyc.36.22-40.2019 - ISSN 1666-6933 Universidad Tecnológica Nacional Octubre 2019 / Año 17- Nº 36 Evaluating Concrete Quality using Nondestructive In-situ Testing Methods Khalid Abdel Naser Abdel Rahim, et al. No. 0.40 w/c 0.45 w/c 0.60 w/c 0.75 w/c 1 83.5 75.8 82.6 74.5 2 81.3 73.6 85.0 75.7 3 83.3 70.4 85.0 76.3 4 84.4 69.9 80.3 73.6 5 82.2 68.8 79.4 71.9 6 84.8 69.3 82.5 72.4 7 79.4 69.2 83.3 76.3 8 80.7 69.1 84.3 73.8 9 80.4 70.0 88.4 73.6 Average 70.7 74.2 82.2 83.4 Velocity 4243m/s 4043m/s 3650m/s 3597m/s Table 6. Results of ultrasonic pulse velocity test for 0.40w/c, 0.45w/c, 0.60w/c and 0.75w/c ratios. Table 6 illustrate the results obtained in structures lab for ultrasonic pulse velocity with w/c ratios concrete specimens of 0.40, 0.45, 0.60 and 0.75. In table 6 the ultrasonic pulse velocity for 0.4 w/c ratio was 4.24 km/s. In respect with table 7 the value of 4.24 km/s shows a good quality of concrete. For 0.45 w/c ratio, the velocity was 4.04 km/s. Hence, the velocity of 4.04 is still considered to be of a good concrete in terms of quality in accordance to table 7. Moreover, the result for 0.60 w/c ratio with a velocity of 3.65 km/s which is considered to be fair in concrete quali-ty as referred in table 7. The results for 0.75 w/c ratio had a velocity of 3.6 km/s, which indicates a fair concrete quality. Generally, the 0.75 w/c ratio con-crete cube showed the lowest ultrasonic pulse veloci-ty among the other concrete specimens of different w/c ratio with a 3.6 km/s. It is known that the quick-er the ultrasonic pulse travels through concrete, the denser it is and with less pores, therefore better qual-ity and strength. According to the above results as the w/c ratio increases the concrete quality and strength decreases. With respect to graph 2 this indi-cates that the lower w/c ratio, the better concrete is in terms of quality and strength. Ultrasonic Pulse Velocity (km/s) Quality of concrete Above 4.57 Excellent Between 4.57 and 3.66 Good Between 3.66 and 3.05 Fair Between 3.05 and 2.13 Poor Below 2.13 Very poor Table 7. The table shows the relationship between ultrasonic pulse velocity and the quality of concrete.
- 12. 33 (22-40) Revista Tecnología y Ciencia DOI: https://doi.org/10.33414/rtyc.36.22-40.2019 - ISSN 1666-6933 Universidad Tecnológica Nacional Octubre 2019 / Año 17- Nº 36 Evaluating Concrete Quality using Nondestructive In-situ Testing Methods Khalid Abdel Naser Abdel Rahim, et al. Graph 2. The graph shows the velocity vs. w/c ratio. ISAT – Initial surface absorption test Tables 11 to 14 shows the initial surface absorption test results obtained in the lab for concrete speci-mens of 0.4, 0.45, 0.60 and 0.75 w/c ratios. Reading [mm] Time [min] Duration (sec) Distance (mm) 58 9 3.65 61.5 10 60 3.5 65.3 11 60 3.8 Table 8. Results of initial surface absorption test for 0.40 w/c ratio. *Calibration factor 3.605 **ISAT value 13.15 (ml/m2/s)
- 13. 34 (22-40) Revista Tecnología y Ciencia DOI: https://doi.org/10.33414/rtyc.36.22-40.2019 - ISSN 1666-6933 Universidad Tecnológica Nacional Octubre 2019 / Año 17- Nº 36 Evaluating Concrete Quality using Nondestructive In-situ Testing Methods Khalid Abdel Naser Abdel Rahim, et al. Reading [mm] Time [min] Duration (sec) Distance (mm) 3 9 12 15 10 60 12 27 11 60 12 Table 9. Results of initial surface absorption test for 0.45 w/c ratio. *Calibration factor 3.367 **ISAT value 40.4 (ml/m2/s) Reading [mm] Time [min] Duration (sec) Distance (mm) 2 9 5.9 8 10 60 6 13.8 11 60 5.8 Table 10. Results of initial surface absorption test for 0.60 w/c ratio. *Calibration factor 3.367 **ISAT value 19.87 (ml/m2/s) Reading [mm] Time [min] Duration (sec) Distance (mm) 57 9 23 80 10 60 23 Table 11. Results of initial surface absorption test for 0.75 w/c ratio. *Calibration factor 3.605 **ISAT value 82.9 (ml/m2/s) Tables 8 to 11 shows the results obtained in lab for initial surface absorption test with w/c ratios con-crete specimens of 0.40, 0.45, 0.60 and 0.75. As shown in table 8 for 0.4 w/c ratio the ISAT value was 13.15 ml/m2/s with a calibration factor of 3.605. Furthermore, this value seems to be reasonable. On the other hand, the 0.45 w/c ratio as presented in ta-ble 9 illustra- tes an ISAT value of 40.4 ml/m2/s and a calibration of 3.367. As the 0.60 w/c ratio in table 10 is presented with an ISAT of 19.87 ml/m2/s, this val-ue seems to be wrong because it does not match with the other ISAT values of different w/c ratio speci-mens. In addition to this, the ISAT value should be increasing instead of decreasing as the w/c ratio in-creases. Finally and never the least, the 0.75 w/c ra-tio concrete cube (Table 11) showed the highest ISAT value among the other concrete specimens of different w/c ratio with 82.9 ml/m2/s. It is believed that higher the ISAT value, the better the concrete is in terms of porosity. Apart from the ISAT value for 0.60 w/c ratio, the results show that as the w/c ratio increase
- 14. 35 (22-40) Revista Tecnología y Ciencia DOI: https://doi.org/10.33414/rtyc.36.22-40.2019 - ISSN 1666-6933 Universidad Tecnológica Nacional Octubre 2019 / Año 17- Nº 36 Evaluating Concrete Quality using Nondestructive In-situ Testing Methods Khalid Abdel Naser Abdel Rahim, et al. the ISAT value increase. According to graph 3 this indicates that the lower w/c ratio the bet- ter concrete is in terms of porosity. Graph 3. The graph shows the w/c ratio vs. ISAT value. Figg air test Tables 12 to 15 shows the Figg air test results ob-tained in the lab for concrete specimens of 0.4, 0.45, 0.60 and 0.75 w/c ratios. The air permeability has been calculated using equation 2 below. Air permeability = (Average time for hole 1 + Aver-age time for hole 2) / 2 (2) Hole No. Time Pressure 1 50 55 2.4 50 55 3.2 50 55 2.7 50 55 2.4 Average 2.7 2 50 55 2.8 50 55 3.3 50 55 3.8 50 55 4.0 50 55 3.5 Average 3.5 Table 12. Results of air test for 0.40 w/c ratio. * Air permeability = (2.7 + 3.5) / 2 = 3.1 seconds
- 15. 36 (22-40) Revista Tecnología y Ciencia DOI: https://doi.org/10.33414/rtyc.36.22-40.2019 - ISSN 1666-6933 Universidad Tecnológica Nacional Octubre 2019 / Año 17- Nº 36 Evaluating Concrete Quality using Nondestructive In-situ Testing Methods Khalid Abdel Naser Abdel Rahim, et al. Hole No. Pressure Time 1 60 55 18.3 60 55 23.1 60 55 22.6 60 55 22.1 Average 21.5 2 Not measures Table 13. Results of fig air test for 0.45 w/c ratio. * Air permeability = 21.5 seconds Hole No. Pressure Time 1 6560 3.12 6560 2.93 6560 2.90 6560 2.95 Average 3 2 6560 3.47 6560 4.66 6560 4.91 6560 4.52 Average 4.4 Table 14. Results of fig air test for 0.60 w/c ratio. * Air permeability = (3 + 4.4) / 2 = 3.7 seconds
- 16. 37 (22-40) Revista Tecnología y Ciencia DOI: https://doi.org/10.33414/rtyc.36.22-40.2019 - ISSN 1666-6933 Universidad Tecnológica Nacional Octubre 2019 / Año 17- Nº 36 Evaluating Concrete Quality using Nondestructive In-situ Testing Methods Khalid Abdel Naser Abdel Rahim, et al. Hole No. Pressure Time 1 5550 2.16 6560 2.15 6560 2.17 Average 2.2 2 6560 2.04 6560 2.32 6560 2.24 Average 2.2 Table 15. Results of fig air test for 0.75 w/c ratio. * Air permeability = (2.2 + 2.2) / 2 = 2.2 seconds Tables 12 to 15 shows the results obtained in lab for figg air test with w/c ratios concrete specimens of 0.40, 0.45, 0.60 and 0.75. As exposed in table 12 for 0.4 w/c ratio the air average permeability value was 3.1 seconds. Furthermore, the results for 0.45w/c ra-tio as presented in table 13, shows air permeability with 21.5 seconds. Table 14 illustrates an air perme-abili- ty of 3.7 seconds for a w/c ratio of 0.60. The re-sults for 0.75 w/c ratio as revealed in table 15 demonstrates air permeability with 2.2 seconds. It is known that if the air permeability value is less than 25 seconds, then the concrete is considered to be poor in terms of durability. Moreover, if the air permeability is less than 25 seconds then this shows that there were plenty of pores in the concrete lead-ing to quick diffusion of the air. Since the air perme-ability increases the durability increases, this in- di-cates that the figg air test results were absolutely wrong, illogical and not close to reality. 4.5 Comparing Results The results of all in-situ tests that were carried out has been summarized and shown in table 16. The re-sults of rebound hammer and ultrasonic pulse veloci-ty showed a uniform relationship between compres-sive strength, velocity and w/c ratio. This indicates that as the w/c ratio decrease, both the compressive strength and velocity increases, therefore better qual-ity of concrete in terms of strength. Alternatively, the increase in w/c ratio leads to a decrease in the re-bound number and an increase in ultrasonic pulse ve-locity. By referring to graph 4 which presents the re-lation between rebound hammer and ultrasonic pulse ve- locity, it shows that as the compressive strength increases, the ultrasonic pulse velocity in- creases. Therefore, the increase in ultrasonic velocity leads to denser concrete with a good quality and strength. On the other hand, the results for initial surface ab-sorption and fig air were incorrect and showed no re-lation with each other, or with other tests. Thus, they cannot be compared with other tests. Usually, the in-itial surface absorption test and fig air test can be compared with each other to find a relation between w/c ratio, air permeability and time. In theory, the re-lation should show an increase in permeability with a decrease in time, which leads to a good concrete in terms of porosity and durability. Consequently, as the w/c ratio decreases, the better the concrete is in terms of strength and permeability. Generally speak-ing, the concrete permeability is affected by moisture content of concrete.
- 17. 38 (22-40) Revista Tecnología y Ciencia DOI: https://doi.org/10.33414/rtyc.36.22-40.2019 - ISSN 1666-6933 Universidad Tecnológica Nacional Octubre 2019 / Año 17- Nº 36 Evaluating Concrete Quality using Nondestructive In-situ Testing Methods Khalid Abdel Naser Abdel Rahim, et al. Test w/c Ratio Test set to find 0.4 0.45 0.6 0.75 Rebound hammer (Strength in N/mm2 ) 56 51 42 32 Strength Ultrasonic pulse velocity (km/s) 4.24 4.04 3.65 3.6 Quality Initial surface absorption (ml/m2 /s) 13.15 40.4 19.87 82.9 Porosity Figg air (Seconds) 3.1 21.5 3.7 2.2 Air permeability Table 16. Results of all in-situ tests carried out. Graph 4. Rebound hammer vs. ultrasonic pulse velocity. CONCLUSION The in-situ testing lab was set to find the quality of concrete in terms of strength, porosity and permea-bility. It was found that the strength of concrete ef-fects quality depending on w/c ratio. So as the w/c ratio decreases both compressive strength and veloci-ty increases. Thus, higher strength means better qual-ity. The advantages of in-situ testing are that they are simple methods of testing, quick in ope- ration and cost effective. Conversely, each test has its own limi-tations. For example, the li- mitation of initial surface absorption and figg air tests are the moisture content of concrete. The results for rebound hammer test indicated a good concrete strength with values of 56, 51, 42 and 32 N/mm2 with respect to 0.40, 0.45, 0.60 and 0.75 w/c ratios. Additionally, the results for ultrasonic pulse velocity showed good concrete in terms of quality with value of 4.24, 4.04, 3.65 and 3.6 km/s. On the other hand, the results for initial surface ab-sorption
- 18. 39 (22-40) Revista Tecnología y Ciencia DOI: https://doi.org/10.33414/rtyc.36.22-40.2019 - ISSN 1666-6933 Universidad Tecnológica Nacional Octubre 2019 / Año 17- Nº 36 Evaluating Concrete Quality using Nondestructive In-situ Testing Methods Khalid Abdel Naser Abdel Rahim, et al. and figg air tests demonstrated no relation with each other or with other results. The figg air re-sults were not accurate and showed lots of errors. This may be due to many factors such as test condi-tions and method, concrete variability or operator skill. In addition to this, there may be issues with figg air apparatus, such as, an escape of the air from the concrete hole and this is leading to false results. The results established a good concrete strength and quality apart from illogical results of concrete porosi-ty and air permeability. According to in-situ testing results the following has been concluded: - The increase in w/c ratio leads to a decrease in compressive strength and ultrasonic pul- se velocity. Thus, lower w/c ratio gives a better concrete strength in terms of quality. - The quicker the ultrasonic pulse travels through concrete indicates that the concrete is denser, there-fore, better quality. - The lower initial surface absorption value indicates a better concrete with respect to porosity. - The concrete porosity is considered to be poor if air permeability is less than 25 seconds (ISAT). - The relation between rebound hammer and ultra-sonic pulse tests is that, an increase in compressive strength leads to increase in the ultrasonic pulse ve-locity. - The w/c ratio plays an important role in the strength and permeability of concrete. There is a relationship between strength tests and permeation tests but it is hard to deter- mine due to some false results obtained in the lab for initial sur-face absorption and Figg air tests. In general, if the w/c ratio decreases with a decrease in permeability and an increase in compressive strength, then it can be that there is a relationship between two tests. The re- sults could have been improved by increasing the number of concrete specimens for testing and by maintain better conditions. ACKNOWLEDGEMENT: I would like to thank my family, my mother, my father and my brothers for their moral support. Many thanks to Dr. Judith Hal-liday a senior lecturer at the University of Dundee and to all the staff of the Department of Civil Engi-neering in the University of Dundee for their tech-nical support for providing the material and for mak-ing the concrete structures laboratory available for conducting this experimental study.
- 19. 40 (22-40) Revista Tecnología y Ciencia DOI: https://doi.org/10.33414/rtyc.36.22-40.2019 - ISSN 1666-6933 Universidad Tecnológica Nacional Octubre 2019 / Año 17- Nº 36 Evaluating Concrete Quality using Nondestructive In-situ Testing Methods Khalid Abdel Naser Abdel Rahim, et al. REFERENCES Abdel Rahim, K. (2019). EXPERIMENTAL STUDY ON THE MIX DESIGN AND FRESH PROPERTIES OF CONCRETE. Australian Journal of Science and Technology, 3(1), 2208- 6404. doi:http://www.aujst.com/vol-3-1/04-AJST-70_REV.pdf Abdel Rahim, K. (2019). CONCRETE SPECIFI-CATIONS AND METHODS OF QUALITY TESTING, Asian Institute of Research, Engineering and Technology Quarterly Reviews, 2(1), 2622-9374. doi:https://www.asianinstituteofresearch.org/ETQRarchives/Concrete- Specification-and-Methods-of-Quality-Testing- Abdel Rahim, K. (2019). EXPERIMENTAL STUDY: DETERMINATION OF CONCRETE REINFORCEMENT CONDITIONS. The Journal of Engineering and Exact Sciences, 5(3), 0212-0219. doi:https://doi.org/10.18540/jcecvl5iss3pp0212-0219 Bungey, J. H., Millard, S. G. and Grantham, M. et al. (2006). Testing of concrete in structures, London ; New York, Taylor & Francis. Neville, A. M. (1996). Properties of concrete, New York, Wiley. Halliday, J. (2010). Assessment of concrete struc-tures, Summary of the test methods to be used in labs. University of Dundee, Dundee, UK. Halliday, J. (2010). Assessing Quality and Durability of Concrete. Lecture 3 Notes Concrete Assessment. University of Dundee, Dundee, UK. The British Standards Institution (BSI), (1988). BS 1881: Part 124: 1988 - Methods of analysis of hard-ened concrete, The British Standards Institution (BSI), London. The British Standards Institution (BSI), (1986). The British Standard, BS 1881: Part 201: 1986 -Guide to the use of non-destructive methods of test for hard-ened concrete, The British Standards Institution (BSI), London. The British Standards Institution (BSI), (1986). The British Standard, BS 1881: Part 202 – Determination of Rebound Number, The British Standards Institu-tion (BSI), London. The British Standards Institution (BSI), (1986). The British Standard, BS 1881: Part 203 – Recommen-dations for measurement of ultrasonic pulses in con-crete, The British Standards Institution (BSI), Lon-don. The British Standards Institution (BSI), (1996). The British Standard, BS 1881: Part 208: 1996 – Rec-ommendations for the determination of the initial surface absorption of concrete, The British Stand-ards Institution (BSI), London. The Concrete Society, (2000). Diagnosis of deterio-ration in concrete structures, Technical Report No.54, Berkshire, Crowthorne.