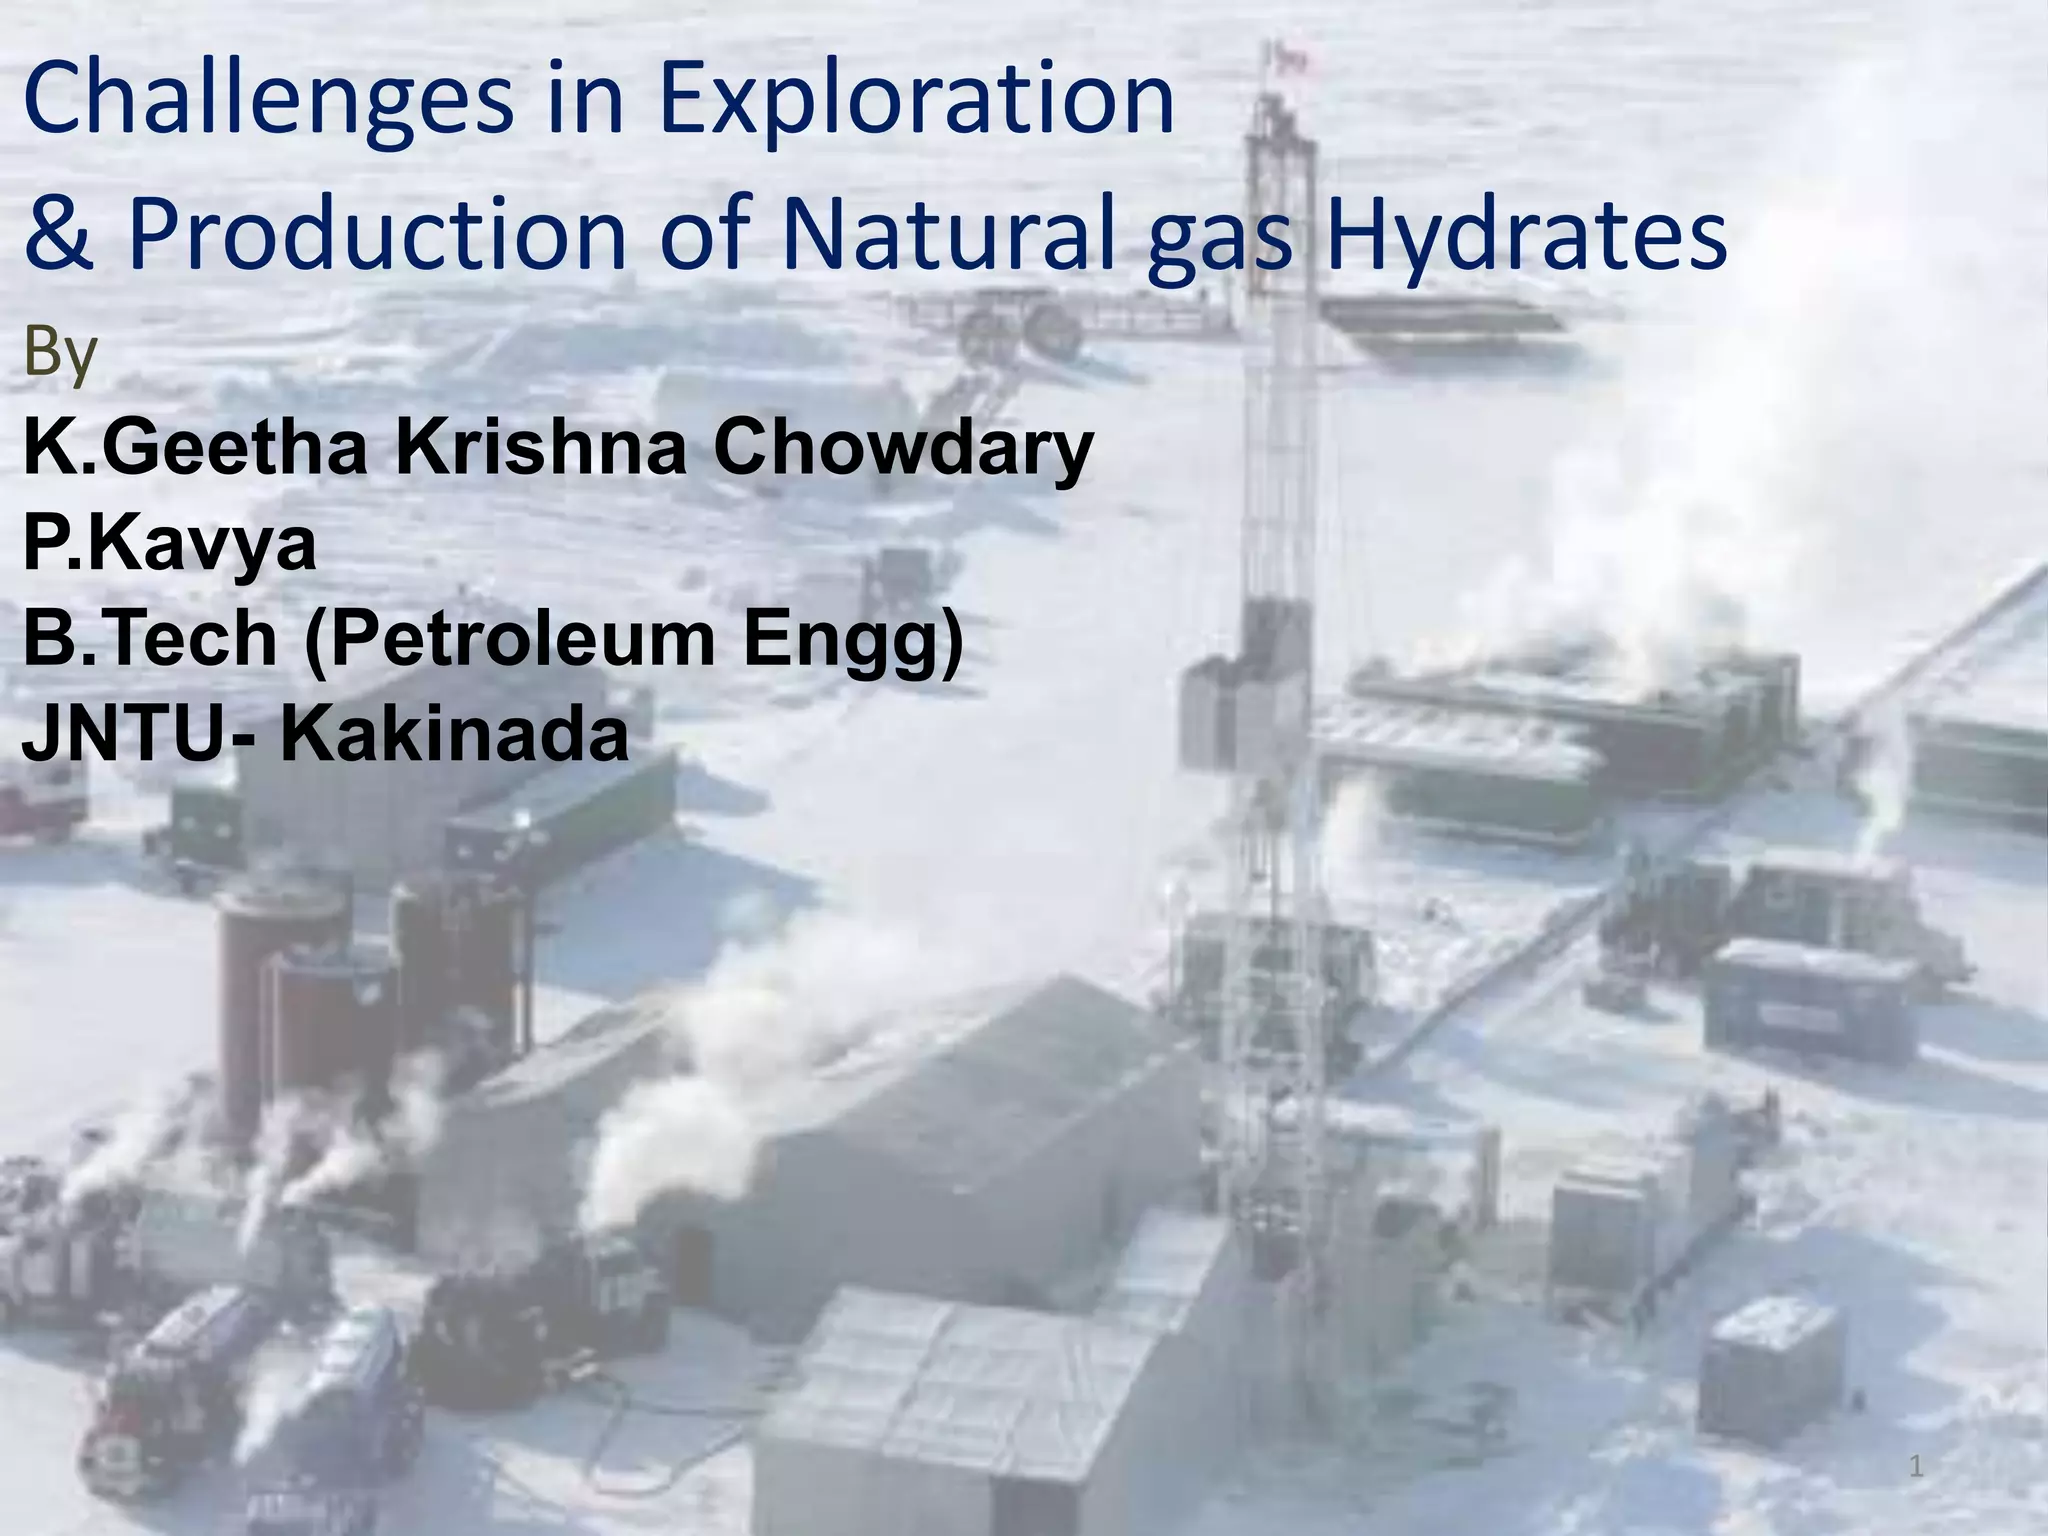
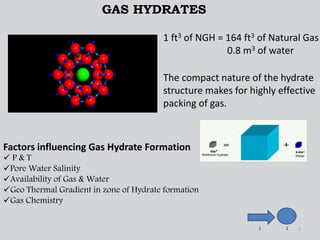
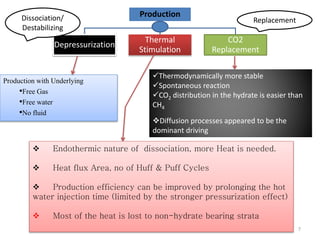
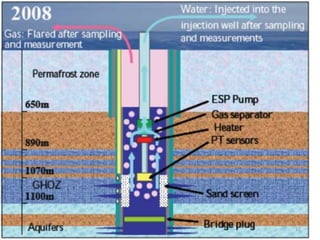
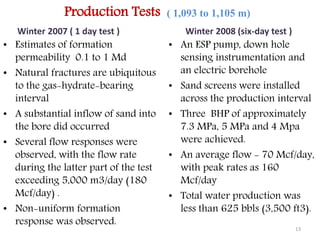
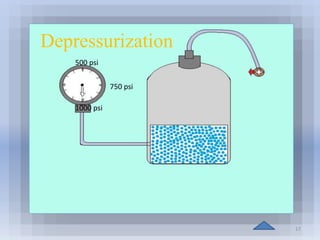
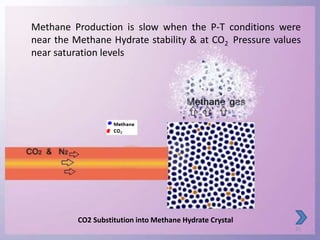
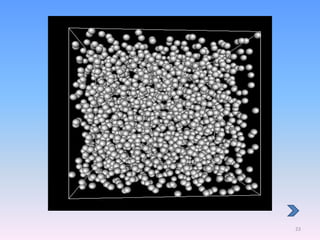
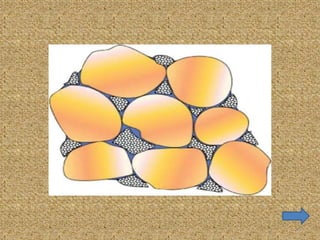
Challenges in Exploration 
& Production of Natural gas Hydrates 
1 
By 
K.Geetha Krishna Chowdary 
P.Kavya 
B.Tech (Petroleum Engg) 
JNTU- Kakinada
1 ft3 of NGH = 164 ft3 of Natural Gas 
0.8 m3 of water 
2 
GAS HYDRATES 
The compact nature of the hydrate 
structure makes for highly effective 
packing of gas. 
Factors influencing Gas Hydrate Formation 
 P & T 
Pore Water Salinity 
Availability of Gas & Water 
Geo Thermal Gradient in zone of Hydrate formation 
Gas Chemistry 
1 2
Structure of Gas Hydrates 
3 
 The hydrocarbon hydrates are non-stoichiometric substances 
 Distinguished by the size of the cavities and the ratio between large and small cavities 
 The size and shape of the guest molecule influences the structure formed
Classification of Hydrates & Hydrate Stable zone 
Class 1:- 
 Hydrate-bearing layer + underlying two-phase layer of mobile gas and water 
 This type of hydrate is considered as the most promising reserve 
Class 2:- 
 Hydrate-bearing layer + Free Water 
 Pressure Depletion is small comparatively 
Class 3:- 
 Absence of an underlying zone of mobile fluids. 
 The whole hydrate-bearing layer is in P-T balance stability region. 
Therefore, the gas production rate is slow during the exploitation 
process 
4
Area Enclosed Between Phase boundary & Geothermal Gradient- 
Hydrate Stable zone 
The top of the HSZ is in most instances much shallower in the 
onshore permafrost environment than in the oceanic environment. 
5
Identifying Gas Hydrates 
6 
BSR 
 Strong Acoustic Impedance Contrast, causing seismic wave to reflect upwards 
 Mapped to the maximum depth of 1100 mts 
 Only indicator but doesn’t quantifies the amount 
Measures Physical properties of sediments adjacent to formation 
Resistivity of massive CH4 hydrate is of order 150-170 Ω.mtr 
 Based on Pockmarks & mud diapers which is indicated by 
reliefs 
 Whether Present/ only past hydrate presence is unknowable 
from this data
Thermodynamically more stable 
Spontaneous reaction 
CO2 distribution in the hydrate is easier than 
CH4 
7 
Production 
Depressurization 
Thermal 
Stimulation 
CO2 
Replacement 
Dissociation/ 
Destabilizing 
Replacement 
Production with Underlying 
•Free Gas 
•Free water 
•No fluid 
Diffusion processes appeared to be the 
dominant driving 
 Endothermic nature of dissociation, more Heat is needed. 
 Heat flux Area, no of Huff & Puff Cycles 
 Production efficiency can be improved by prolonging the hot 
water injection time (limited by the stronger pressurization effect) 
 Most of the heat is lost to non-hydrate bearing strata
8
Decomposition 
Amount & The rate of 
the heat injected 
9
 Landslide & Subsidence 
10 
 Global Warming 
 Mechanical Hazard-Safety Issue 
Hydrate presence would inhibit normal compaction & cementing 
 Drilling Hazard 
 Water Disposal
Case Study 
 1st Onshore Production test at Mallik field 
 1o objective to measure and monitor the production response 
(Prospect) 
Winter 2007 
 Production Test Winter 2008 
 Experience with test wells at Mallik and elsewhere suggests that most 
problems in drilling and completion of gas hydrate wells can be 
foreseen and successfully dealt with at the design stage, including 
using: 
 Chilled drilling fluids 
 Sand control methods 
 Ports for injecting chemicals and provisions for near-wellbore Heating 
 Monitoring devices 
11
12
Production Tests ( 1,093 to 1,105 m) 
Winter 2007 ( 1 day test ) 
• Estimates of formation 
permeability 0.1 to 1 Md 
• Natural fractures are ubiquitous 
to the gas-hydrate-bearing 
interval 
• A substantial inflow of sand into 
the bore did occurred 
• Several flow responses were 
observed, with the flow rate 
during the latter part of the test 
exceeding 5,000 m3/day (180 
Mcf/day) . 
• Non-uniform formation 
response was observed. 
Winter 2008 (six-day test ) 
• An ESP pump, down hole 
sensing instrumentation and 
an electric borehole 
• Sand screens were installed 
across the production interval 
• Three BHP of approximately 
7.3 MPa, 5 MPa and 4 Mpa 
were achieved. 
• An average flow - 70 Mcf/day, 
with peak rates as 160 
Mcf/day 
• Total water production was 
less than 625 bbls (3,500 ft3). 
13
14
15 
Consumption of Natural Gas is 100BCM/Year 
1% = 18.94 TCM = 189 Years
16
Depressurization 
17 
500 psi 
750 psi 
1000 psi
18
19
20
Methane Production is slow when the P-T conditions were 
near the Methane Hydrate stability & at CO2 Pressure values 
near saturation levels 
21 
CO2 Substitution into Methane Hydrate Crystal
22
23
24

Natural Gas Hydrates

  • 1.
    Challenges in Exploration & Production of Natural gas Hydrates 1 By K.Geetha Krishna Chowdary P.Kavya B.Tech (Petroleum Engg) JNTU- Kakinada
  • 2.
    1 ft3 ofNGH = 164 ft3 of Natural Gas 0.8 m3 of water 2 GAS HYDRATES The compact nature of the hydrate structure makes for highly effective packing of gas. Factors influencing Gas Hydrate Formation  P & T Pore Water Salinity Availability of Gas & Water Geo Thermal Gradient in zone of Hydrate formation Gas Chemistry 1 2
  • 3.
    Structure of GasHydrates 3  The hydrocarbon hydrates are non-stoichiometric substances  Distinguished by the size of the cavities and the ratio between large and small cavities  The size and shape of the guest molecule influences the structure formed
  • 4.
    Classification of Hydrates& Hydrate Stable zone Class 1:-  Hydrate-bearing layer + underlying two-phase layer of mobile gas and water  This type of hydrate is considered as the most promising reserve Class 2:-  Hydrate-bearing layer + Free Water  Pressure Depletion is small comparatively Class 3:-  Absence of an underlying zone of mobile fluids.  The whole hydrate-bearing layer is in P-T balance stability region. Therefore, the gas production rate is slow during the exploitation process 4
  • 5.
    Area Enclosed BetweenPhase boundary & Geothermal Gradient- Hydrate Stable zone The top of the HSZ is in most instances much shallower in the onshore permafrost environment than in the oceanic environment. 5
  • 6.
    Identifying Gas Hydrates 6 BSR  Strong Acoustic Impedance Contrast, causing seismic wave to reflect upwards  Mapped to the maximum depth of 1100 mts  Only indicator but doesn’t quantifies the amount Measures Physical properties of sediments adjacent to formation Resistivity of massive CH4 hydrate is of order 150-170 Ω.mtr  Based on Pockmarks & mud diapers which is indicated by reliefs  Whether Present/ only past hydrate presence is unknowable from this data
  • 7.
    Thermodynamically more stable Spontaneous reaction CO2 distribution in the hydrate is easier than CH4 7 Production Depressurization Thermal Stimulation CO2 Replacement Dissociation/ Destabilizing Replacement Production with Underlying •Free Gas •Free water •No fluid Diffusion processes appeared to be the dominant driving  Endothermic nature of dissociation, more Heat is needed.  Heat flux Area, no of Huff & Puff Cycles  Production efficiency can be improved by prolonging the hot water injection time (limited by the stronger pressurization effect)  Most of the heat is lost to non-hydrate bearing strata
  • 8.
  • 9.
    Decomposition Amount &The rate of the heat injected 9
  • 10.
     Landslide &Subsidence 10  Global Warming  Mechanical Hazard-Safety Issue Hydrate presence would inhibit normal compaction & cementing  Drilling Hazard  Water Disposal
  • 11.
    Case Study 1st Onshore Production test at Mallik field  1o objective to measure and monitor the production response (Prospect) Winter 2007  Production Test Winter 2008  Experience with test wells at Mallik and elsewhere suggests that most problems in drilling and completion of gas hydrate wells can be foreseen and successfully dealt with at the design stage, including using:  Chilled drilling fluids  Sand control methods  Ports for injecting chemicals and provisions for near-wellbore Heating  Monitoring devices 11
  • 12.
  • 13.
    Production Tests (1,093 to 1,105 m) Winter 2007 ( 1 day test ) • Estimates of formation permeability 0.1 to 1 Md • Natural fractures are ubiquitous to the gas-hydrate-bearing interval • A substantial inflow of sand into the bore did occurred • Several flow responses were observed, with the flow rate during the latter part of the test exceeding 5,000 m3/day (180 Mcf/day) . • Non-uniform formation response was observed. Winter 2008 (six-day test ) • An ESP pump, down hole sensing instrumentation and an electric borehole • Sand screens were installed across the production interval • Three BHP of approximately 7.3 MPa, 5 MPa and 4 Mpa were achieved. • An average flow - 70 Mcf/day, with peak rates as 160 Mcf/day • Total water production was less than 625 bbls (3,500 ft3). 13
  • 14.
  • 15.
    15 Consumption ofNatural Gas is 100BCM/Year 1% = 18.94 TCM = 189 Years
  • 16.
  • 17.
    Depressurization 17 500psi 750 psi 1000 psi
  • 18.
  • 19.
  • 20.
  • 21.
    Methane Production isslow when the P-T conditions were near the Methane Hydrate stability & at CO2 Pressure values near saturation levels 21 CO2 Substitution into Methane Hydrate Crystal
  • 22.
  • 23.
  • 24.