Drawing Conclusions Designing an Experiment
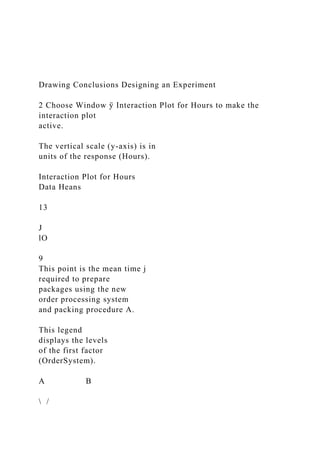
2 Choose Window ÿ Interaction Plot for Hours to make the interaction plot
active.
The vertical scale (y-axis) is in
units of the response (Hours).
Interaction Plot for Hours
Data Heans
13
J
lO
9
This point is the mean time j
required to prepare
packages using the new
order processing system
and packing procedure A.
This legend
displays the levels
of the first factor
(OrderSystem).
A B
\ /
The horizontal scale (x-axis) shows the
levels of the second factor (Pack).
An interaction plot shows the impact that changing the settings of one factor has
on another factor. Because an interaction can magnify or diminish main effects,
evaluating interactions is extremely important.
The plot shows that book orders processed with the new order processing system
and packing procedure B took the fewest hours to prepare (about 9 hours). Orders
processed with the current order processing system and packing procedure A took
the longest to prepare (about 14.5 hours). Because the slope of the line for the
new order processing system is steeper, you conclude that the packing procedure
has a greater effect when the new order processing system is used versus the
current order processing system.
Based on the results of the experiment, you recommend that the Western
shipping center use the new order processing system and packing procedure B to
speed up the book shipping process.
Save Project 1 Choose File ÿ Save Project As.
2 Navigate to the folder in which you want to save your files.
3 In File name, enter My_DOE.MPJ.
4 Click Save.
/j
Meet Minitab 5-11
Chapter 5 What's Next
What's Next
The factorial experiment indicates you can decrease the time it takes to prepare
orders at the Western shipping center by using the new order processing system and
packing procedure B. In the next chapter, you learn how to use command language
and create and run Execs to quickly rerun an analysis when new data are collected.
5-12 Meet Minitab
6
Using Session
Commands
Objectives
In this chapter, you:
[] Enable and type session commands, page 6-2
[] Conduct an analysis using session commands, page 6-3
[] Rerun a series of session commands with Command Line Editor, page 6-5
[] Create and run an Exec, page 6-7
Overview
Each menu command has a corresponding session command. Session commands
consist of a main command and, in most cases, one or more subeommands.
Commands are usually easy-to-remember words, such as PLOT, CHART, or SORT.
Both main commands and subcommands can be followed by a series of arguments,
which can be columns, constants, or matrices, text strings, or numbers.
Session commands can be:
[]
[]
Typed into the Session window or the Command Line Editor.
Copied from the History folder to the Command Line Editor. (When you use
menu comma.
Drawing Conclusions Designing an Experiment2 Choose Window.docx
1. Drawing Conclusions Designing an Experiment
2 Choose Window ÿ Interaction Plot for Hours to make the
interaction plot
active.
The vertical scale (y-axis) is in
units of the response (Hours).
Interaction Plot for Hours
Data Heans
13
J
lO
9
This point is the mean time j
required to prepare
packages using the new
order processing system
and packing procedure A.
This legend
displays the levels
of the first factor
(OrderSystem).
A B
/
2. The horizontal scale (x-axis) shows the
levels of the second factor (Pack).
An interaction plot shows the impact that changing the settings
of one factor has
on another factor. Because an interaction can magnify or
diminish main effects,
evaluating interactions is extremely important.
The plot shows that book orders processed with the new order
processing system
and packing procedure B took the fewest hours to prepare
(about 9 hours). Orders
processed with the current order processing system and packing
procedure A took
the longest to prepare (about 14.5 hours). Because the slope of
the line for the
new order processing system is steeper, you conclude that the
packing procedure
has a greater effect when the new order processing system is
used versus the
current order processing system.
Based on the results of the experiment, you recommend that the
Western
shipping center use the new order processing system and
packing procedure B to
speed up the book shipping process.
Save Project 1 Choose File ÿ Save Project As.
2 Navigate to the folder in which you want to save your files.
3 In File name, enter My_DOE.MPJ.
3. 4 Click Save.
/j
Meet Minitab
5-11
Chapter 5 What's Next
What's Next
The factorial experiment indicates you can decrease the time it
takes to prepare
orders at the Western shipping center by using the new order
processing system and
packing procedure B. In the next chapter, you learn how to use
command language
and create and run Execs to quickly rerun an analysis when new
data are collected.
5-12 Meet
Minitab
6
Using Session
Commands
Objectives
In this chapter, you:
[] Enable and type session commands, page 6-2
4. [] Conduct an analysis using session commands, page 6-3
[] Rerun a series of session commands with Command Line
Editor, page 6-5
[] Create and run an Exec, page 6-7
Overview
Each menu command has a corresponding session command.
Session commands
consist of a main command and, in most cases, one or more
subeommands.
Commands are usually easy-to-remember words, such as PLOT,
CHART, or SORT.
Both main commands and subcommands can be followed by a
series of arguments,
which can be columns, constants, or matrices, text strings, or
numbers.
Session commands can be:
[]
[]
Typed into the Session window or the Command Line Editor.
Copied from the History folder to the Command Line Editor.
(When you use
menu commands, Minitab generates and stores the
corresponding session
commands in the History folder.)
Copied and saved in a file called an Exec, which can be
5. reexecuted and shared
with others or used in future sessions.
Meet Minitab
6-1
Chapter 6 Enabling and Typing Commands
Use session commands to quickly rerun an analysis in current or
future sessions or as
an alternative to menu commands. Some users find session
commands quicker to
use than menu commands once they become familiar with them.
The Western shipping center continuously collects and analyzes
shipping time when
new data are available. In Chapter 4, Assessing Quality, you
conducted a capability
analysis on data from March. In this chapter, you conduct a
capability analysis on
data from April using session commands.
To learn more about session commands, choose Help ÿ Help,
then click Session Commands
Eÿ under References.
Enabling and Typing Commands
One way to use session commands is to directly type the
commands and
subeommands at the command prompt in the Session window.
However, Minitab
does not display the command prompt by default. To enter
commands directly into
the Session window, you must enable this prompt.
6. Enable
session
commands
1 If continuing from the previous chapter, choose File 1,ÿ New,
then choose
Minitab Project and click OK. Otherwise, just start Minitab.
2 Choose File 1,- Open Worksheet.
3 Click Look in Minitab Sample Data folder, near the bottom of
the dialog box.
4 In the Sample Data folder, double-click Meet Minitab, then
choose
SessionCommands.MTW. Click Open.
5 Click the Session window to make it active.
6 Choose Editor l,ÿ Enable Commands. A check appears next to
the menu item.
To change the default options and enable session commands for
all future sessions:
1 Choose Tools ÿ Options ÿ Session Window ÿ Submitting
Commands.
2 Under Command Language, click Enable.
6-2 Meet
Minitab
Enabling and Typing Commands Using Session Commands
7. Examine
Session
window
With the command prompt enabled, you can now type session
commands in the
Session window.
Command
prompt
-- ÿ/4/2009 7:03:46 PM
Welcome to Ninitab, pzess FI fox help,
wrB>l
Conduct an
analysis with
session
commands
I When you execute a command from a menu and session
commands are enabled, the
I corresponding session command appears in the Session
window along with your text output.This technique provides a
convenient way to learn session commands.
In Chapter 4, Assessing Quality, you conducted a capability
analysis to determine
whether shipping times were within specifications (less than six
delivery days). To
8. perform this analysis, you used Stat ÿ Quality Tools ÿ
Capability Analysis
Normal. Then, using two different dialog boxes, you entered
several variables and
values.
To continue evaluating shipping times at the Western shipping
center, you plan to
repeat this analysis at regular intervals. When you collect new
data, you can re-create
this chart using just a few session commands, instead of filling
out multiple dialog
boxes. Analyze the April shipping data using session
commands.
1 In the Session window, at the MTB >prompt, type:
CAPABILITY 'Days' 'Date';
2 Press [Enter].
The semicolon indicates that you want to type a subcommand.
Meet Minitab
6-3
Chapter 6 Enabling and Typing Commands
Notice that the MTB > prompt becomes SUBC>, allowing you
to add
subeommands for the various options used in the earlier
capability analysis.
9. 3/4/2009 "/:19:46 PM
Welcome to Minitab, press F1 for help,
Subcommand
prompt
Results for: SessionOommands.MTW
MTB > CAPABILITY 'Days' 'Date';
-- -SUBC> I
v
<i I >i !
3 At the SUBC> prompt, type:
USPEC 6;
4 Press [Enter].
5 At the SUBC> prompt, type:
TARGET 3.3 3.
6 Press [Enter].
The period indicates the
end of a command
sequence.
Minitab displays the
capability analysis for the
April shipping data.
10. Process Capability of Days
LÿL Proceÿ D,ÿa
Tÿt 333
Wÿ 2.9g02
L' L
cÿJ 156
o cÿ lÿs6
Ppt/ 1.56
k cÿm Iÿ
1.50'21S 3.1ÿ0 3.75 4.50 5.25 6.00
PeN < kSk * Pÿt.1 < t-ÿ • PPN < tÿ *
PPM>Lÿ 003 P;ÿ,l>Uÿ 1.39 ÿ>Lÿ 124
PPMTOtÿ ooo Pÿ/IToN 139 Pÿ4ToN 134
For more information on session commands, including command
and subcommand syntax,
type Help at the command prompt followed by the first four
letters of the command name. For
general information on syntax notation, go to Help ÿ Help, then
click Session Commands
under References. Go to Notation forsession commands in the
Session Command Help index.
6-4 Meet
Minitab
11. Rerunning a Series of Commands Using Session Commands
Rerunning a Series of Commands
Minitab generates corresponding session commands for most of
the menu
commands you used, and stores them in the Proiect Manager's
History folder. Rather
than repeat all the previous steps of your analysis using the
menus, you can simply
rerun these commands by selecting them in the History folder
and choosing Edit
Command Line Editor.
Session commands for the capability analysis you just
conducted are stored in the
History folder. Use the History folder and the Command Line
Editor to re-create the
capability analysis.
Open History
folder
1 Choose Window ÿ Project Manager.
2 Click the History folder.
History __
folder
The right pane of the Project Manager contains all the session
commands generated
during a Minitab session. These commands are stored regardless
of whether the
12. command prompt is enabled.
When you select any portion of the session commands in the
History folder, those
commands automatically appear in the Command Line Editor
when you open it.
Reexecute
a series of
commands
1 To highlight the capability analysis session commands, click
CAPABILITY 'Days'
'Date'; then press [Shift] and click TARGET 3.33.
Meet Minitab
6-5
Chapter 6 Repeating Analyses with Execs
Choose Edit ÿ Command Line
Editor.
3 Click Submit Commands.
US,oÿC 6;
ARGET 3.33.
Graph
window
output
ProcessCapabilityof Days
13. Tÿ 333
Tar,ÿt
i
LL:ÿ.
Corn 1.23
t,50 2,25 3.00 3,75 4.50 5.25 6.00
cbÿd Pedofÿ |
PPÿ4 TOtÿ 0,00 F=ÿ, Wÿhn Peffÿ-ÿeJ F::ÿ, O,ÿal Pÿfofmaÿe
<L% * Pÿ < L% " Fff4 < Lÿ_ *
PPM>Lÿ 0ÿ0 PPM>ÿ 139 Pÿ4>LÿL ÿ34
PPÿ4 TOÿ 1.39 PÿTOÿ 134
You have re-created the capability analysis in just a few simple
steps.
If you edit a graph or a control chart, Minitab does not
automatically generate session
commands for the changes made. However, you can generate the
session commands,
including all editing changes, by using:
[] Editor ÿ Copy Command Language, which copies the
commands to the Clipboard.
[] Editor ÿ Duplicate Graph, which re-creates the graph and
stores the session commands in
the History folder.
14. For more information on Copy Command Language and
Duplicate Graph, go to Editormenu
and choose the Graph window subentry in the Minitab Help
index.
Repeating Analyses with Execs
An Exec is a text file containing a series of Minitab commands.
To repeat an analysis
without using menu commands or typing session commands,
save the commands as
an Exec and then run the Exec.
6-6 Meet
Minitab
Repeating Analyses with Execs Using Session Commands
The commands stored in the History folder that you used to
rerun the above series of
commands with the Command Line Editor can also be saved as
an Exee and
executed at any time.
I For more information about Execs and other more complex
macros, choose Help 1ÿ Help, then
[email protected] click Macros under References.
Create an
Exec from the
History folder
15. Save the capability analysis session commands as an Exec. You
can use this Exec to
continuously analyze the shipping data.
1 Choose Window ),- Project Manager.
2 Click the History folder.
3 To select the capability analysis session commands, click
CAPABILITY 'Days'
'Date';, then press [Shift] and click TARGET 3.33.
4 Right-click the selected text and choose Save As.
_3 unblled
Sosÿon
c*arÿs
Rÿo,tPad
'4 ÿ 5esÿonCorrcnands.ÿ
L3 cÿ
C-ÿ Constants
WOÿa °C:ÿcÿram Fÿsÿrÿtabÿ 16ÿ,hÿDeÿaWÿt kIÿrO:abtSes
sÿoncÿ, f4TVg.
USÿC 6/
Tÿ.R6ET 3.33,
e
< ! >
5 Navigate to the folder in which you want to save your files.
16. 6 In File name, type ShippingGraphs.
7 In Save as type, choose Exec Files (*.MTB). Click Save.
Reexecute
commands
You can repeat this analysis at any time by running the Exec.
1 Choose File ÿ Other Files ÿ Run an Exec.
2 Click Select File.
3 Select the file ShippingGraphs.MTB, then click
Open.
xÿbet of tÿmes to ex eÿt e: ÿ"
Meet Minitab
6-7
Chapter 6 What's Next
Graph
window
output
Process CapabilityofDays
Tÿ@et 3ÿ
Sarnÿa r.'ÿ 2.9002
SamÿN NO
17. TO-get
t
L J%%
cÿt
cro 1.56
cÿ 1ÿ
Oÿ v/
PPL *
FÿtJ 1ÿ
Ppk iÿ
Cpm 1.ÿ
1.S0 2.25 3.00 3.75 4.50 5.25 6.00
PPt4TOÿ oÿ ÿ4TCÿ 1ÿ
Save project
Minitab executes the commands in the Exec to generate the
capability analysis.
Because you can run the Exec using any worksheet (as long as
the column names
match), you can share this file with other Minitab users who
need to do the same
analysis. For example, the Western shipping center may want to
share the capability
analysis Exee with the Central and Eastern shipping centers so
they can conduct the
same analysis on their own shipping data. If you want to use the
Exec with a different
worksheet or with different column, edit the Exec using a text
18. editor such as
Notepad.
Save all of your work in a Minitab project.
1 Choose File ÿ Save Project As.
2 In File name, type My_SessionCommands.MPJ.
3 Click Save.
What's Next
You learned how to use session commands as an alternative to
menu commands and
as a way to quickly rerun an analysis. In the next chapter, you
create a report to show
the results of your analysis to your colleagues.
6-8 Meet
Minitab
7
Generating a Report
Objectives
In this chapter, you:
[] Add a graph to the ReportPad, page 7-2
[] Add Session window output to the ReportPad, page 7-3
m Edit in the ReportPad, page 7-5
19. [] Save and view a report, page 7-6
[] Copy the ReportPad contents to a word processor, page 7-7
[] Edit a Minitab graph in another application, page 7-7
[] Send output to Microsoft PowerPoint, page 7-10
Overview
Minitab has several tools to help you create reports:
[] ReportPad in the Projeet Manager, to whieh you can add
Minitab-generated
results throughout your sessions
[] Copy to Word Processor, which enables you to easily copy
content from the
ReportPad to a word processor
[] Embedded Graph Editor, for editing graphs with Minitab after
you have copied
them to other applications
[] Send To Microsoft Word or PowerPoint, which enables you to
send Session
window output and graphs directly to Word or PowerPoint
To show your colleagues the shipping data analysis results, you
want to prepare a
report that ineludes various elements from your Minitab
sessions.
Meet Minitab
7-1
20. Chapter 7 Using the ReportPad
Using the ReportPad
Throughout Meet Minitab, you performed several analyses and
you want to share
the results with colleagues. Minitab's Project Manager contains
a folder, called the
ReportPad, in which you can create simple reports.
The ReportPad acts as a simple text editor (like Notepad), from
which you can
quiekly print or save in RTF (rich text) or HTML (Web) format.
In ReportPad, you
can:
[] Store Minitab results and graphs in a single document
[] Add comments and headings
[] Rearrange your output
[] Change font sizes
[] Print entire output from an analysis
[] CreateWeb-ready reports
Add graph to
ReportPad
You can add components to ReportPad by right-clicking on a
graph or Session
window output, then ehoosing Append to Report. In addition,
text and graphs from
other applieations can be copied and pasted into Minitab's
21. ReportPad.
Add the histogram with fits and groups you created in Chapter
2, Graphing Data, to
the ReportPad.
1 If continuing from the previous chapter, choose File ÿ- New,
then choose
Minitab Project. Click OK. Otherwise, just start Minitab.
2 Choose File ÿ Open Project.
3 Navigate to C:Program FilesMinitabMinitab
16EnglishSample DataMeet
Minitab. (Adjust this if you chose to install Minitab to a
location other than the
default.)
4 Choose Reports.MPJ. Cliek Open.
5 Choose Window ÿ Histogram of Days.
7-2 Meet
Minitab
Using the ReportPad Generating a Report
6 Right-click anywhere in the graph region, then choose Append
Graph to Report.
ResuÿstorCentQr=WlitQm
7
22. Graph
region
Add Session
window
output to
ReportPad
7 Choose Window ÿ Project Manager.
8 Click the ReportPad folder. The histogram has been added to
the ReportPad.
You also can add Session window output to the ReportPad. In
Chapter 3, Analyzing
Data, you displayed descriptive statistics for the three regional
shipping centers. Add
the output for the three centers to the ReportPad.
1 Choose Window ÿ Session.
Meet Minitab
7-3
Chapter 7 Using the ReportPad
2 In the Session window, click in the output for Results for
Center = Central. Then
right-click and choose Append Section to Report. The section of
output Minitab
appends is delineated by the output titles (which are in bold
text).
23. If you right-click in
this area and choose
Append Section to I--
Report, the results for-Lthe Central shipping
center are added to
the ReportPad.
D.SCÿpÿV. S"ÿSUCI: Dÿ
Risuÿs for ceaÿ.r = c*nÿrÿ
Toÿ
T*tla
k p, r,ÿ.. asm
t*2
3 Repeat the steps above for the Results for Center = Eastern
and Results for
Center = Western.
4 Choose Window ÿ Project Manager, then click the ReportPad
folder. Click []
to maximize the window to see more of your report.
Ntÿaÿ Prol**t Rlÿort
dÿ
RÿtuRs for CÿnIlr = Wlst.rn
7-4 Meet
Minitab
Using the ReportPad Generating a Report
24. y To add multiple sections of Session window output to the
ReportPad:1 Highlight the Session window output.
2 Right-click in the Session window.
3 Choose Append Selected Lines to Report.
Edit in
ReportPad
Customize the report by replacing the default title and adding a
short comment to
the graphical output.
1 Highlight the default title (Minitab Project Report). Type
Report on Shipping
Data. Press [Enter].
2
3
Below Report on Shipping Data, type Histogram of delivery
time by center.
4
Highlight the text Histogram of delivery
time by center. Right-click the
highlighted text and choose Font.
From Font, choose Axial. From Font
style, choose Regular. From Size,
choose 11. From Color, choose
Maroon.
25. Foÿ Foca :tyÿ: Size:
Arÿl Blaÿk ÿ Itÿc 1]!2ÿ
Bÿ 14
{) A6N Urÿcode MS
10 Bÿeuÿ 93 v v
Click OK.
Etfÿs = SÿPÿ i
F suÿoÿ ] AaBbYyZzF Undefÿ-ÿ
Cc4ÿ
, i [wo,ÿo _-J
f fÿ ÿ ÿ OpenType fotL Thh :area forÿ wÿ3 be uÿed oÿ both
your
2345ÿ7
Rllu]tl for Cent,r = WI itlm
3
Meet Minitab
7-5
Chapter 7 Saving a Report
You now have a simple report that illustrates some of your
results. If you save a
Minitab project, you can add additional comments and
26. formatting at any time
because Minitab saves the ReportPad contents as part of the
project.
,aww All graphs and Session window output remain fully
editable after they are appended to the
ReportPad. To edit a graph in the ReportPad, double-click the
graph to activate Minitab's
embedded graph editing tools.
Saving a Report
You can save the contents of the ReportPad (as well as Session
window output and
worksheets) either as Rich Text Format (RTF) or Web Page
(HTML) so you can open
them in other applications.
Save as
RTF file
Save your report as an RTF file to send electronically to
colleagues or to open in
other applications.
In the Project Manager,
right-click the ReportPad
folder and choose Save
Report As.
2 Navigate to the folder in
which you want to save
your files.
In Save as type, choose
Rich Text Format
(*.RTF). Click Save.
27. In File name, type
ShiDpingReport.
Report on Shipping Data
Histogram of delivery brae by center
Histogram of Days
Ncÿrrÿl
Copying a Report to a Word Processor
Word processors provide formatting options not available in
ReportPad, such as
adding callouts to highlight important findings and laying
graphs side by side.
Two tools in ReportPad, Move to Word Processor and Copy to
Word Processor,
enable you to transfer the contents of the ReportPad to your
word processor without
copying and pasting:
7-6 Meet
Minitab
Using Embedded Graph Editing Tools Generating a Report
[] Move to Word Processor transfers the ReportPad contents to a
word processor and
deletes the contents of the ReportPad.
[] Copy to Word Processor transfers the ReportPad contents into
28. a word processor
while leaving the original contents in the ReportPad.
You can also directly add output to Microsoft Word by right-
clicking on Session window output
or a graph and choosing Send Section To Microsoft Word or
Send Graph to Microsoft
Word.
Copy report
to a word
processor
1 In the Project Manager, right-click the ReportPad folder.
2 Choose Copy to Word Processor.
3 In File name, type Shipping Report. You do not need to
choose a file type,
because Rich Text Format (*.RTF) is the only option available.
4 Click Save.
Minitab automatically opens your default word processor and
loads the RTF file
you just saved.
You can now edit your Minitab content in the word processor.
Using Embedded Graph Editing Tools
When you copy graphs to a word processor or other application,
either with copy/
paste or with Copy to Word Processor, you can use the
Embedded Graph Editor to
access all Minitab's graph editing tools.
29. Edit Minitab
graph in a
word
processor
To blend the graph into the report background and create a
better visual effect, use
the Embedded Graph Editor tools to change the fill pattern,
borders, and fill lines of
the graph without returning to Minitab.
Meet Minitab
7-7
Chapter 7 Using Embedded Graph Editing Tools
1 In the word processor, double-click the histogram. Notice that
you now have
several toolbars with editing tools.
Minitab graph
editing tools
Report on Shipping Data
Histogram of del;very t:me by center
Histogram of Days
No(real
4
Graph-region
30. The graph is in edit mode; you can double-click a graph item to
edit it as you
would in Minitab.
2 Double-elick in the graph region of the histogram.
3 Under Fill Pattern, choose Custom.
4 From Type, choose I-W1.
5 Under Borders and Fill Lines, choose Custom.
6 From Type, choose None. Click OK.
7 Click outside of the graph to end edit mode.
7-8 Meet
Minitab
Sending Output to Microsoft PowerPoint Generating a Report
Report on Shlpplrig Data
Histogram of delivery tÿme by center
Histogram of Days
Normal
2 3 4 5 6 7
Day=
Results for Center = Eastern
@
31. Save project
I For more information about Minitab's Embedded Graph Editor,
go to Embedded graph editorin
the Minitab Help index.
Save all of your work in a Minitab project.
1 In Minitab, Choose File >- Save Project As.
2 In File name, type My_ReDorts.MPJ.
3 Click Save.
Sending Output to Microsoft
PowerPoint
You can also create reports or presentations by sending graphs
and Session window
output directly to Microsoft Word or PowerPoint.
Add the histogram and descriptive statistics results to
PowerPoint.
Meet Minitab
7-9
Chapter 7 Sending Output to Microsoft PowerPoint
Send
output to
PowerPoint
1
32. 2
Choose Window ÿ Histogram of Days.
Right-click anywhere in the graph region, then choose Send
Graph to Microsoft
PowerPoint. A new PowerPoint file will open with the
histogram on the first slide.
g?lÿt + I--ÿ , q :ÿTOON*lÿt:l,
Io Eastÿ a/3rmC09ÿ aÿr,mÿlan2 lora612 OÿLÿ* v
3 In Minitab, choose Window ÿ Session.
4 In the Session window, click in the output for Results for
Center = Central. Then
right-click and choose Send Section to Microsoft PowerPoint.
5 Repeat step 4 for Results for Center = Eastern and Results for
Center = Western.
7-10 Meet
Minitab
What's Next Generating a Report
fÿ 2. i
..... 2 '
Results for (;enter = Wesiern
33. Clldqo ÿId notes
A new Microsoft PowerPoint document contains the histogram
and each part of the
Session window output on separate slides. You can edit the
PowerPoint document to
changes titles or font sizes and add text.
To add multiple sections of Session window output to the Word
or PowerPoint:
1 Highlight the Session window output.
2 Right-click in the Session window.
3 Choose Send Selected Lines to Microsoft Word or Send
Selected Lines to Microsoft
PowerPoint.
] When you send a graph to Word or PowerPoint, Minitab's
Embedded Graph Editor is not
'I available.
What's Next
In the next chapter, you learn to prepare a Minitab worksheet.
You combine data
from multiple sources and place them in Minitab. Also, to
prepare the data and
simplify the analysis, you edit the data and reorganize columns
and rows.
Meet Minitab
7-11
Chapter 7 What's Next
34. 7-12 Meet
Minitab
8
Preparing a
Worksheet
Objectives
In this chapter, you:
[] Open a worksheet, page 8-2
[] Merge data from an Excel spreadsheet into a Minitab
worksheet, page 8-3
[] Merge data from a text file into a worksheet, page 8-4
[] View worksheet information, page 8-5
[] Replace missing value, page 8-6
[] Stack columns of data, page 8-6
[] Code data, page 8-8
[] Add column names, page 8-8
[] Insert and name a new data column, page 8-9
[] Use the Calculator to assign a formula to a column, page 8-9
Overview
In many cases, you use worksheets that were already set up for
you, as you have
35. throughout Meet Minitab. Sometimes, however, you must
combine data from
different sources and place them in a Minitab worksheet before
beginning an
analysis. Minitab can use data from:
[] Previously saved Minitab worksheet files
[] Text files
Meet Minitab
8-1
Chapter 8 Getting Data from Different Sources
m Microsoft Excel documents
To place these data in Minitab, you can:
[] Type directly into Minitab
[] Copy and paste from other applications
[] Open from a variety of file types, including Excel or text
files
After your data are in Minitab, you may need to edit cells and
reorganize columns
and rows to get the data ready for analysis. Common
manipulations include stacking,
subsetting, specifying column names, and editing data values.
This chapter shows how to place data from different sources
36. into Minitab and how
ShippingData.MTW, used in chapters 2 and 3, was prepared for
analysis.
Open a
worksheet
Getting Data from Different Sources
For the initial Meet Minitab analyses, the worksheet
ShippingData.MTW, which
contains data from three shipping centers, was already set up.
However, the three
shipping centers originally stored the book order data in
different ways:
[] Eastern--in a Minitab worksheet
[] Central--in a Microsoft Excel file
[] Western--in a text file
To analyze all the book order data, you must combine the data
from all three
shipping centers into a single Minitab worksheet.
Begin with data from the Eastern shipping center, which are
stored in a Minitab
worksheet called Eastern.MTW.
1 If continuing from the previous chapter, choose File ÿ- New,
then choose
Minitab Project and click OK. Otherwise, just start Minitab.
2 Choose File 1,- Open Worksheet.
3 Click Look in Minitab Sample Data folder, near the bottom of
37. the dialog box.
4 In the Sample Data folder, double-click Meet Minitab, then
choose
Eastern.MTW. Click Open.
i Minitab can open a variety of file types. ,no see the file types,
click Files of type in the Open
Worksheet dialog box.
8-2 Meet
Minitab
Getting Data from Different Sources Preparing a Worksheet
Merge data
from Excel
The Central shipping center stored data in an Excel spreadsheet.
To combine the Central book order data with the Eastern data,
merge the data in the
Excel spreadsheet with the data in the current Minitab
worksheet.
1 Choose File ÿ Open
Worksheet. ÿ, : ÿ,oÿ,ÿ ÿ ÿ ÿ ÿ ÿ.
2 From Hles of type, choose
Excel (* .xls; *.xlsx).
3 Choose Central.XLS.
4 Choose Merge.
38. 5 Click Open.
My Recerÿ
Docÿr, ents
Deÿktop
My Docÿneÿs
Ce.aÿd,:4;
Piaceÿ
Examine
worksheet
Choosing Merge adds the Excel data to your current worksheet.
Minitab places the
data in cells to the right of the current worksheet data in
columns C5-C8. If you had
not chosen Merge, Minitab would have placed the data in a
separate worksheet.
Original data Merged data
1 3/312009 8:34 317ÿ 15:21 iOn tim0
2 ÿ3.,3f2009 8:35 3/6.,-z039 17:05 On time
3 ÿ B:38 * Back omJer,
4 13ÿ8:40 3/7f2009 15:52 Oatime
5 !3/312009 8:42 3F3.r2009 14:48 Late
6 ÿ 8:43 3ÿf2089 15:45 On time
7 ;3f3,QO09 8:50 317/2009 10:02 'On time
8 3,'3/2009 8:55 3,9,'2009 16:30 On time
9 i313/2009 8:58 3/af2009 10:32 On time
10 13f3f20099;11 317/20ÿ 16:02 Ontime
39. 255 ÿ 8:48 AM 3/5/2009 4:5ÿ PM On time
198:3.,3/20ÿ 8:52 AM ÿ 3:12 PM On time
299 ÿ'gY2£ÿ8:KSAM 3/H20093:IOpM OntJme
205 3/3/2009 8:88 AM' ÿ 2.59 PM On time
9.04 AM 3.,W2009 10:12 AM On time
93 3f3f20099.O6AM 3tg/28D94:13PM Late
189 3/3/2009 9:ÿ AM 3/af200ÿ 11:17 AM On time
335 3ÿ 9.89 AM 3/SfdtXÿ I0:14 AM On time
211 3ÿ9:11 AM 3iÿf20093:46PM Ontime
254 3/3/2009 9:14 AM 3/6/'2009 3:17 PM On time
-o i C3.T ÿ i Cÿ.8 i C6-D ] cT.T ; c8 l e
Arrival i Staius iDistanceÿ, Order 1 '; Ardval I i Status 1
Distance iJ- - , - , -
307
34O
327
81
235
259
320
228
312
184 y
I Minitab also provides a Merge Worksheets menu command
that provides additional options to
merge two or more open worksheets. For more information on
Merge, go to Merge worksheets
in the Minitab Help index.
40. Meet Minitab
8-3
Chapter 8 Preparing the Worksheet for Analysis
Merge data
from a text
file
The Western shipping center stored data in a simple text file
that you can open using
Notepad or WordPad. To combine the Western book order data
with the Eastern and
Central data, merge the data in the text file with the data in the
current Minitab
worksheet.
1 Choose File ÿ Open Worksheet
2 From Files of type, choose Text (*.txt).
3 Choose Western.TXT.
4 Choose Merge.
5 Click Open.
Examine
worksheet
Choosing Merge adds the data from the text file to the current
worksheet. Minitah
41. places the data in cells to the right of the current worksheet data
in columns
C9-C 12. If you had not chosen Merge, Minitab would have
placed the data in a
separate worksheet,
Origina! data Merged data
3 ;3t3.t2309 8:55 AM 3,'?f2029 3:10 PM On time
4 !3/3ÿ8:58AM: 3fTrz, xÿ2.59PM Ontime
8 i3/3f2029 9:04 AM :3ÿ.t2029 I0:12 AM On time
6 !3!3F20299.02AM: 3/5ÿ4:13PM Late
7 ]3/3/2029 9.02 AM ÿ 11:17 AMiOn time
8 ]3/3./'2059 9.09 AM 3/5F2309 10:I4 AM =On time
9 !3/3.,'20099:11 AM 3ÿf20293:46PMiOntime
t0 !3/3/2009 9:I4 AM 3,ÿ"2ÿ09 3:17 PM On time
327 3ÿ 8:42 =3.ÿ201ÿ9 17:30 On time 227
81 3.rar2029 8:45 3/4ÿ 15:45 On time 303
205 3ÿ 8:47 3f(ÿ 17:02 On time 95
259 3ÿ 9.02 3Fÿf2D02 16:35 iOn time 302
328 3/3ÿ 9.04 '3/7/2009 I1:02 iOn time 94
226 ÿ 9.05,3Y5/2ÿ 16:57 ,On time 281
312 3/3F2009 9:05:3ÿ 18:,t0 :On time 284
184 =3/3F2009 9:22 3/6/2009 17:25 On time 350
Before opening a text file in Minitab, you can see what the data
will look like in the
worksheet by choosing Preview in the Open Worksheet dialog
box.
I ot all text files are in a format that can be easily imported.
Minitab provides several tools for
interpreting text file formats. For more information, go to Text
files in the Minitab Help index.
42. Preparing the Worksheet for Analysis
With the data in a single worksheet, you are almost read}, to
begin the analysis.
However, you must modify the worksheet by:
[] Replacing a missing value
[] Stacking data
[] Replacing data
8-4 Meet
Minitab
Preparing the Worksheet for Analysis Preparing a Worksheet
[] Adding column names
[] Adding a new column
[] Creating a column of calculated values
For a complete list of data manipulations available in Minitab,
go to Data menu in the Minitab
Help index.
Show
worksheet
information
To view a summary of your worksheet columns, use [] on the
Project Manager
43. toolbar. This button will open the Project Manager's Columns
subfolder in the
Worksheets folder. This summary is especially useful in
identifying unequal column
lengths or columns that contain missing values.
1 Click [] on the Project Manager toolbar or press
[Ctrl]+[Mt]+[I].
Order_! C5 105 0 D
Arrival I C6 105 6 D
Status 1 C7 105 0 T
Dlstance_l C8 105 0 N
Order_2 C9 105 0 D
Arrival_2 CIO 104 2 D
Status 2 CII 105 0 T
Distance 2 C12 105 0 N
IIÿ ÿ ?
The Columns subfolder contains details on the current
worksheet. Within each
center, the count should be the same for all columns. Notice that
the counts for the
Eastern data (C1-C4) are 109 for all columns, and the counts for
the Central data
(C5-C8) are 105 for all columns. However, for the Western
center, C10 has a count
of 104 unlike the other columns, which have a count of 105.
2 Click [] again to return to your previous view.
I or more information on the Project Manager toolbar, go to
Project Manager Toolbar in the
Minitab Help index.
44. Meet Minitab
8-5
Chapter 8 Preparing the Worksheet for Analysis
Examine
worksheet
Examine C10 to see what
value is missing. Notice
that the last row of the
column is empty. When
you copy and paste data
from a text or Excel file
into a worksheet, Minitab
interprets empty numeric
or data/time cells as
missing values, which
appear as asterisks (*) by
default. However, if the
last row of a column of
data in a text file contains
an empty cell, Minitab
a, 1 ÿ I ÿ-D CI0-D C11-T ] (212 [ÿ
i l)istance i[ Order 2 .Arrival 2 ÿl Status 2 ]Distance 2J
"'i -- = v- ........ = -
97 I 261 3/3/2009 16:08:3/6/2009 11:56ÿ0n time 2861
g8 I
loll
1oZ
45. 103
lO4
io5I
i06r
221:3/3/2009
274 ÿ373/2099
182 ;373/2009
182 ;37312009
191 313/2009
9813/3/2009
346=3/3/2009
32:3/3/2009
16:10 3/9/20098:30!0n time 217
16:I2i 3t5/2009 8:21 On time 285=
16:16 i3/8/2009 10:05 On time 1991
16:18 3/5/2009 10:12 iOn time 324
16:20 3/5/2009 9:20 iOn time 228
16:26i3/6/2009 11:34 On time 278
16:321 3/7/2009 9:57 On time 4731
16:39,/ iBack order 279
Z '' ! v
/
Empty cell
leaves the cell empty when you paste the data into the
worksheet, as you can see in
column C10.
Replace
missing value
46. For Minitab to perform the correct analysis, you must type the
missing value symbol
in the empty eell of the last row.
1 Click the Data window to make it active,
then choose Editor ÿ Go To ....
2 In Enter column number or name, type
CIO.
3 In Enter row number, type 105. Click OK.
4 In row 105 of column C10, type an asterisk (*). Press [Enter].
Stack data Now that the data are assembled in a single Minitab
worksheet, notice the similar
variables for each shipping center. Some Minitab commands
allow data from
different groups to remain unstacked in separate columns.
Others require groups to
be stacked, with a column of group levels. However, all
analyses can be performed
with stacked data.
To analyze the data, you need to rearrange these variables into
stacked columns. You
can move data within the worksheet by copying and pasting or
use Data menu items
to rearrange blocks of data.
8-6 Meet
Minitab
Preparing the Worksheet for Analysis Preparing a Worksheet
47. Choose Data ÿ Stack ÿ Blocks of
Columns.
From the list of variables, highlight
Order, Arrival, Status, and Distance.
Click Select to move the variables
into the first row of Stack two or
more blocks of columns on top of
each other. Move to the next row.
4
Examine
worksheet
5
6
Repeat step 2 for the order, arrival,
status, and distance columns for the
Central and Western shipping
centers.
Under Store stacked data in, choose
New worksheet. In Name, type
My_ShippingData.
eÿck two ÿ reÿe ÿ of cc6ÿ cÿ tÿ of e.ÿdn cthÿ:
lÿdet4Nstÿce
[
48. F
[
f
I-
5tÿe stÿ data tÿ:
F
Use ÿ.ÿbÿ nar0ÿ In subÿpt €okra
Check Use variable names in subscript column.
Click OK.
The variables for the shipping centers are all in the same
columns, with Order
(Eastern center), Order_l (Central center), and Order_2
(Western center) acting as
labels or subscripts to indicate from which shipping center the
data originated.
Subscripts column
Data entry arrow
1 IOrder
2 IOrder
3 Order
4 !Order
5 ]Order
8 IOrder
7 /Order
8 IOrder
9IOrder
lfl iOrder
49. < , i
3/3/2009 8:34 3/7/2009 15:21 ÿOn time
13/3/2009 8:35 3/6,'2009 17:05 ion time
13/3/2089 8:38, *Back order
3/3/2889 B:4013/7/213139 15:52 jO n time
13/3/2809 8:4213/9/2Q89 14:48 Late
3/3/2009 8:43 3/8/2009 1ÿ5:4510n time
:3/3/2009 8:50 !3/7/2809 10:02 iOn time
i3/3/2009 8:55 3/8/2009 18:30ÿ0n time
3/3/2009 8:58 ÿ3/8/2009 10:32 :On time
:3/3/2089 9:11 3/7/2889 113:02 On time
255,
198
299
205
250
93
189
335
211
254
Meet Minitab
8-7
Chapter 8 Preparing the Worksheet for Analysis
Code data The labels in the Subscripts column do not
adequately indicate which center the
data are from. Code the labels with more meaningful names.
50. 1 Choose Data ÿ Code ÿ Text to Text.
In Code data from columns, enter
Subscripts.
In Store coded data in columns,
enter Subscripts.
In the first row under Original values,
type Order. In the first row under New,
type Eastern.
In the second row under Original
values, type Order1. In the second
row under New, type Central.
C_odÿ data hÿ coÿmrÿ:
I F -------
I [- --
j ÿ r- - I r--
I [ .....
6 In the third row under Original values, type Order_2. In the
third row under
New, type Western.
7 Click OK.
The shipping center labels in the subscripts column are now
Eastern, Central, and
Western.
51. Add column
names
Add column names to the stacked data.
1 Click the data entry arrow in the upper left corner of the Data
window to make it
point to the right.
2 Click in the name cell of Cl. To replace the label Subscripts,
type Center, then
press [Enter].
3 Repeat for the rest of the names:
m In C2, type Order.
i In C3, type Arrival.
! In C4, type Status.
u In C5, type Distance,
Calculate
difference
values
Before saving your new worksheet and performing analyses,
you need to calculate
the number of days that elapsed between order and delivery
dates. You can use
Minitab's Calculator to assign a formula to a column that
calculates these values. If
you change or add data, the calculated values will update
52. automatically.
8-8 Meet
Minitab
Preparing the Worksheet for Analysis Preparing a Worksheet
Insert and name a column
Insert a column named Days between Arrival and Status.
1 Click any cell in C4 to make it active.
2 Right-click and choose Insert Columns.
3 Click in the name cell of C4. Type Days, then press [Enter].
Use Calculator to assign a formula to a column
Use Minitab's Calculator to perform basic arithmetic or
mathematical functions.
Minitab stores the results in a column or constant. You can
assign the formula to the
column so the calculated values update automatically if the data
change.
Compute the delivery time and store the values in the Days
column.
Choose Cole 1,ÿ Calculator.1
2 In Store result in variable, enter Days.
3 In Expression, enter Arrival- Order.
53. 4 Check Assign as a formula.
5 Click OK.
Examine
worksheet
I or more information on formulas in columns, go to Formulas
in the Minitab Help index. For
more information on Minitab's Calculator and the available
operations and functions, go to
Calculator in the Minitab Help index.
You can also add a formula to a column by selecting the column
and choosing Editor
Formulas ÿ Assign Formula To Column.
The Days column contains the newly calculated values that
represent delivery time.
These values are expressed in numbers of days. When you
assign a formula to a
column, an indicator appears in the upper right corner of the
column heading on the
worksheet. This indicator tells you whether the formula is
properly defined and
Meet Minitab
8-9
Chapter 8 Preparing the Worksheet for Analysis
whether the data need to be updated by re-calculating the
54. values. The green plus
sign [] indicates the data are up-to-date.
Status indicator
* I C1-T
[ Center
_ ]Eastern
IEastern
Eastern
Eastern
6 Eastern
7 Eastern
Eastern
9 Eastern
10 Eastern
I c2-o ! o-o c -T J
F °'der i Aÿ.!v,, _ E o.ÿ I st.t.. Imÿ..ce
:3/3/2009 8:34 !3/7/2009 15:211 4.282641On time i 255
i3/3/2009 8:35 3/6/2009 17:0 ÿ, 3.35417;On time 1961
'3/3/2009 8:38 i 5. *iBack order 2991
3/3/2009 8:40 i3/7/2009 15:52 4.30000 !On time 205'
250
93
189
335
55. 211
254'
3.r3/2009 8:42 i3/9/2009 14:48'ÿ 8.25417 !Late
13/3/2009 8:4313,,'8/2009 15:45 5.29308iOn time
i3/3/2009 8:50 i3/7/2009 10:02 4,05800 ion time
i3/3/2009 8:5513/8/2009 18:30ÿ, 5.31597 ion time
;3/3/2009 8:58 i3/8/2009 10:32 ; 5,06528 iOn time
i3/3/2009 9:11 i3/7/2009 16:02 i 4,285421On time
Examine
worksheet
Update
worksheet
;v
>ix
I lace your cursor over the status indicator to view the formula
assigned to the column.
Double-click the status indicator to edit the formula.
Suppose you learn that the arrival date for a shipment in the
Central shipping center
is incorrect. You can correct the date in the worksheet and
Minitab will
automatically update the Days column.
Update the arrival date in row 127 from 3/6/2009 to 3/7/2009.
1 In row 127 of the worksheet, edit the day in the date in the
Arrival column by
double-clicking the cell to put it in edit mode. Change 3/6/2009
to 3/7/2009.
56. 2 Press [Enter].
Minitab automatically updates the value in the Days column
from 2.98125 to
3.98125.
Original worksheet Updated worksheet
i Centerl Order [ Arrival Bays i Status
124 iCentral 3/gf20099:34'3ÿ/2OO9i&09 5.2743110n time
125 !Central 3/3/2009 9:34 3/8/2009 19:47 5.05ÿo9 On time
126 iCentral 3/9ÿ9:41 3/9/200917:13 6.31389 Late
121 !Central 3/9/20099:44 3ÿ!9ÿ99;17ÿOntlme
128 iCentral 3/9ÿ 9:41 3/7/2009 16:08 4/2ÿ458 ÿOn time
129 iCentral 3/3f2009 9.57 3F3f2009 15"59 2.25139 On time
..
; Center! Order [ Arrival ! Days , Status !
124 ICentra] 3,'3/'2009 9:34 3!8/'2009 16:09 5.27431 On time
125 jCentral 3/3/20099:34 318/2009 10:47 5.ÿ Ontime
126 !Central 3f3f2ÿ9 9:41 3/9f28ÿ 17:13 &31389 Late
121 iCentral 3/3,,2009 9:44 3/7f2009 9:17ÿ------ÿ0n time
128 'Central 3/3/'2009 9A7 3/7/23Iÿ 16:08 4.2458 On time
1Z9 ÿCeatral 3/3/2009 9:57 3ÿ5ÿ 15:59 2.25139 On time v
You can also choose to update the calculated values manually.
First, choose Editor ÿ Formulas
- Calculate All Formulas Automatically to uncheck this option.
When the status indicator is
yellow, indicating formulas are out of date, you can choose
Editor ÿ Formulas ÿ Calculate All
Formulas Now to update all formulas in the project. This
command is active only if formulas
are out of date and Calculate All Formulas Automatically is not
57. checked in the Editor menu.
( 8-10
Meet Minitab
What's Next Preparing a Worksheet
Save
worksheet
Save all of your work in a Minitab worksheet.
2
Choose File ÿ Save
Current Worksheet As.
Navigate to the folder in
which you want to save your
files.
3
4
In File name, type
My_ShippingData.
From Save as type, choose
Minitab.
Click Save.
Saÿiÿ [td ÿtoÿtNk4tab
58. t.lÿ Recent
Dÿurrÿtÿ
DÿAÿp
My Docuÿs
MyNÿ:k Savoaÿg,ÿ IMraab -ÿ ÿd _
Pÿs
DeK/iNiÿa.,
What's Next
The shipping center data from several sources are in Minitab
and are set up properly
for analysis. In the next chapter, you adjust the Minitab defaults
to expedite future
shipping data analyses.
Meet Minitab
8-11
Chapter 8 What's Next
8-12 Meet
Minitab
9
Customizing Minitab
Objectives
59. In this chapter, you:
[] Change default options for graphs, page 9-2
! Create a new toolbar, page 9-3
[] Add commands to a custom toolbar, page 9-4
[] Assign shortcut keys for a menu command, page 9-ÿ
u Restore your Minitab default settings using Manage Profiles,
page 9-7
Overview
Minitab has several tools for changing default options or
ereating custom tools such
as individualized toolbars or keyboard shortcuts.
Use Tools ÿ Options to change defaults for:
B Program settings (memory usage, initial directory, window
layout, and dialog box)
[] Data and Session windows
[] Statistical commands
[] Graphs
Use Tools ÿ Customize to:
[] Assign a shortcut key to a menu item
[] Set options for how Minitab displays tooibars
[] Create custom icons for menu items or toolbar buttons
60. Now that you have completed your first book shipment analysis
and generated a
report, you decide to use Tools ÿ- Options and Tools ÿ-
Customize to tailor the
Minitab environment to make future analyses quicker and
easier.
Meet Minitab
9-1
Chapter 9 Setting Options
Setting Options
You can change many options during a Minitab session, such as
changing graph
display settings or enabling the session command prompt.
However, when you exit
Minitab, these options revert back to the defaults for future
Minitab sessions.
If you want a setting to be your default for all Minitab sessions,
use Tools ÿ Options.
Settings that you change remain active until you change them
again.
Because you are planning to do similar analyses on the shipping
data during the next
few months, you want to change your default preferences.
.... ,ÿ J If you change options, you can restore Minitab's
default settings at any time. For more
information, see Restoring Minitab's Default Settings on page 9-
6.
61. Add
automatic
footnote
Because you will create the same graphs with similar data in the
future, you need a
way to distinguish the results of each analysis. You decide to
add an automatic
footnote to your graphs to include the worksheet name, last
modification date, and
some information on the data used.
1 If continuing from the previous chapter, choose File ÿ New,
then choose
Minitab Project and click OK. Otherwise, just start Minitab.
2
3
4
Choose File ÿ Open Worksheet.
Click Look in Minitab Sample Data folder, near the bottom of
the dialog box.
In the Sample Data folder, double-click Meet Minitab, then
choose
ShippingData.MTW. Click Open.
Choose Tools
Options ÿ Graphics
Annotation ÿ My
62. Footnote.
Under Information to
include in my
footnote, check
Worksheet name and
Date the graph was
last modified.
In Custom text, type
Shipping center
efficiency. Click OK.
? ReCÿas
+ Frame ELÿs
+ Data ÿ¢ÿ
Data ÿ Wth Ca ¢ÿ.ÿs
- aanot €:lon
s
5utÿdes
FoOÿes
Lÿ
aÿars
Text
Data Label Aÿtributes
Daÿa Label Font
LeOÿ'd attra:utes
teOÿad ÿ=orÿ
T-=bÿ attraÿes
Tÿ Font
63. 1- OoJÿt nanÿe
[" Iÿ the ÿ-ÿOh ÿaÿ last rÿffÿd
C tÿtom textt [ÿ cerÿer effiderÿ
With these settings, every time you create a graph, Minitab adds
the automatic
footnote.
9-2 Meet
Minitab
Creating a Custom Toolbar Customizing Minitab
Create a
histogram to
view footnote
To see an example of the automatic footnote, create a
histogram.
1 Choose Graph )- Histogram.
2 Choose With Fit and Groups, then click OK.
3 In Graph variables, enter Days.
4 In Categorical variables for grouping (0-3), enter Center.
5 Click OK.
Histogram of Days
64. Normal
0.4
0,3
0.2
0.1
Automatic
footnote
0,0
1 2 3 4 5 6 7
Days
Worksheet: ShtpplngData.NTW; 3/4/2009; Shipping tenor
eÿclency
Create a
toolbar
Creating a Custom Toolbar
In addition to saving time by changing the default options
settings for individual
commands, you also can save time in future Minitab sessions by
using Tools
Customize.
Use Customize to create new menus and toolbars that contain
only the commands
you choose to add, and to assign keyboard shortcuts to
commands that you access
frequently.
65. During some analyses, you return to the same menu items many
times. Combining
these items on a single custom toolbar can simplify future
analysis.
Create a custom toolbar that includes some of the commands
used in the shipping
center analysis.
Meet Minitab
9-3
Chapter 9 Creating a Custom Toolbar
1 Choose Tools ÿ Customize.
2 Click the Toolbars tab.
3 Click New.
4 In Toolbar Name, type Shipping Data.
Click OK.
Factorbt tÿ
A new blank toolbar labeled
Shipping Data appears under
Toolbars, and the new toolbar
name appears in the toolbar
list.
Blank
toolbar
66. New
toolbar
name
cÿ
................... J
_ Prolect Managat
I/ ÿ Sta,ÿdaÿd L2dÿ I
BTÿDÿ
Worbheet
F _shÿ text lab,s
N
Add
commands to
the toolbar
Add commands to the blank toolbar. In the shipping center
analysis, you used Graph
Histogram and Graph ÿ Scatterplot, so you want to add these
commands to a
toolbar.
Click and drag the blank toolbar off
the Customize dialog box.
9-4 Meet
Minitab
67. Assigning Shortcut Keys Customizing Minitab
2
3
4
Click the Commands tab.
Under Categories, choose Graph.
Under Commands, choose Histogram.
6
7
5
Under Categories is a list of all Minitab
menus. When you select one of these
menus, a list of corresponding menu
items appears under Commands.
Click and drag Histogram to the new
toolbar.
Under Commands, choose
Scatterplot.
Click and drag Scatterplot to the new
toolbar.
68. Click Close.
N
Histogram Scatterplot
You ean add any number of commands until you have a custom
toolbar that includes
all your frequently used commands, To access the new toolbar
items quickly from the
keyboard, assign keyboard shortcuts.
Eÿ ] You also can create a custom menu. For more information
on Tools ÿ Customize, go toI Customize in the Minitab Help
index.
Assign a
shortcut key
Assigning Shortcut Keys
Minitab already contains many shortcut keys for frequently used
functions such as
Copy ([Ctrl]+[C]), Paste ([Ctrl]+[V]), and Save As ([Ctrl]+[S]).
Shortcut keys
enable you to quickly bypass the menus and open dialog boxes.
To assign shortcut keys, use Tools ÿ Customize ÿ Keyboard.
Because you often create histograms for your shipping data
analysis, you want to
assign a shortcut key for this command.
Meet Minitab
9-5
69. Chapter 9 Restoring Minitab's Default Settings
1
2
3
Choose Tools ÿ Customize.
Click the Keyboard tab.
From Category, choose Graph.
Category provides a list of all Minitab
menus. When you select one of these
menus, a list of corresponding menu
items appears under Commands.
cÿnÿeÿmdÿ: cÿrent Keys:
alClX:,../ " I
Ness ÿew 5hÿtoÿ Key:
l
4
5
6
70. Under Commands, choose Histogram.
Press [Ctrl]+[Shift]+[H].
Under Press New Shortcut Key, the
Assigned to text displays the current
status of the selected key combination.
In this case, the text reads
[Unassigned]. Keys or key
combinations that are already assigned
to a command are indicated here. Any
existing combination that conflicts with
your choice must be removed from its
command before it can be assigned to a
new command.
Click in Press New Shortcut Key.
aÿ Fÿoÿanÿ
N
[Iÿlealcÿ.,,ÿxdÿt"" .... ÿ: 1"
I ctd+51fft+H
aed toÿ
praw hlsteqÿnÿ
Close
7 Click Assign, The new shortcut key appears under Current
Keys.
71. 8 Click Close.
You can now access the Histogram gallery by pressing
[Ctrl]+[Shift]+[H].
@ [ For a list of Minitab's default shortcut keys, choose Help ÿ
Keyboard Map or go to ShortcutI keys in the Minitab Help
index.
Restoring Minitab's Default Settings
Any settings you change using Tools 1,- Options and Tools ÿ
Customize, as well as
any changes you have made to date/time data settings or value
order settings, are
stored in a profile. You can activate and deactivate this profile
(and remove all these
settings) using Tools ÿ- Manage Profiles. You also can export
and share this profile
with other users who are doing a similar analysis.
All settings that you have adjusted while working through Meet
Minitah are already
stored in your active profile. Deactivate the current profile to
restore Minitab's
9-6 Meet
Minitab
What's Next Customizing Minitab
default settings and change the name of the profile to use for
future shipping center
analyses.
72. @ For more information on managing profiles, go to Manage
Profiles in the Minitab Help index.
Restore
defaults
1 Choose Tools ÿ Manage Profiles.
2 Click _5_] to move MyProfile from Active profiles to
Available profiles.
3 Double-click MyProfiIe in Available profiles, then type
ShippingCenterAnalysis.
4 Click OK.
The default settings are now restored. Minitab creates a new
active profile to store
any changes you make after this point.
To activate the settings you adjusted during your Meet Minitab
sessions, move the
current active profile to Available profiles, move
ShippingCenterAnalysis to Active
profiles, then click OK.
You also can reset Minitab's defaults by double-clicking the
shortcut named
Restore Minitab Defaults English located in the Engtish folder
under the main Minitab 1 6 folder
installed on your hard drive. Export any profiles you want to
keep before running this program.
Save project Save all of your work in a Minitab project.
73. 1 Choose File ÿ,- Save Project As.
2 Navigate to the folder in which you want to save your files.
3 In File name, type My_Customize.MPJ.
4 Click Save.
What's Next
Your analysis is complete, but what do you do if you have
questions or want more
information about a topic? The next chapter suggests ways to
get answers to your
Minitab questions and provides details about how to use
Minitab Help and
StatGuide.
Meet Minitab
9-7
Chapter 9 What's Next
9-8 Meet
Minitab
10
Getting Help
Objectives
In this chapter, you:
74. m Get answers and find information, page 10-2
i Use Minitab Help, page 10-6
m Use Minitab StatGuide, page 10-8
[] Use Session Command Help, page 10-10
Overview
If you find yourself with unanswered questions or discover that
you need more details
about a topic, Minitab can help.
From assistance with completing a dialog box, to guidance for
statistical
interpretations, to instructions for using session commands in
your analysis,
Minitab's easy-to-use online documentation and Internet
resources can help you
find the answers you need.
This chapter discusses using Help, StatGuide, and Session
Command Help to
explore Minitab and suggests ways to find answers to your
Minitab questions.
Meet Minitab
10-1
Chapter 10 Getting Answers and Information
Getting Answers and Information
Meet Minitab focused on only a few of Minitab's commonly
used features. For
75. details about other commands, functions, and statistical
concepts, explore Minitab's
documentation and online resources.
Resource
Help
Description Access
Documentation on Minitab m Click Help in any dialog box.
features and concepts. = Click [] on the toolbar.
Includes information on:
m Press [F1] at any time.
[] Menus and dialog boxes
[] Choose Help ÿ Help.
[] Methods and formulas
See Help on page 10-6 for more
[] Session commands information.
[] Macros
Using General information on Choose Help ÿ Help, then
click
Help navigating Minitab Help. Using Help under Basics,
StatGuide Statistical guidance that [] Right-click in the
Session window
focuses on interpretation of or a Graph window, then choose
sample results. StatGuide.
[] Right-click in the Session or Graph
folder of the Project Manager,
76. then choose StatGuide.
[] Click ÿ on the toolbar.
m Press [Shift]+[F1].
m Choose Help ÿ StatGuide.
See StatGuide on page 10-8 for more
information.
Minitab
Statistical
Glossary
This comprehensive glossary
covers all areas of Minitab
statistics. Each definition
contains practical,
easy-to-understand
information.
Choose Help ÿ Glossary.
Tutorials Tutorials show you how to use
different analyses in your own
Minitab sessions, and include
easy-to-understand data
requirements and step-by-step
examples.
Choose Help ÿ Tutorials.
10-2 Meet
Minitab
77. Getting Answers and Information Getting Help
Resource Description Access
Session [] Choose Help ÿ Help, then click
Command Session Commands under
Help References.
[] At the MTB > prompt in the
Session window, type HELP.
[] To access information on a specific
session command, at the MTB >
prompt in the Session window,
type HELP followed by a
command.
Documentation on Minitab
session commands, which you
can use interactively or to
create a macro.
Macros
Help
See Session Command Help on page
10-10 for more information.
Support for writing and Choose Help ÿ Help, then click
executing Minitab macros, Macros under References.
with commands stored in text
files.
What's Information about new Go to www.minitab.com,
New features in Minitab 16.
78. ReadMe Late-breaking information on Go to
www.minitab.com.
this release of Minitab,
including details on changes
to the software or
documentation.
Please send comments about Minitab's online and print
documentation to
[email protected]
Meet Minitab
10-3
Chapter 10 Minitab Help Overview
Minitab Help Overview
The components of Minitab's online documentation--as well as
other related
information--are summarized on a single page. From this page,
you can proceed to
detailed assistance, instructions, and support topics. This
overview organizes links to
Help topics according to Minitab's menu structure.
Finding
information
To display the overview page:
[] Choose Help ÿ Help.
79. [] Press IF1].
m Click [ÿ] on the Standard toolbar.
The links provided under the headings shown below make
finding information quick
and easy:
m Basics--how to use Help, guidelines and tutorials for getting
started with
Minitab, and descriptions of Minitab windows
m References--examples of commands, glossary of terms and
abbreviations,
instructions for using session commands and macros, and the
methods and
formulas used by Minitab
[] Service and Support--how to register Minitab, ways to
communicate with
Technical Support, and descriptions of Minitab's
documentation, Interact
resources, and other products
10-4 Meet
Minitab
Minitab Help Overview Getting Help
Y
Minitab Help /
Basics ,ÿ :3ÿe P,ÿeÿ
80. intro to tAinÿtab ÿ + Open end save r,ÿs
Tubrmb i+ Print flies
Use these links to access basic facts,
reference material, and service 'and
support information.
&tmÿab Windows
+ And more...
Ediÿ Pÿenu
+ Undo and redo actions
Cut, copy, end paste
!+ And m0re...
Caÿc P,ÿenÿ Star ÿ,ÿenÿ :
i+ CsleuSatestatlstics i RegresstonandAUOVA i:+
Seatterptots
+ Generatedatafrorna i.+ Controlchartsandquaf,,tyl;+
Barcharts
distribution ÿ tools i, Andmore...
,* Andmore... ,ÿ* Andmore... i,
Editor ÿ.enu
i
[* Graph, Data, and
[ Session window
' [ edtdng
Ser-Jice arÿ Support i
81. [+ l,t Odify active v,'mdo v,'
Documentatmn
[+ And more...
t+thqÿab orÿ the Web
Other Preductÿ
op_9_ÿ i, Searchabÿ Help
User Reqÿtratÿ + StatGuÿle add more...
Sessbn Corr.m,B n dÿ
I,ÿinffab Autemaÿioq
References
hlacreÿ
/
Data P,ÿen_____._uu /
* Subset and merge
worksheÿs
o StaCk ¢obmna
And more...
ChangelAinÿab defauRs ', .+ Arrange v,,indov,,s
* Create and modify * Select active window
toobars and menus • And more...
• And more...
82. Click a menu link
/to view Help topics
for all commands
on that menu.
Eÿ I For more information about the Minitab Help
environment, choose Help ÿ Help, then clickI Using Help under
Basics.
Meet Minitab
10-5
Chapter 10 Help
Help
Minitab Help is a comprehensive, convenient source of
information that includes
menu and dialog box instructions, overviews, examples,
guidance for setting up your
data, and methods and formulas. You can explore Minitab's
statistical features and
discover new methods for routine tasks. Help also provides
guidance on using
Minitab's statistics, quality control, reliability and survival
analysis, and design of
experiments tools.
Additionally, in Help, you can learn about the Minitab
environment; using session
commands; writing macros and Execs; Minitah's input, output,
and data
83. manipulation capabilities; and working with data and graphs.
Finding
information
Most Help topics appear in a window that consists of three
areas:
= Toolbar--contains buttons for hiding and showing the
navigation pane, returning
to a previous topic, printing one or more topics, and tools for
working within the
Help environment
= Navigation pane--provides three tabs for exploring the table
of contents and
index, and searching for words or phrases
[] Topic pane--displays the selected Help topic
Toolbar Topic pane
Navigation pane
= Contents--Click ahy.
folder or topic for
more information.
[] Index--Search the
index for a term, or
scroll through the
list.
,ÿ Search--Search the
Help for specific
84. words or phrases.
Hide Back , ,ÿ Pÿ 0ÿ
,ÿ ÿ Operÿ Save. and PrÿR F/es
t- !,L1 stations
. ÿ Ba${oSta6si6cÿ
l sÿ
Lÿ Data requÿements
Lÿ Exan'4ÿe, ÿ legreÿ
To peÿfctm • Iaear teg
Refetenceÿ
÷: ÿ DiÿpÿGraphÿ
+ ÿ Reÿ
+ ! GeaeraÿFleÿeÿskÿl
• Stepÿe Rÿesÿn
+ Fÿted Liÿ pÿ,
+ OiLI'ÿgor N Reÿeiÿ
+; PaÿLeaÿtSÿesÿPLSÿl
+ Nÿr;rÿl Le;;ÿ6o R eÿ e ÿ
Regression
St=t> Regression> Regression
Yoÿ cÿn use ReQressÿ to perfoÿ sÿPÿ lad rrÿ ÿ USÿg
srÿ Use thIÿ procedure for fÿtrngpeneraiÿ ÿodÿ,
85. $tonag rÿgressk)n slatÿtÿs, exÿg ÿnÿ cÿ, generatng
poÿt estÿ=tet, . and
If you want to fÿ a £ÿ_. ÿ2ÿ wÿh a sÿg'ÿ ÿ.gZ,
you nay fÿRI ÿ ÿpÿr to use r.ÿ*ÿ Lnÿ Pÿ;.
Ifyotl hÿve €ÿIeÿOrÿCSl prediCXorÿ, U= e Gÿ ,eÿ .ÿ ÿ,, which
doÿ
not requ% yoe to creÿe ÿ,,dÿ arÿL ÿ:ÿcÿ'ÿ s, It ÿ aÿo e as ÿr to
fÿ
poÿnonÿal modeÿ ÿnd rrÿdeÿ wÿh ÿlteraÿoo S wÿh Oenÿral
Repressÿn
cauÿe you do not need to create new coÿ s in tÿe worksheet
Dlafog box items
Reÿponÿe: Select the €oÿunÿ €ont,ÿli,lg the Y, or ÿLÿ_ÿ
predictors; Senti ÿe coluÿl(ÿ) cont=tnÿnp the X, oÿ pÿ2ÿ -ÿo r
wÿ
.ÿ
10-6 Meet
Minitab
Help Getting Help
Command-
specific
information
You can access command-specific assistance from within
Minitab dialog boxes by
clicking Help in the dialog box or pressing IF1]. Help suggests
ways to complete the
86. dialog box and encourages a thorough understanding of the task
by supplying links to
related topics and associated commands.
Most main dialog box topics contain the following links:
= Overview of subject area, including information such as why
a certain method is
useful and how to choose which method to use
= How to instructions on completing the dialog box
= Example of using the command, ineluding output and
interpretation
[] Data requirements that explain how you should arrange the
data in the worksheet
and what data types you can analyze with that command
[] See also links to related topics and commands, including
methods and formulas
Hidÿ Back ÿ ÿ Prÿ ÿ=
Open, Save, arid Prÿ Fÿs
+ Data vÿrÿ'KJow and S esÿon Wÿ
' Negate aÿ Cÿat ÿ Data
Baÿc 5tabÿ6cs
÷ ÿ Oveÿ,ew
Data Eÿ'q*,ÿemenlÿ
?ÿ To perform a &ÿeal ,eg
1/] Refee.raeÿ
87. ,ÿ-ÿ Oiÿpÿ,Gr,ÿpÿ
+; ÿ= PIeciÿtlon. Op6ond Teÿls,
+ÿ Iÿ Ger, eÿa] Regÿeÿioo
+ÿ StefÿeRegÿeÿioÿ
+ Beat Suÿatÿ Regteÿn
+; Fÿted ÿ Pot
'+ N0erÿaÿ Rea#eÿoa
+ ÿ Pÿ Least SÿNaÿeI ÿPLS)
+, ÿ Binaÿ Logisÿ Regÿessbn
+: ÿ Ozÿ Lÿs6c Regreÿlioÿ
Regression
Stat > Regression > Regression /
You cÿ use Rÿgÿes$lsn to perform s'mÿ and rruÿ reÿ uÿgÿ
Use thÿ prOCedure for fÿdÿn g generaÿ ÿuÿ ¢ÿdeÿ
storÿg regression =ÿ=ÿtÿS, exarrÿla9 ÿgsÿ. generÿg
poÿt estates, , and
per forrÿlg ÿ:ÿtÿ,
you waÿt to rt a ÿessÿ ÿ-ÿ wÿ a sÿlgÿ ÿ,
If you have ¢atego{l¢ÿl predÿors, use ÿ, whÿh does
not requÿe you to uÿte C-ÿaÿr wa'ÿ ÿ ÿ also ea sÿer to ft
po f,/n ofr/ÿl/modeÿ arid moqeÿ wth 61teractÿis wÿ General
Regcessÿn
¢ÿuse yoÿ do not need to create new coÿmns ÿ the WorksheeL )
DlatOg box items
Respoÿse; Seÿct the cobtr.1 contaÿ the Y, or ÿnÿe va,ÿbÿ.
Pred,ctoÿs: Select the cobÿ(i ) COntaÿlÿ the X, or 2.L=,ÿ_.Eÿr
ÿa, ÿt,ÿ
88. ,e_,rÿot, s=
Where you can find this
command in the
Minitab menu
Explanation of
-- command
Explanation of each
dialog box item
Links to subdialog box
information
Meet Minitab
10-7
Chapter 10 StatGuide
StatGuide
The Minitab StatGuide explains how to interpret statistical
tables and graphs in a
practical, easy-to-understand way. Unlike Help, which provides
guidance for using
Minitab, the StatGuide focuses on the interpretation of Minitab
results, using
preselected examples to explain the output.
StatGuide topics include information such as:
[] Real-life data analysis situations
[] Brief summaries of statistical capabilities
89. [] Emphasis on important components of the output
Finding
information
After you issue a command, you can learn more about the output
by examining
StatGuide's example output and interpretation. The StatGuide
provides a direct
path to command-specific guidance:
[] Right-click in the Session window output or on a graph, then
choose StatGuide.
[] Click in the Session window output or on a graph, then eli&
[] on the toolbar or
press [Shift]+[F1].
In the Project Manager, click the name of the Session window
output or graph,
then click [ÿ1 on the toolbar or press [Shift]+[F1]. You can also
right-click the
Session window or graph output name, then choose StatGuide.
You can also access the StatGuide by choosing Help 1.-
StatGuide. To locate specific
words or phrases, choose Help ÿ- StatGuide, then click the
Search tab.
10-8 Meet
Minitab
StatGuide Getting Help
90. Command-
specific
information
Each topic in the StatGuide provides interpretation for a part of
the Session window
output or graph and includes the following sections:
i The first section directly below the main heading contains
general guidance on
interpreting the output or graph.
[] The Example Output section contains the output or graph.
[] The Interpretation section contains specific interpretation for
the output or graph
shown in the topic.
Browse all StatGuide topics
for a command.
- ÿ One-WÿyAnOVA ÿ {ÿ
,-ÿ ÿsÿovA
T utÿ'ÿ rrÿxÿd
Dtrrÿt's rxÿ,-kÿ ÿ a c
Hÿogÿ,-ÿ of teÿUuÿ*
7ÿReÿ v*rÿuÿ mÿ
I ?ÿ Fÿ-nÿnÿteÿveJpÿl
91. 1
Lists available topics for each
command and shows your
location within the StatGuide.
Infÿrÿ
f tÿe ÿ ÿ fvr tÿ•, ÿ mÿnÿ #ÿ nÿt vveÿ, ÿ ÿuÿ ÿtÿ tÿt tÿ ÿtÿ tÿ ÿre
ÿrÿt
YOU ÿhÿu'4 ÿrÿrÿ thÿ sÿ ÿtÿrÿ v,¸ÿ ¢ÿ.nn, ÿ,,'ÿvÿr, ÿ ÿ yÿ.." tÿ
ÿtjL.-ÿrÿ
+ ......... + ......... + ......... + .........
+ ......... + ......... + ......... + .........
5.0 to.o zs.o ÿ0.o
Display a list of all
StatGuide topics for a
command.
Read a description of
the data used in the
example output.
-- View in-depth content
for more information
about the analysis.
(
Meet Minitab
10-9
92. Chapter 10 Session Command Help
Session Command Help
In addition to using Minitab's menus and dialog boxes, you can
also conduct
analyses, generate graphs, and manipulate data using session
commands. Each
Minitab menu command has a corresponding session command,
which consists of a
main command and, usually, one or more subeommands. Session
commands are
especially useful because they can be used to create macros,
which are session
commands stored in a text file. Macros can help automate
repeated tasks. See Help
Help, then click Macros under References for more information
about how to
write Execs and macros.
Finding
information
To access Minitab Session Command Help, choose Help * Help,
then dick
Session Commands under References.
The Session Command Help environment is similar to Minitab
Help. The toolbar,
navigation pane, and topic pane provide the necessary tools for
learning and using
session commands.
Session Command Help
93. The functÿnÿtcy of LIÿab is =cceÿ sÿ through ÿteÿacts,,e w
ÿdowÿ and n'eaus, or through = cÿmÿand
tingua;e caÿL=d seÿoÿ €oÿ'ÿrÿ. You can use sessÿn co n'ÿmand
s a5 aÿ aÿematÿ,'e to usÿg rrÿ.nu
¢ÿmaÿdÿ. or a= a way to bÿd rÿcr0g for repetÿe fusions.
Instÿcttons
n ( ÿLÿ=ÿ_rl ÿ - ffÿw to use the cÿnds, rum= to forow, corÿaÿd
syntÿ, subcÿrÿandÿ+
aÿrf arÿuÿnts
9ÿc= cÿ-ÿand. ÿ-
HÿvltoÿsetÿecÿrwÿnÿJÿ,ÿeÿfferenttyÿeÿ,rusestofoÿow,
forÿ'*ÿlsÿnÿ
View these topics for
instructions on how to use
session commands and macros.
Command ListJllgs
Jÿ - seÿ sÿon conwÿnÿ [sted by functÿn
View these topics for lists of
commands and macros.
I To learn more about session commands, go to Chapter 6,
Using Session Commands.
I
10-10 Meet
Minitab
94. What's Next Getting Help
Command-
specific
information
To access information for a specific session command, at the
MTB > command
prompt, type HELP followed by the command name. Press
[Enter].
3/4/2009 8:t 8::30 PM
elcoiÿe to IIlnltab, pÿess F1 for help.
> EELp GS"JÿY
Most session command topics contain links to:
[] Example of using the command, including output.
[] See also links to related topics.
I#ote oso LIIÿARY reÿcel %DESERVE.
Stai > BÿsI¢ $(atlstt¢¢ > Graphical Summÿry
Command Synlax
GSUMMARY C. c
Y Lhÿtÿ thÿ cÿ1ÿ that ¢ontÿn thÿ ÿroupÿ ;I varÿbÿ
E ÿ $pÿ¢lfes a confÿeace ÿvei K for thÿ ¢onÿaÿ ÿtÿrvÿ1
Subcomrÿandÿ
COI(RDEIICE Speckles a confÿenÿ ÿvel for the €ÿn fÿen¢ÿ
intervaL K €ÿn be ÿny number
bÿtween l ÿ 100. For ÿxarÿOÿ, if you eater K = ÿ0, ÿ ÿab ÿUÿ a
ÿ0%
95. ¢ÿnrÿncÿ ÿtervat If you do not speedy ÿ conÿence ÿvÿL Mÿab
gÿ
%5% coÿfÿence ÿervÿL
Location of the
J corresponding command
in the Minitab menu.
Command syntax. Click a
subcommand to access
more detailed information.
Explanation of the
command.
-- Detailed information about
subcommands.
Storel the conBÿnce ÿlewa( for lhÿ Itÿndÿr(l dÿvÿtÿn in C ÿnd
C.
SMCOIIF C C
$SCOI(F C C
What's Next
In the next chapter, ]earn more about the Minitab environment
and the types and
forms of data that Minitab uses. The chapter also includes a list
of quick-reference
tables of actions and analyses available in Minitab.
Meet Minitab 10-11
96. Chapter 10 What's Next
10ÿ12 Meet
Minitab
11
Reference
Objectives
In this chapter, you find information about:
[] Minitab environment, page 11-2
[] Minitab data, page 11-5
Overview
Previous Meet Minitab chapters introduced you to Minitab and
some of its features
and commands. This ehapter provides in-depth information
about the Minitab
environment and data, as well as quick-reference tables to help
you to perform the
actions and statistics you need in your own analysis.
(
Meet Minitab
11-1
Chapter 11 The Minitab Environment
97. The Minitab Environment
As you perform your data analysis, you will work with many
different Minitab
windows and tools Here is a brief overview of the Minitab
environment:
Toolbars
Menu bar --
Session
window
Data /
windows
Status bar
Project
Manager
Minitab
windows
,, The Session window displays text output such as tables of
statistics. You can
display columns, constants, and matrices in this window by
choosing Data
Display Data.
[] Data windows contain columns and rows of cells in which
you enter, edit, and
view the data for each worksheet.
98. Graph windows display graphs You can have up to 200 Graph
windows open at a
time
11-2 Meet
Minitab
The Minitab Environment Reference
Project
Manager
Folders
Contents l--
of the open
folder
My Raports,MPJ
tÿ Session
.ÿ History
CI Greÿs
C.ÿ RepÿtPad
(ÿ1 Related Documents
:-; I,.ÿ Worksheets
,-; ÿ ShipptngData,mtw
{"71 columns
:1 Constants
Lÿ Matrices
99. iJ
Session I worlÿheet
::::--ÿ5ÿ-iÿ,ÿiÿÿ-:c:-:ÿ7-::D shÿppÿnooao,mtÿ
[]Histogram of Days shipplngData,mtw
[] Descriptive Statisticsÿ Days ShipplngData,mtw
[] Results for Center = Central ShippLqcjData,mZw
[] ResUlts for Center = Eastern SNpplngData,ratw
lResu[ts for Center = Western ShippingData.lÿtw
[] ..... 3/9/2009 3;56;1J PM .................... ShippingData.rntw
[] Individual Value Plot oF Days ShtpffÿgData,ratw
The Project Manager contains folders that allow you to
navigate, view, and
manipulate various parts of your project. By right-clicking
either the folders or the
folder contents, you can access a variety of menus that allow
you to manage Session
window output, graphs, worksheets, command language, and
related project areas.
This folder... Contains... Use to...
Session A list of:
[] All Session window
output by command
[] All graphs
Manage Session window output. For
example:
100. [] Jump to Session window output
,, Copy, delete, rename, or print
Session window output or graphs
[] Append Session window output or
graphs to the ReportPad
History All commands you have
used
= Repeat complex command
sequences
[] Use commands to create Execs and
macros
Graph A list of all graphs in
your project
Manage your graphs. For example:
[] Arrange, rename, tile, or remove
your graphs
[] Append graphs to the ReportPad
Meet Minitab
11-3
Chapter 11 The Minitab Environment
This folder... Contains... Use to...
101. ReportPad A basic word processing m Create, arrange, or
edit reports of
tool project work
[] Move ReportPad contents to a
more powerful word processing
program for further editing and
layout
Related
Documents
A list of program files,
documents, or Internet
URLs that are related to
your Minitab project
Quickly access project-related,
non-Minitab files for easy reference
Worksheets The Columns,
Constants, and
Matrices, and Design
folders for each open
worksheet
View summaries of worksheet
information, including:
[] Column counts, missing values,
and column descriptions
,, Constants
[] Matrices
102. i Design summary
Menus and
tools
Minitab provides:
[] A menu bar for choosing commands.
m A Standard toolbar with buttons for commonly used
functions4he buttons
change depending on which Minitab window is active.
[] A Project Manager toolbar with shortcuts to Proiect Manager
folders.
[] A Worksheet toolbar with buttons to insert or clear cells,
rows, and columns, to
move columns, and to move to the next or previous brushed
row.
[] A status bar which displays explanatory text when you are
pointing to a menu
item or toolbar button.
[] Shortcut menus which appear when you right-click in any
Minitab window or
any folder in the Proiect Manager. The menu displays the most
commonly-used
functions for that window or folder.
[] Graph editing toolbars (Graph Editing, Graph Annotation
Tools, and 3D
Graph Tools) with buttons for adding and changing graph
elements.
103. [] DOE toolbars (Factorial Designs, Response Surface Designs,
Mixture Designs,
Taguehi Designs, and OptiPlot) with buttons for DOE functions.
11-4 Meet
Minitab
Minitab Data Reference
B DMAIC toolbar which organizes the statistical tools used to
implement Six Sigma
according to the DMAIC roadmap (Define, Measure,
Analyze, Improve, and Control ).
,ÿ:"ÿ l The Graph Editing, DOE, and DMAIC toolbars are not
visible at start-up, but can be opened by
I choosing Tools ÿ Toolbars and clicking the toolbars you want
to show.
Minitab Data
In Minitab, data are contained in a worksheet. The number
ofworksheets a project
can have is limited only by your computer's memory.
Data types A worksheet can contain three types of data:
[] Numeric data -Numbers.
[] Text data -Letters, numbers, spaces, and special characters.
For example, Test #4
104. or North America.
[] Date/time data -Dates (such as Jan-l-2009, lqan-2009,
3/17/09, or 17/03/09),
times (such as 08:25:22 AM), or both (such as 3/i7/09 08:25:22
AM or 17/03/09
08:25:22). Minitab internally stores dates and times as numbers,
but displays them
in the format you choose.
Forms of data Data can be in one of three forms:
Form Contains... Referred to by... Number available
Column Numeric, text, or [] C + number, as in C1 Limited
only by
date/time data or C22 computer memory,
[] Column name, such up to a maximum of
as Center or Arrival 4000
Stored A single number or [] K + number, as in I000
Constant text string (for K1or K93
example, New York) [] Column name, such
as First or Counter
Matrix A rectangular block [] M + number, as in 100
of cells containing M1 or M44
numbers [] Column name, such
as Inverse
The Project Manager Worksheets folder contains a list of the
columns, constants,
105. and matrices in each project.
I Meet Minitab
11-5
Chapter 11 Minitab Data
Sample
data sets
Minitab comes with a number of sample data sets. The data sets
used in Meet
Minitab are located in the Meet Minitab folder. You can easily
access the sample
data sets by clicking Look in Minitab Sample Data folder near
the bottom of the
Open Worksheet dialog box. For complete descriptions of most
of these data sets, go
to Sample data sets in the Minitab Help index.
11-6 Meet
Minitab
Index
Numerics
3D Graph Tools toolbar 11-4
A
adding data to a worksheet 4-5
106. analysis of variance 3-4
Tukey's multiple comparison
test 3-4
analyzing data 3-1
annotating graph layout 2-13
annotation, automatic 9-2
ANOVA
see analysis of variance
Append to Report 7-2
arithmetic functions
see Calculator
arrow, data entry 4-5
assessing quality 4-1
assign formulas to a column 8-9
Autofill 4-5
automatic footnote, creating 9-2
automating an analysis 6-7
B
boxplots of data 3-5
built-in graphs 2-1, 3-1
generating 3-5
107. C
calculate formulas 8-9
Calculator 8-9
capability analysis 4-8
center line 4-2
interpreting 4-8
changing defaults 9-2
coding data 8-8
columns 1-5, 11-5
assigning formulas 8-9
inserting 8-9
naming 8-8
number 1-5
stacking 8-6
Command Line Editor 6-5
command prompt 6-2
confidence intervals 3-6
constants I i-5
control charts 4-2
adding reference line 4-7
setting options 4-3
subgroups 4-3
updating 4-6
control limit 4-2
108. Copy to Word Processor 7-7
Cpm value, interpreting 4-10
custom toolbars, creating 9-3
customizing Minitab 9-1
date/time 11-5
forms 11-5
merging 8-3, 8-4
numeric 11-5
replacing 8-8
stacking 8-6
text I i-5
types 1-5, 11-5
data entry arrow 4-5
data folder, setting default 1-5
data sets, sample t 1-6
Data window 1-3
date/time data 11-5
default settings
changing 9-2
data folder 1-5
graphs 2-6
restoring 9-2, 9-6
descriptive statistics, displaying 3-2
109. design of experiments (DOE) 5-1
Display Descriptive Statistics 3-2
DMAIC toolbar 11-5
DOE 5-1
E
D
adding to a worksheet 4-5
analyzing 3-i
coding 8-8
data
editing graphs 2-5
editing in ReportPad 7-5
editing tools for graphs 7-7
effects plots 5-8
Embedded Graph Editor 7-7
environment, in Minitab 11-2
Excel, merging data into worksheet
8-3
Exec file 6-6
experimental designs 5-1
Meet Minitab
I-1
110. F G I
factorial designs 5-1
analyzing 5-6
creating 5-2
effects plots 5-8
entering data 5-5
fitting a model 5-6
interaction plot 5-9
main effects plot 5-9
naming factors 5-3
randomizing run order 5-4
selecting 5-2
Factorial Designs toolbar 11-4
factorial plots 5-9
files
HTML format 7-6
merging 8-3, 8-4
MPJ file type 2-14
MTB file type 6-7
MTW file type 8-2
opening a worksheet 8-2
RTF format 7-6, 7-7
saving projects 2-13
text 8-4
types used by Minitab 8-2
XLS format 8-3
folder
Graph l 1-3
History 6-5, 11-3
Related Documents 11-4
111. ReportPad 7-2, 11-4
Session 11-3
setting default 1-5
Worksheet 11-4
font, changing in ReportPad 7-5
footnote
adding to graphs 2-10
creating automatic 9-2
forms of data 11-5
formula in a column 8-9
four-in-one residual plot 3-8
H
Help 10-1
accessing 2-8, 10-4
command-specific information
10-7
finding information 10-6
overview 10-4
session commands 10-10
StatGuide 10-8
What's New 10-3
histogram
grouped 2-4
grouped, interpreting 2-5
paneled 2-6
History folder 6-5, 11-3
112. HTML file format 7-6
hypothesis testing 3-4
Graph Annotation Tools toolbar
11-4
Graph Editing toolbar 11-4
Graph folder 11-3
Graph windows 11-2
graphing data 2-1
graphs 2-1
adding reference line 4-7
adding to ReportPad 7-2
built-in 2-I, 3-1, 3-5
changing default settings 2-6
editing 2-5, 2-10, 7-8
editing in another application
7-7
embedded editing tools 7-7
gallery 2-2
generating session commands
after editing 6-6
layout tool 2-11
printing 2-13
updating 4-5
viewing 3-10
grouped histogram 2-4
interpreting 2-5
individual value plot 2-2, 3-5
113. interpreting 2-4
information, resources 10-2
inserting a column 8-9
interaction plot 5-9
K
keyboard shortcuts
assigning 9-5
default 9-6
L
layout tool for graphs 2-11
adding annotation 2-13
printing 2-13
M
macros 6-6
main effects plot 5-9
Manage Profiles 9-6
mathematical functions
see Calculator
matrices 11-5
menu bar 11-4
merging files 8-3, 8-4
114. missing values 8-6
mixture designs 5-1
Mixture Designs toolbar 11-4
Move to Word Processor 7-7
MPJ file format 2-14
MTB macro file 6-7
MTW file format 8-2
multiple comparison of means 3-4
interpreting 3-6
StatGuide 3-8
I-2 Meet
Minitab
N
naming columns 8-8
normal distribution 2-2
normal probability plot of effects
5-8
numeric data 11-5
Show Session Folder icon 3-9
toolbar 3-9, 11-4
Worksheet folder 11-4
115. Q
quality 4-1
S
sample data sets 11-6
saving
Execs 6-6
project 2-13
report 7-6
worksheet 8-11
O
one-way ANOVA 3-4, 3-8
opening a worksheet 1-4, 8-2
options
setting for Minitab 9-2
setting for tests for special
causes 4-3
OptiPlot toolbar 11-4
p-value 3-6
paneled histogram 2-6
Pareto chart of effects 5-8
plots
effects 5-8
factorial 5-9
individual value 2-2, 3-5
residual 3-5, 3-7
116. scatterplot 2-9
preparing a worksheet 8-1
previewing a worksheet 8-4
printing 2-13
process capability 4-8
profiles, managing 9-6
project files, saving 2-13
Project Manager 3-8
Graph folder 1 i-3
History folder 6-5, 11-3
Info window 8-5
Related Documents 11-4
ReportPad 7-2, 11-4
Session folder 11-3
Show Graphs icon 3-10
R
randomizing run order 5-4
ReadMe file 10-3
reference line 4-7
Related Documents folder 11-4
repeating an analysis 6-5
replacing values in a worksheet 8-8
replicates 5-3
ReportPad 7-2, 11-4
117. adding graphs 7-2
adding Session window output
7-3
changing font 7-5
editing 7-5
saving contents 7-6
reports
copying to word processor 7-6
saving 7-6
residual plots 3-5
four-in-one 3-8
histogram of the residuals 3-7
normal probability plot 3-7
residuals versus order 3-7
residuals versus the fitted
values 3-7
response surface designs 5-1
Response Surface Designs toolbar
11-4
restoring default settings 9-2, 9-6
rows 1-5
RTF file format 7-6, 7-7
P
scatterplot 2-9
118. editing 2-10
interpreting 2-10
send to Microsoft Word or
PowerPoint 7-9
Session Command Help 10-10
command-specific information
10-11
finding information 10-10
session commands 6-1
enabling 6-2
generating for edited graph 6-6
using 6-1
Session folder 11-3
Session window 1-3, 11-2
adding output to ReportPad
7-3
command prompt 6-2
viewing output 3-3
setting options 9-2
shortcut keys
assigning 9-5
default 9-6
shortcut menus 1 i-4
Show Graphs icon 3-10
119. Show Session Folder icon 3-9
special causes 4-2
specification limits 4-9
stability 4-2
stacking data 8-6
Standard Toolbar 11-4
starting Minitab !-3
StatGuide 10-8
accessing 3-8, 10-8
eommand-specifie information
10-9
finding information 10-8
status bar 11-2, 11-4
Meet Minitab
I-3
stored constants 11-5
subgroups 4-3
subscripts 8-7
120. V
T
variables 1-5
entering in a dialog box 2-3
viewing
graphs 3-10
Session window output 3-3
Taguchi designs 5-1
Taguchi Designs toolbar 11-4
target value 4-7, 4-9
interpreting 4-10
tests for special causes 4-2
setting options 4-3
text
data 11-5
files 8-4
Tukey's multiple comparison test
3-4
interpreting 3-6
StatGuide 3-8
typographical conventions 1-2
time data
see date/time data
121. toolbars 11-2
3D Graph Tools 11-4
creating custom 9-3
DMAIC 11-5
DOE 11-4
Factorial Designs 11-4
Graph Annotation Tools 11-4
Graph Editing 11-4
Mixture Designs 11-4
OptiPlot 11-4
Project Manager 3-9, 11-4
Response Surface Designs
11-4
Standard 11-4
Taguchi Designs 11-4
Worksheet 11-4
W
What's New file 10-3
window
Data 1-3, 11-2
Graph 11-2
Project Manager 11-3
Session 1-3, 11-2
word processor, copy report to a 7-6
worksheet 1-3
adding data 4-5
Autofill 4-5
entering data 4-5
merging data from Excel 8-3
merging data from text file 8-4
opening 1-4, 8-2
123. registered trademarks of Minitab, Inc. in the United States and
other countries. Capability SixpackTM,
Process Capability SixpaekTM, ReportPadTM, and
StatCuideTM are all trademarks of Minitab, Inc.
Six [email protected] is a registered trademark and service mark
of Motorola, Inc. All other marks referenced remain
the property of their respective owners.
Table of Contents
1 Getting Started .............................................. 1-1
Objectives ................................................... 1-1
Overview .................................................... 1-1
Typographical Conventions in this Book .............................
1-2
The Story .................................................... 1-3
Starting Minitab ............................................... 1-3
Opening a Worksheet ........................................... 1-4
What's Next .................................................. 1-6
2 Graphing Data .............................................. 2-1
Objectives ................................................... 2-1
Overview .................................................... 2-1
124. Exploring the Data ............................................. 2-2
Examining Relationships Between Two Variables
....................... 2-8
Using Graph Layout and Printing ................................. 2-11
Saving Projects ............................................... 2-1 3
What's Next ................................................. 2-14
3 Analyzing Data .............................................. 3-1
Objectives ................................................... 3-1
Overview .................................................... 3-1
Displaying Descriptive Statistics ................................... 3-2
Performing an ANOVA .......................................... 3-4
Using Minitab's Project Manager .................................. 3-8
What's Next ................................................. 3-11
4 Assessing Quality ............................................. 4-1
Objectives ................................................... 4-1
Overview .................................................... 4-1
Evaluating Process Stability ....................................... 4-2
Evaluating Process Capability ..................................... 4-8
What's Next ................................................. 4-10
125. iii
Designing an Experiment ..................................... 5-1
Objectives ................................................... 5-1
Overview ................................................... 5-1
Creating an Experimental Design ................................. 5-2
Viewin9 the Design ............................................ 5-5
Enterin9 Data ................................................ 5-5
Analyzing the Design .......................................... 5-6
Drawing Conclusions .......................................... 5-9
What's Next ................................................ 5-12
6 Using Session Commands ..................................... 6-1
Objectives ................................................... 6-1
Overview ................................................... 6-1
Enablin9 and Typing Commands ................................. 6-2
Rerunnin9 a Series of Commands ................................. 6-5
Repeating Analyses with Execs ................................... 6-6
What's Next ................................................. 6-8
126. 7 Generating a Report .......................................... 7-1
Objectives ................................................... 7-1
Overview ................................................... 7-1
Using the ReportPad ........................................... 7-2
Savin9 a Report ............................................... 7-6
Copyin9 a Report to a Word Processor ............................. 7-6
Using Embedded Graph Editin9 Tools .............................. 7-7
Sending Output to Microsoft PowerPoint ........................... 7-
9
What's Next ................................................ 7-11
Preparing a Worksheet ........................................ 8-1
Objectives ................................................... 8-1
Overview ................................................... 8-1
Getting Data from Different Sources ............................... 8-2
Preparing the Worksheet for Analysis ............................... 8-
4
What's Next ................................................ 8-11
iv
127. 9 Customizing Minitab ......................................... %1
Objectives ................................................... 9-1
Overview .................................................... 9-1
Settin9 Options ............................................... 9-2
Creatin9 a Custom Toolbar ...................................... 9-3
Assignin9 Shortcut Keys ......................................... 9-5
Restorin9 Minitab's Default Settings ................................ 9-6
What's Next .................................................. 9-7
10 Getting Help .............................................. 10-1
Objectives .................................................. 10-1
Overview ................................................... 10-1
Gettin9 Answers and Information ................................. ] 0-2
Minitab Help Overview ......................................... 10-4
Help ....................................................... 10-6
StatGuide ................................................... 10-8
Session Command Help ....................................... 10-1 0
What's Next ................................................ 10-11
11 Reference ................................................ 11-1
128. Objectives .................................................. 11-1
Overview ................................................... 11-1
The Minitab Environment ....................................... 11-2
Minitab Data ................................................ 11-5
Index ........................................................ 1-1
vi
1
Getting Started
Objectives
In this chapter, you:
[] Learn how to use Meet Minitah, page 1-1
n Start Minitab, page 1-3
u Open and examine a worksheet, page i-4
Overview
Meet Minitah introduces you to the most commonly used
features in Minitab.
Throughout the book, you use functions, create graphs, and
generate statistics. The
contents of Meet Minitab relate to the actions you need to
perform in your own
129. Minitab sessions. You use a sampling of Minitab's features to
see the range of features
and statistics that Minitab provides.
Most statistical analyses require a series of steps, often directed
by background
knowledge or by the subject area you are investigating.
Chapters 2 through 5
illustrate the analysis steps in a typical Minitab session:
[] Exploring data with graphs
[] Conducting statistical analyses and procedures
I Assessing quality
[] Designing an experiment
Chapters 6 through 9 provide information on:
[] Using shortcuts to automate future analyses
[] Generating a report
[] Preparing worksheets
[] Customizing Minitab to fit your needs
Meet Minitab
1-1
Chapter 1 Typographical Conventions in this Book
130. Chapter 10, Getting Help, includes information on getting
answers and using
Minitab Help features. Chapter 11, Reference, provides an
overview of the Minitab
environment and a discussion about the types and forms of data
that Minitab uses.
You can work through Meet Minitab in two ways:
[] From beginning to end, following the story of a fictional
online bookstore through
a common workflow
m By selecting a specific chapter to familiarize yourself with a
particular area of
Minitab
Meet Minitab introduces dialog boxes and windows when you
need them to perform
a step in the analysis. As you work, look for these icons for
additional information:
Provides notes and tips
@ Suggests related topics in Minitab Help and StatGuide
Typographical Conventions in this Book
[Enter]
[Alt]+[D]
Denotes a key, such as the [Enter] key.
Denotes holding down the first key and pressing the second key.
For example, while holding down the [Alt] key, press the [D]
key.
131. File ÿ Exit Denotes a menu command, in this ease choose Exit
from the File
menu. Here is another example: Stat * Tables ÿ Tally Individua!
Variables means open the Stat menu, then open the Tables
submenu, and finally choose Tally Individual Variables.
Click OK. Bold text clarifies dialog box items and buttons and
Minitab
commands.
Enter Pulsel. Italic text specifies text you need to enter.
1-2 Meet
Minitab I
The Story Getting Started
The Story
An online book retail company has three regional shipping
centers that distribute
orders to eonsumers. Each shipping center uses a different
computer system to enter
and process order information. To integrate all orders and use
the most efficient
method company wide, the company wants to use the same
computer system at all
three shipping centers.
Throughout this book, you analyze data from the shipping
centers as you learn to use
Minitab. You create graphs and conduct statistical analyses to
determine which
132. computer system is the most efficient and results in the shortest
delivery time.
After you identify the most efficient computer system, you
focus on the data from this
center. First, you create control charts to see whether the
center's shipping process is
in control, Then, you conduct a capability analysis to see
whether the process is
operating within specification limits. Finally, you conduct a
designed experiment to
further improve the shipping center's processes,
Additionally, you learn about session commands, generating a
report, preparing a
worksheet, and customizing Minitab.
Starting Minitab
Start Minitab
Before you begin your analysis, start Minitab and examine the
layout of the windows.
1 From the Windows Taskbar, choose Start ÿ Programs *
Minitab ÿ Minitab 16
Statistical Software.
Minitab opens with two main windows visible:
B The Session window displays the results of your analysis in
text format. Also, in
this window, you ean enter commands instead of using
Minitab's menus.
m The Data window contains an open worksheet, which is
133. similar in appearance to
a spreadsheet. You can open multiple worksheets--each in a
different Data
window.
Meet Minitab
1-3
Chapter 1 Opening a Worksheet
Session windowÿ._..._
-- :ÿ,ÿ/2009 1145104 PM
'llcoll to ÿ[inltÿ, pÿels FI foÿ hllp.
Data window:
- Columns -------------
- Rows
- Cells
,,ÿ CI (:2 i Ct i ,C4 ÿ Oÿ
I i I¸ ,
,i
2!
,if
5i
°]
tl }
134. r,.ÿ Wcÿkÿee: woÿ i
iC8 I ÿ CI0 CII , C12 C13 I
C14 CI5 1ÿ !
Iÿ [ For more information on the Minitab environment, see The
Minitab Environment on page 11-2.
Opening a Worksheet
You can open a new, empty worksheet at any time. You can also
open one or more
files that contain data. When you open a file, you copy the
contents of the file into
the current Minitab project. Any changes you make to the
worksheet while in the
project will not affect the original file.
The data for the three shipping centers are stored in the
worksheet
ShippingData.MTW.
I In some cases, you will need to prepare your worksheet before
you begin an analysis. For
I information on setting up a worksheet, see Chapter 8,
Preparing a Worksheet.
1-4 Meet
Minitab
Opening a Worksheet Getting Started
Open a
worksheet
135. Choose File ÿ Open
Worksheet.
Click Look in Minitab
Sample Data folder, near
the bottom of the dialog box. Deÿktcÿ iÿata'NTW
In the Sample Data folder,
double-click Meet Minitab.
Choose
ShippingData.MTW, then
click Open. If you get a
message box, check Do not
Examine
worksheet
You can change the default
folder for opening and saving
Minitab files by choosing
Tools ÿ Options ÿ General.
..u D ocan,,eras
MÿNÿ
Piacÿ
[eÿk In ,ÿab ÿ Oat a f O, dez
display this message again, then click OK. To restore this
message for every time
you open a worksheet, return to Minitab's default settings. See
Restoring Minitab's
Default Settings on page 9-6.
136. The data are arranged in columns, which are also called
variables. The column
number and name are at the top of each column. Each row in the
worksheet
represents a case, which is information on a single book order.
Column with Column with Column with
date/time data numeric data text data
Column
name
Row
number
]C3-D C4 C6 C'-'7
Order ÿ Arrival Days sGi& oiÿaeÿ"l
1 ÿlEastern 3/3/2009 8:34 !3/7/2009 16:21 4.28264 On time ,
285
iEastem 3/3/20098:3513/8/200917:05i 3.35417 Ontime 198
3 I Eastern 3/3/2009 8:38j *i * Back orderl 299
-- 2,1 i Eastern 13/3/2009 8:40'3/7/2009 15:52 ; 4.30000 ÿOn
time 205
5 ]Eastern i3/3/2009 8:42 3/9/2009 14:48, 6.25417;Late 250
6 IEastern i3/3/2009 8:4313/8/2009 15 48ÿ 6.29308 On time
93:
7 IEastern i3/3/2009 8:50 '3/7/2009 10:02 4.05000 ion time
I89
8 IEastern 13/3/20098:553/8/2009 16:30ÿ 5.31597 On time
335
137. Minitab accepts three types of data: numeric, text, and
date/time. This worksheet
contains each type.
The data include:
,, Shipping center name
,, Order date
[] Delivery date
Meet Minitab
1-5
Chapter 1 What's Next
[]
[]
Number of delivery days
Delivery status ("On time" indicates that the book shipment was
received on
time; "Back order" indicates that the book is not currently in
stock; "Late"
indicates that the book shipment was received six or more days
after ordered)
[] Distance from shipping center to delivery location
] For more information about data types, see Minitab Data on
page 11-5.
138. What's Next
Now that you have a worksheet open, you are ready to start
using Minitab. In the
next chapter, you use graphs to check the data for normality and
examine the
relationships between variables.
1-6 Meet
Minitab
2
Graphing Data
Objectives
In this chapter, you:
[] Create and interpret an individual value plot, page 2-2
[] Create a histogram with groups, page 2-4
[] Edit a histogram, page 2-5
[] Arrange multiple histograms on the same page, page 2-6
[] Access Help, page 2-8
[] Create and interpret scatterplots, page 2-9
[] Edit a scatterplot, page 2-10
[] Arrange multiple graphs on the same page, page 2-12
[] Print graphs, page 2-13
139. [] Save a projeet, page 2-13
Overview
Before conducting a statistical analysis, you can use graphs to
explore data and assess
relationships among the variables. Also, graphs are useful to
summarize findings and
to ease interpretation of statistieal results.
You can access Minitab's graphs from the Graph and Stat
menus. Built-in graphs,
which help you to interpret results and assess the validity of
statistieal assumptions,
are a!so available with many statistical commands,
Graph features in Minitab include:
[] A pictorial gallery from which to choose a graph type
[] Flexibility in customizing graphs, from subsetting of data to
specifying titles and
footnotes
Meet Minitab
2-1
Chapter 2 Exploring the Data
-, Ability to change most graph elements, such as fonts,
symbols, lines, placement of
tick marks, and data display, after the graph is created
-, Ability to automatically update graphs
140. This chapter explores the shipping center data you opened in the
previous chapter,
using graphs to compare means, explore variability, check
normality, and examine
the relationship between variables.
For more information on Minitab graphs, go to Graphs in the
Minitab Help index and then
double-click the Overview entry for details on Minitab graphs.
To access the Help index, choose
Help • Help, then click the Index tab.
Exploring the Data
Before conducting a statistical analysis, you should first create
graphs that display
important characteristics of the data.
For the shipping center data, you want to know the mean
delivery time for each
shipping center and how variable the data are within each
shipping center. You also
want to determine if the shipping center data follow a normal
distribution so you that
you can use standard statistical methods for testing the equality
of means.
Create an
individual
value plot
You suspect that delivery time is different for the three shipping
centers. Create an
individual value plot to compare the shipping center data.
1 If not continuing from the previous chapter, choose File •