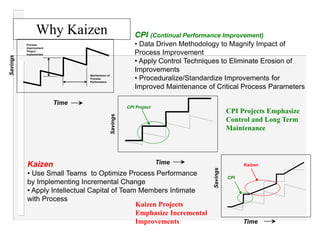
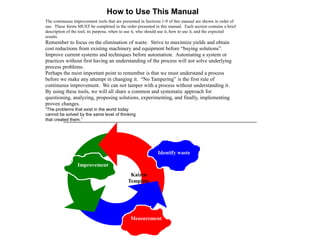
This document provides instructions and templates for conducting a kaizen (continuous improvement) event. It details nine tools to identify and eliminate waste in processes. The tools are meant to be used in a specific order and include forms for standard work, time observation, workload balancing, action planning, and tracking improvements. The overall goal is to systematically analyze processes, understand sources of waste, and implement incremental changes to maximize efficiency and productivity.


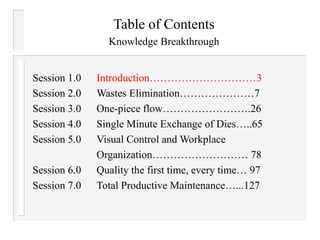


![Table of Contents
Section 1 Standard Work Sheet (SWS): Used to create a visual picture of a
work area. Shows crew size and location; office layout, distances
within the work area, work in process, quality checks, and safety
precautions………………………………………………………………..
.
4
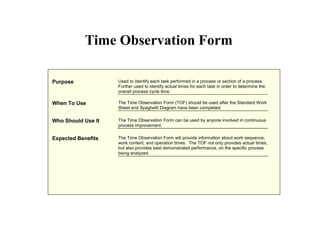
Section 2 Time Observation Form (TOF): Used to identify each task
performed in a process or section of a process. Further used to
identify actual times for each task in order to determine the overall
process cycle time……………………………………………………….. 7
Section 3 Standard Work Combination Sheet (SWCS): Used to
graphically show each task time within a process in terms of it’s
relation to Walking, Manual, Auto and Idle time. It further shows
tasks which are performed in series and/or parallel [for further
analysis]…………
11
Section 4 Workload Balancing Sheet (WBS): Used to graphically show the
relationship between process cycle time(s) and TAKT time in order
to examine the line balance and resolve any rebalance [waste]
opportunities which may
exist……………………………………………
14
Section 5 Kaizen Action Sheet: Used to record problems/opportunities
which are identified by the process. The Action Sheet also records
the corrective actions, expected results, a drawing of the before
and after process, and finally measurements which will be used to
assess results…………………………………………………………….. 17
Section 6 Kaizen To Do List: Used to provide a summarized list of all
KAIZEN Action Sheets, the primary person responsible to follow-up
on each action, a due date for action item completion, and finally a
graphic display of the percent completion for each action
item………………………………………………………………………… 20
Section 7 Kaizen Target Sheet: A visual format for comparing continuous
improvement efforts to a desired target and known starting
value………………………………………………………………………. 23
26
Section 8 Kaizen Target Sheet Definitions……………………………………..
Section 9 Kaizen Improvement Results: Used to document the before and
after results of improvement activities associated with key
performance metrics. …………………………………………………. 28](https://image.slidesharecdn.com/lean-whatdoeskaizenmean-240404142159-00e3cf21/85/LEAN-What-Does-Kaizen-Mean-ppt-based-on-lean-manufacturing-21-320.jpg)

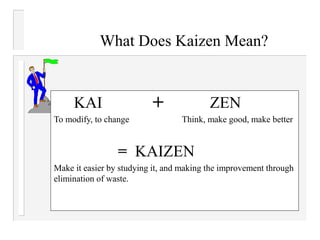
![1. Complete Sections A. B, and C. with the necessary information.
2. Fill in the Task Component blanks with the steps of the process. List the components in as
specific terms as possible, i.e., 1. Walking to get work piece. 2. Removing work piece from
basket. 3. Walking to machine. 4. Loading piece into machine. And so on.
3. Begin timing the tasks. As each task is completed, stop the watch and record the cumulative
time on the form. Continue recording task times in this manner until the end of the process
cycle
4. At the completion of 12 full cycles, calculate and enter the “Assigned Component Time” for
each “Task Component”. Then sum up the “Assigned Component Time” for each “Task
Component” and enter this into the “Time For One Cycle” field. Be sure to include the time
spent on closing out work orders, or moving parts to next job.
5. During the manufacturing process, be aware of the steps taken to perform the job, i.e. If a
particular task component varies from 4 second for observation #1 and 47 seconds for
observation #2, provide comments about the observed variance in the remarks column.
Remember, in our quest to remove waste from the process, we want to question every task
component of the process.
6. Once the actual cycle times are known, compare them to TAKT time. TAKT Time for
measurable, repetitive task processes is calculated as follows:
A. Calculate the total time available per shift, day, etc. excluding breaks and lunches.
Let’s say that we have a full 8 hours available. 8 hours would equal 480 minutes or
28,800 seconds.
B. Determine the required product quantity. [How many units have been sold] For this
example, let’s use 395 units for the required production for this operation.
C. Next, divide the total time available by the required production to arrive at the TAKT
Time. 28,800 / 395 = 73 seconds per unit.
D. Compare this TAKT time to the average cycle time of the observation.
1. If TAKT Time is greater than average cycle time, then we can conclude that
the required production can be met within the total time available. However,
we need to examine adding work from another process to minimize idle time.
2. If TAKT Time is less than average cycle time, then we can conclude that the required production cannot be
met within the total time available. We must eliminate work through Kaizen or transfer work to another
worker.
How to use it](https://image.slidesharecdn.com/lean-whatdoeskaizenmean-240404142159-00e3cf21/85/LEAN-What-Does-Kaizen-Mean-ppt-based-on-lean-manufacturing-24-320.jpg)


