Book Paid Powai Call Girls Mumbai 𖠋 9930245274 𖠋Low Budget Full Independent H...
Ensink et al 2009 musi water qual infrastruc ids
1. Sewage disposal in the Musi-River, India: water quality
remediation through irrigation infrastructure
Jeroen H. J. Ensink & Christopher A. Scott &
Simon Brooker & Sandy Cairncross
# Springer Science + Business Media B.V. 2009
Abstract The disposal of untreated urban sewage in to open water bodies is common in
most developing countries. This poses potential negative consequences to public health and
agricultural sustainability. Hyderabad, one of India’s largest cities, disposes large amounts
of its wastewater untreated into the Musi River, from where it is used, with the aid of
irrigation weirs, for agricultural production. This paper presents a 14 month (December
2003 – January 2005) water quality survey which aimed to quantify spatial and temporal
changes in key water quality parameters along a 40 km stretch of the Musi River. The
survey found that river water quality improved dramatically with distance from the city;
from untreated sewage in the city to irrigation water safe for use in agriculture 40 km
downstream of the city. This improvement was contributed to by different treatment
processes caused or aided by the irrigation weirs placed on the river.
Keywords Agriculture . Helminths . India . Musi River. Wastewater use . Wastewater
treatment
Irrig Drainage Syst
DOI 10.1007/s10795-009-9088-4
J. H. J. Ensink (*) :S. Brooker :S. Cairncross
Department of Infectious and Tropical Diseases, London School of Hygiene and Tropical Medicine,
Keppel Street, WC1E 7HT London, UK
e-mail: jeroen.ensink@lshtm.ac.uk
S. Brooker
e-mail: Simon.brooker@lshtm.ac.uk
S. Cairncross
e-mail: Sandy.Cairncross@lshtm.ac.uk
J. H. J. Ensink :C. A. Scott
International Water Management Institute (IWMI) South Asia regional office, ICRISAT,
Patancheru 502 324 Andhra Pradesh, India
C. A. Scott
e-mail: cascott@email.arizona.edu
C. A. Scott
Udall Center for Studies in Public Policy, and School of Geography & Development,
University of Arizona, Tucson, AZ, USA
2. Introduction
Rapid and uncontrolled urbanization is often associated with environmental contamination,
especially the pollution of surface water bodies like rivers and lakes by solid and liquid
wastes. Large scale pollution of rivers has resulted in strict enforcement of waste disposal
legislation in most industrialized countries, where wastewater is disposed of only following
extensive treatment. This is in contrast to most developing countries where most sewage
goes untreated; in India for example, it is estimated that over 70% of all wastewater is
disposed of untreated and that an investment of US$ 65 billion would be needed to treat all
wastewater (Kumar 2003). The situation in India is likely to deteriorate even further as
India’s population will grow by almost 400 million people in the next quarter of a century,
with approximately 85% of this growth taking place in cities (UNPD 2003).
Rivers have a natural, though limited, capacity to restore water quality to pre-pollution levels,
through dilution, die-off, sedimentation and biological processes. These natural treatment
processes can be further aided by weirs and/or reservoirs on rivers which reduce flow velocities,
thereby lengthening hydraulic retention and promoting sedimentation. However with the
growth of cities the amount of wastes disposed into rivers often grows beyond their self-
purifying ability. In these instances untreated wastewater disposal poses serious risks to public
health, and in areas where river water is used for irrigation, to agricultural sustainability.
The Musi River, a tributary of the Krishna River in Andhra Pradesh, India receives large
quantities of untreated sewage from the city of Hyderabad. Downstream of the city, Musi
water is retained in large and small reservoirs with the help of weirs and from there diverted
into irrigation canals and village tanks to be used by farmers for crop production. A clear
improvement in river water quality, both in appearance and smell, was observed with
increased distance from the city. This raised the hypothesis that the weirs on the river had
created waste stabilization ponds (WSP) and aided the river’s self purifying ability and
could thus provide irrigation water safe for use in agriculture.
This paper presents the results of a water quality survey conducted over a 40 km transect
of the Musi River downstream of the city of Hyderabad. The objectives were two-fold: i) to
determine spatial and temporal variations in E. coli and helminth egg concentrations; key
indicator organisms included in the World Health Organization (WHO) guidelines for the
safe use of wastewater in agriculture (WHO 2006), ii) to determine the degree of pollution
remediation occurring as the combined result of natural river processes and irrigation
infrastructure along the river.
Methodology
Study area
The Musi River is located on the Deccan Plateau in the State of Andhra Pradesh, Southern
India. It originates 60 km upstream of the city of Hyderabad and enters the Krishna River
200 km downstream of it. In the 1920s two large reservoirs were created upstream of
Hyderabad to meet the city’s increased (drinking) water demand and to mitigate the effect
of frequently occurring floods. Due to increased demand for drinking water by the city, no
controlled water releases from the reservoirs occur and the river downstream of the
reservoir and upstream of Hyderabad is dry.
In the city the river reappears as a result of the large scale sewage disposal into the river
bed. Hyderabad has a population of 6.8 million (van Rooijen et al. 2005) and it is estimated
3. to use over 800,000 m3
of water per day, while 70% of the city is connected to a sewerage
system (HUDA 1994). The city in 2005 had one functioning secondary treatment plant,
which treated an estimated 5% of all wastewater produced by the city. All wastewater
produced by the city was disposed of into the Musi River and as a result the river had
effectively become the city’s one and only sewage outfall drain.
The Musi River traditionally provided farmers downstream of Hyderabad with irrigation
water for the cultivation of paddy during and after the monsoon rains. Through the
construction of weirs, river water is retained in large and small reservoirs on the river from
where it is diverted through irrigation canals to village tanks and agricultural fields. There
are a total of 22 weirs situated on the Musi River irrigating an area of approximately 10,000
hectares (Katta 1997). In the rural areas the main crop is rice (Oryza sativa), while close to
the city the main crop is fodder grass (Brachiaria mutica).
Water quality assessment
Sample point selection
A 40 km stretch of the river, on which 13 weirs were situated, was selected for the water quality
assessment. This stretch of the river was selected as it had no tributaries, nor received major
inflows of sewage or surface run-off. Other reasons were accessibility, ease of safe access, travel
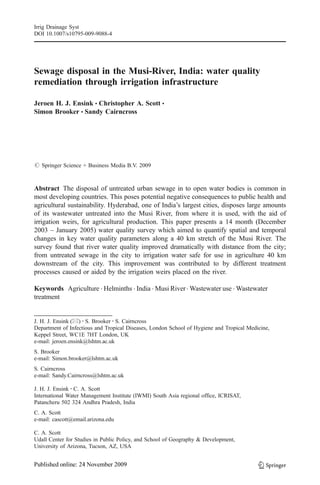
time and because a very clear water quality improvement was observed. On this stretch eight
sample points, approximately 5 km apart from each other were selected, the first of which was
situated in the heart of the city (Fig. 1). The selection of sample points was based on the
following criteria: reasonable access to the river, the possibility to sample flowing water without
having to enter the river, and for the points outside the city, the proximity to a weir. Following a
6 month pilot study, during which sampling and laboratory procedures were tested, a 14 month
long water quality survey was undertaken from December 2003 to January 2005.
Pathogen and chemical water quality assessment
River water samples were collected on a fortnightly basis and analysed for Electrical
Conductivity (EC), Dissolved Oxygen (DO) and helminth eggs concentrations. A
composite grab water sample was collected in a sterile 5 l plastic container and analysed
Fig. 1 Location of sample points
and weirs on the Musi-River
in and downstream of
Hyderabad
4. following the modified Bailenger method (Ayres and Mara 1996) for the presence of
helminth eggs. A minimum of three McMaster slides per sample were analysed. Infertile Ascaris
ova were not included in the Ascaris count. DO and EC were measured in situ, at 10–20 cm
below the water surface, using a hand-held DO and EC meter (Model 85, YSI, Ohio, USA).
Once every 4 weeks additional water samples were collected and analysed for: E. coli,
biochemical oxygen demand (BOD), and dissolved nitrogen (DN) concentrations. BOD
samples were collected in 1.5 litre airtight sterile plastic containers and analysed on a
BODTrak™ (HACH, Loveland, USA) using the respirometric method (HACH 1997). DN
was obtained by adding nitrate (NO3
−
) and ammonia (NH4
+
) concentrations; nitrate was
analysed using Devarda’s alloy reduction method while for ammonia the distillation method
was used (APHA-WWE-WEF 1998). Samples for E. coli enumeration were collected in
500 ml glass bottles and analysed using the membrane filtration technique on the
commercial medium m-ColiBlue24®, which allows simultaneous enumeration of total
coliforms and E. coli. River samples were diluted so that each filter-pad would contain
between 20 and 300 colonies. E. coli colonies were enumerated and reported as numbers of
colonies per 100-ml water sample (APHA-WWE-WEF 1998). All water samples were
stored on ice and analysed within 4 h of collection.
Flow measurements
Rough discharge measurements were taken on all sampling days at sample point I. A cross-
section of the river was estimated and flow velocity was determined with the help of a float.
Flow velocity was determined by timing the movement of a float (i.e., a plastic bottle three-
quarters filled with water) over a distance of 25 m. A correction factor of 0.7 was applied to
surface velocity to derive a depth-averaged velocity (Shaw 1984). The cross-sectional area
of flow was determined from depth measurements made approximately every 1 m across
the channel. In addition flow measurements were taken at all irrigation canals with an off-
take on the Musi River.
Treatment performance
The hypothesis that different reservoirs on the Musi River acted as a system of WSPs was
explored with the help of satellite images and field measurements (area and depth of the
different reservoirs), while hydraulic retention time (HRT), volumetric BOD loading and
potential treatment performances were calculated using standard WSP design formulae
(Mara 1997). Meteorological data were obtained from a local weather station located just
outside of the city (ICRISAT, unpublished data).
Poor satellite image resolution allowed for estimates of the surface area of the reservoirs
to be made only for the first three weirs on the Musi River. BOD loading on each
consecutive reservoir was calculated by using the mean BOD concentrations at the
upstream sample point, multiplied by the mean flow in the river. Flows diverted into
irrigation canals were deducted from the main flow in the Musi River.
Data analysis
Data analysis was undertaken using STATA 7.0 (STATA-Corporation, College Station,
USA). Arithmetic means and standard deviations were calculated for most parameters, with
5. the exception of E. coli concentrations, for which the geometric mean was calculated.
Differences in concentrations between a sample point and the sample point situated directly
upstream were compared using a paired, two-sided Student’s t-test. A P-value of<0.05 was
considered significant. The possibility of a trend between a water quality parameter and the
distance from the city was explored using the regression option.
Results
Water quality assessment
During the course of the survey 216 water samples were collected on a fortnightly basis and
analysed for helminth eggs, EC and DO, while an additional 104 samples were collected on
a monthly basis and analysed for E. coli, BOD and DN.
Health indicator parameters
During the course of the survey 143 (66%) water samples from various points were found
to be positive for helminth eggs. Three different helminth species were detected; hookworm
was the most common, found in 65% of all samples, followed by Ascaris (45%) and
Trichuris (9%). Hookworm and Ascaris concentrations were found to be similar at the first
two sample points, while Trichuris concentrations were found to be much lower (Table 1).
Concentrations of all three helminths decreased rapidly after the first weir (sample point III)
and decreased further with each additional weir. Trichuris eggs were the first to disappear
from river water, followed by Ascaris, while hookworm eggs were the last to disappear
from the river. The E. coli concentrations at the first two sample points were high (Table 1)
and comparable with those in raw sewage (Mara 1997), though with increasing distance
from the city they decreased rapidly.
BOD, DO, EC and DN
BOD was found to be high at sample points I and II and concentrations showed a similar
trend to helminth eggs, with a marked reduction after each weir (Table 2). River water at
point VIII was visibly of better quality than that of sample points I and II, reflected in BOD
which ranged from 4 to 54 mg/L, with the maximum concentration observed during the
period of land preparation. The DO concentrations at the first four sample points were very
low, ranging from 0.00–0.71 mg/L (Table 2). The first signs of an improving water quality
were observed at sample point VI where DO concentrations ranged from 0.02–3.34 mg/L.
Water quality was best at the last sample point with a mean DO concentration of 5.00 mg/L
and concentrations ranging from 2.43–8.90 mg/L. EC values remained relatively constant
but showed a sharp increase between points VII and VIII. DN showed a weak correlation
(R2
=0.65) with BOD. DN showed little to no variation for the first four points; only after
point V was a decrease in DN observed (Table 2).
Wastewater flow (Musi discharge)
During the course of the water quality survey the discharge in the Musi River at sample
point I varied from: 3.4 m3
/s to 14.7 m3
/s. Based on a 24 h survey previously conducted,
the total daily river discharge varied from 325,000 m3
/day in December 2003 to a
7. maximum discharge of 922,000 m3
/day in the monsoon month of August 2004. The
average discharge was 550,000 m3
/day. River discharge showed a weak correlation with
DO (R2
=0.65) and DN (R2
=−0.55), with high river discharge associated with high DO
concentrations but low DN concentrations.
Treatment performance
The results show a considerable improvement in water quality from sample point I to VIII
for all water quality parameters, with the exception of EC (Table 3). The reduction in
helminth egg concentrations from sample point II to III was over 80% and statistically
significant for hookworm (P<0.001), Ascaris (P<0.001) and Trichuris (P=0.01). The trend
towards significantly lower egg concentrations after each weir was observed for all weirs
for Ascaris and hookworm concentrations. The E. coli concentrations at sample point VIII
were on average over 4 log (or 99.99%) lower than concentrations measured in the city.
Unlike for the helminth eggs, E. coli concentrations did not decrease significantly across
Table 2 Mean values and 95% confidence intervals (in parentheses) of BOD, DO, EC and DN at the
different sample points along the Musi-River in and downstream of the city of Hyderabad
Sample point Distance (km)
from Hyderabad a)
BOD (mg/L) DO (mg/L) EC (dS/m) DN (mg/L)
I 0 325 (286–364) 0.10 (0.04–0.16) 1.52 (1.47–1.56) 36.6 (33.2–40.1)
II 5.2 317 (271–362) 0.12 (0.07–0.18) 1.84 (1.78–1.91) 39.1 (36.3–42.0)
III 9.6 162 (135–190) 0.12 (0.06–0.18) 2.03 (1.95–2.11) 38.9 (35.7–42.2)
IV 13.9 95 (75–115) 0.12 (0.06–0.19) 2.00 (1.93–2.07) 38.4 (34.9–41.9)
V 17.3 73 (57–88) 0.22 (0.13–0.33) 1.96 (1.89–2.04) 35.1 (32.0–38.3)
VI 20.0 54 (44–65) 1.12 (0.73–1.51) 1.98 (1.90–2.06) 31.2 (28.5–33.9)
VII 27.7 31 (19–42) 3.03 (2.51–3.56) 1.99 (1.92–2.06) 23.1 (17.9–28.4)
VIII 39.7 15 (8–23) 5.00 (4.36–5.64) 2.26 (2.12–2.39) 10.6 (4.1–17.0)
a) Distance measured along the river bed
Table 3 Treatment performance of the weirs and reservoirs on the Musi-River from sample point I to VIII,
in the period December 2003 – January 2005, compared with that of a well designed system of waste
stabilization ponds (WSP)
Treatment efficiency
Well designed WSP a
Musi River (sample points: I–VIII)
Mean b
Range
Helminths 100% 100% –
E.coli 99.999% 99.99% (0.03) 99.9–99.999%
BOD >90% 95% (4) 83–99%
EC −49% (20) −91–19%
Nitrogen 70–90 71 (30) 14–100%
a) Source: Mara (1997)
b) Values in parentheses are one standard deviation
8. any individual weir. However, the logarithm of E. coli concentrations (y) did show a
significant negative correlation with distance (x in km), which was best captured in a linear
trend-line (y=−0.11x+7.57, R2
=0.86). BOD concentrations after the first weir were on
average 46% lower than concentrations found at the sample points located in the city, though
the treatment efficiency (= (BOD downstream/ BOD upstream)*100%) of the weir showed
great variability, ranging from 11% to 69%. The difference in BOD between points II and III,
and between all the other upstream and their nearest downstream sample points, was
statistically significant (P<0.001). The treatment efficiency for the whole 40 km system was
83% during the period of land preparation (when irrigation canals were closed), but this
increased to 93–99% during the remaining months of the year. The reduction in BOD with
increased distance (x in km) from the city showed a negative exponential trend with a high
statistical significance (BOD=346.4e−0.0838X
, R2
=0.97). DO concentration across the eight
sample points showed a similar but inverse trend to BOD (DO=0.0573e0.117X
, R2
=0.85). No
clear trend was found for EC with increased distance from the city nor was an association
found with discharge or other water quality parameters.
Discussion
For centuries the Musi-River has, through a network of weirs and irrigation canals, provided
water to village tanks and fields, thereby supporting fisheries and meeting domestic and
agricultural water needs. When the natural flow of the Musi River was obstructed in 1920
following the construction of the two reservoirs upstream of Hyderabad, negative consequences
for downstream water users were prevented by planned water releases (Venkateswarlu 1969).
This allowed tanks to fill up so that rice could be grown in the months following the rainy
season. With the expansion of Hyderabad, the city became increasingly water scarce and
water was released from the reservoirs less frequently, while at the same time increasing flows
of sewage were discharged into the Musi River bed. Currently the Musi River upstream of
Hyderabad is dry, while, as the results of this survey have shown, in and downstream of the
city the river flows with essentially untreated domestic wastewater, with corresponding high
BOD, E. coli and helminth egg concentrations.
Sewage disposal has had a mixed impact on downstream users. The deterioration in
water quality means that some tanks close to the city are now unfit for the cultivation of fish
and some farmers claim that Musi water is unsuitable for use in agriculture. The
deterioration in water quality is however offset by its increased availability and reliability.
Since the rapid growth of the city in the 1980’s the ‘Musi’ now flows continuously and this
has resulted in the year-round cultivation of rice in the downstream rural areas which in the
past was confined to the months following the monsoon season.
Health implications of Musi-water quality
Public health concern is the most obvious drawback to the use of Musi water in agriculture.
The risk of helminth infection has been identified by the WHO as one of the main risks
associated with wastewater use in agriculture (WHO 2006). Helminth concentrations in
Musi water were typical for domestic sewage in India (Bhaskaran et al. 1956;
Lakshminaruyana and Abdulappa 1972; Panicker and Krishnamoorthi 1981) but exceeded
the water quality standard (≤ 1 egg litre−1
) set by the WHO for the safe use of river water in
agriculture for all but the last sample point (WHO 2006). This was partly corroborated by
the findings of an epidemiological study which found an increased risk of hookworm,
9. Ascaris and Trichuris infection in farming families using Musi-water at sample points I and
II, though only an increased risk of Ascaris infection at sample point III (Ensink 2006;
Ensink et al. 2008).
E. coli concentrations at sample points I and II were high but decreased rapidly with
increased distance from the city, however only at the last sample point, where the geometric
mean was 792 faecal coliforms per 100 ml (95% CI: 392–1,601), was a 4 Log reduction
achieved, as required by the WHO for the restricted use (cultivation of crops consumed
cooked) of irrigation water in agriculture (WHO 2006).
Agricultural implications of Musi water quality
Farmers who rely on the Musi River for their irrigation water were unanimous in their
opinion that river water quality over the past few decades had deteriorated badly (Buechler
and Devi 2003). However their claims regarding the suitability of river water for use in
agriculture were more diverse and differed by area and from farmer to farmer. Farmers in the
city complained about needles from hospital waste, bottles, plastic bags and other garbage
that was found in their fields, but rarely complained about the quality of the water itself. This
was most likely because the crop predominantly grown in the city—fodder grass—tolerates
high nitrate and salinity concentrations. Farmers in the peri-urban and rural areas were more
critical about the water quality, complaining about the regular disposal of chicken slaughter
waste into the river and claiming that poor water was responsible for diseases in their cattle
and for a 30% reduction in rice yield (Buechler and Devi 2003). However farmers did
acknowledge that the nutrient value of Musi water allowed them to save on the cost of
chemical fertilizer.
The expansion of the city of Hyderabad has slowly turned peri-urban and rural areas into
urban zones and over the last two decades the area between sample points II and V has seen
a move from a cropping pattern almost exclusively of rice to a mixture of fodder grass and
rice or a complete mono-culture of fodder grass (Buechler and Devi 2003). Poor water
quality, and in particular high salinity levels, was mentioned by farmers as an explanation for
yield reductions and the shift from rice to fodder grass. However, this shift is not supported by
the results of this water quality survey as the salinity threshold for rice (3.0 dS m−1
) was never
attained during the period under study (Rhoades et al. 1992) and it is therefore unlikely that
salinity alone was responsible for the change in cropping pattern. This was further
supported by the cultivation of rice at samples points VII and VIII where no losses in yield
were reported. The nitrogen levels in Musi water exceeded recommendations made by the
FAO for unrestricted irrigation (Pescod 1992), though guideline values were only
occasionally exceeded and only by a small margin. In contrast, similar nitrogen
concentrations in trials in Korea even resulted in a 10% increase in rice yield (Yoon et
al. 2001). Concentrations of metals in Musi water were in general low (IWMI, unpublished
data) with the exception of iron (Fe) and aluminium (Al) though even these did not exceed
agricultural guideline concentrations (Pescod 1992), or guideline concentrations set to
protect public health (WHO 2006).
The shift from rice to fodder grass cultivation might have had reasons other than water
quality alone, though a shift from rice to a less sensitive crop, like fodder grass, is more
than plausible. The growth of the city and with it the increased need for skilled and
unskilled labour might also have prompted a change from a labour intensive crop, like rice,
to a less labour intensive crop like para grass. This, combined with a rapid growth in the
demand for milk and dairy products in India (Delgado et al. 1999; Kurien 2004), has
resulted in a situation where a profitable living can be made by growing fodder grass for
10. local dairy producers. Reductions in rice yields could possibly be explained by the
exhaustion of an originally deficient and poor soil, by the double rice cropping system
which is practised now and the generally held perception by farmers that if Musi water is
applied, there is no longer a need to apply chemical fertilizer. These speculations are,
however, beyond the scope of this water quality survey, which was not set up with the
intention of investigating why rice yields have gone down, nor to explore why farmers
shifted from one crop to another. The results of this survey alone are therefore unable to
answer these questions but they provide some evidence that factors other than water quality,
such as local livelihood strategies, land prices, distance to local markets and soil quality,
may have played a role in changing agricultural practices, and that further investigation
would be required to confirm the reasons.
Wastewater quality remediation
The results of the survey showed an impressive improvement in water quality from sample
point I to VIII, especially considering the relatively short distance of 40 km. These
improvements are probably the result of a set of different remediation processes: principally
sedimentation, dilution, aeration, natural die-off and exposure to UV-light. These processes
made the weirs on the Musi River rival the treatment performance of well-designed WSP
systems (Table 3), the recommended method for wastewater treatment in arid and semi-arid
developing countries (Mara 1997).
Past studies in Mexico and Israel have shown that weirs and reservoirs help promote
sedimentation and water quality improvements (Blumenthal et al. 2001; Juanico and Shelef
1991). Sedimentation behind the first and subsequent weirs on the Musi has played an
important role in the reduction of BOD and helminth concentrations. This was confirmed
by sediment analysis at the first weir which showed very high concentrations of helminth
eggs, ranging from 67,000 to 734,000 ova kg−1
of sediment (Hofstedt 2005). In addition to
sedimentation, anaerobic digestion taking place in the reservoirs created by the weirs might
have played an important role in water quality improvement. The BOD loading in the
reservoirs behind the first two weirs was estimated (Table 4) to range from 110 to
160 kg m−3
d−1
, which is above the minimum volumetric loading (100 kg m−3
d−1
) to
maintain anaerobic conditions (Mara 1997). In the third reservoir, at sample point V, the
volumetric loading was estimated to be 90 kg m−3
d−1
and here aerobic conditions returned
to the river. This was confirmed by the first improvements in DO-concentrations at sample
point V. Based on this the first two reservoirs on the Musi River can be considered as
anaerobic ponds and the following reservoirs facultative and maturation ponds. Treatment
performance in the first two reservoirs can thus be calculated based on the minimum
temperature during the coldest month (January 2004), which was 21°C. This would have
Table 4 Estimated reservoir volume, hydraulic retention time (HRT) and volumetric BOD loading for the
first three reservoirs on the Musi-River
Sample point Reservoir size (m3
) HRT (h) BOD loading (kg ha−1
d−1
)
Mean Range
III 1,100,000 48 29–81 159
IV 410,000 29 14–90 115
V 260,000 21 9–96 90
11. resulted in (minimum) BOD removal efficiency of 62%. In fact, the mean BOD removal
efficiency was approximately 40% for each individual weir/reservoir, but for the first two
reservoirs combined it was 70%, which was close to the maximum removal performance
that anaerobic ponds can achieve under ideal conditions (Mara 1997).
The sedimentation of organic matter and other suspended material will over time reduce
reservoir capacity, hydraulic retention and thus a reservoir’s treatment ability. There is
potential for these reservoirs to be cleaned out naturally during the monsoon season, when
peak river discharges may re-entrain settled solids. This would be beneficial as it would
maintain the treatment capacity of the reservoirs, though the high Ascaris egg
concentrations in the sediment and their possible re-suspension during peak flow events
could be of concern, as Ascaris eggs have been reported to remain viable for up to 2.5 years
in sludge (Ayres et al. 1993). However, the direct health impact on farmers can be expected
to remain limited during the monsoon season as a result of dilution by rain water and the
lower irrigation water demand that results in decreased contact with wastewater arising
from irrigation operations. E. coli removal has been associated with the sedimentation of
organic matter (Feachem et al. 1983), though settling velocities for E. coli , because of
lower weight, are much lower than those of helminth eggs. E. coli concentrations showed a
strong association with distance and this suggests that the predominant mechanism for the
removal of E. coli from Musi water was probably natural die-off with time, though dilution
as a result of groundwater return flows from irrigated fields, and exposure to UV light have
certainly played a role too. However, the impact of UV light at the first six sample points
has probably been minimal, as a consequence of the high turbidity which prevents effective
penetration of UV light into the water column (Otaki et al. 2003). Recontamination of
Musi-water with E. coli downstream of irrigation weirs should be considered, and would
suggest and even higher treatment performance as currently reported, as the river is
frequently used by water buffaloes for bathing and drinking.
The average salinity increased by almost 50% from sample point I to sample point VIII.
This increase came partly as a result of an inflow of more saline wastewater within the
city’s boundaries while an additional increase in salinity levels occurred between sample
points VII and VIII in the rural stretch of the river where no wastewater was discharged. Only
evaporation and inflow of water with a higher salinity could have resulted in this increase
because salinity is a conservative parameter. The increase in salinity from 2.0 dS m−1
to
2.3 dS m−1
cannot be explained by evaporation alone and the most likely explanation is the
inflow of saline drainage water from irrigated fields. Soil irrigated with wastewater were
observed to roughly accumulated 34 kg/ha/year (McCartney et al. 2008).
Environmental impact
On a first visit to the Musi River in the heart of the city one might easily conclude that the
growth of the city and the consequent large-scale disposal of wastewater into the river has
been an ecological disaster. Yet the river had long been dry, and one could argue that large
scale wastewater disposal has given the river a new life. The origin of the wastewater is
largely domestic and DO concentrations improved rapidly after 17 km. A benthic survey
along the river found that habitat conditions for macro-invertebrates improved rapidly, and
consequently greater taxa richness was found with increasing distance from the city. This
led to a greater diversity in the general bird population and in particular of water-fowl using
the river (IWMI, unpublished data). This, combined with clearly visible and measured
improvements in water quality, gave the impression that 40 km downstream of the city
there was a normal river ecology situated in an agricultural setting.
12. Conclusion
The city of Hyderabad disposed of very large quantities of untreated domestic sewage into
the dry bed of the Musi River. Sewage disposal had a mixed impact on downstream users.
Poor water quality had a negative impact on farmer health and possibly crop productivity,
though increased reliability and availability of irrigation water also had a positive impact on
local livelihoods. For most of the farmers, agriculture is their sole livelihood; to ban the use
of Musi River for irrigation would be highly undesirable. The eventual aim should be the
treatment of wastewater before it is used in agriculture in and around Hyderabad. However
in the mean time additional health protection measures like regular treatment programmes
with anthelmintic medication and improvements in local water supply and sanitation should
be implemented.
The natural remediation efficiency of the river system aided by the construction of
irrigation infrastructure, particularly weirs, was high and comparable to the treatment
efficiency of a well designed waste stabilization pond system. Hyderabad municipal council
intends to invest large amount of money into wastewater treatment technology. The
processes currently taking place in the Musi River could be taken into consideration before
large scale investments are undertaken in wastewater treatment technology in Hyderabad, as
complementary technology could save money and land in the city.
Acknowledgements Wastewater research in Hyderabad was supported from core money from the IWMI.
Simon Brooker is supported by a Wellcome Trust Advanced Training Fellowship (073656).
References
APHA-WWE-WEF (1998) Standard methods for the examination of water and wastewater. American Public
Health Association, Washington D.C
Ayres RM, Lee DL, Mara DD, Silva SA (1993) The accumulation, distribution and viability of human
parasitic nematode eggs in the sludge of a primary facultative waste stabilization pond. Trans R Soc Trop
Med Hyg 87:256–258
Ayres RM, Mara DD (1996) Analysis of wastewater for use in agriculture; a laboratory manual of
parasitological and bacteriological techniques. World Health Organisation, Geneva
Bhaskaran TR, Sampathkumaran MA, Sur TC, Radhakrishnan I (1956) Studies on the effect of sewage
treatment processes on the survival of intestinal parasites. Ind J Med Res 44:163–180
Blumenthal UJ, Cifuentes E, Bennett S, Quigley M, Ruiz-Palacios G (2001) The risk of enteric infections
associated with wastewater reuse: the effect of season and degree of storage of wastewater. Trans R Soc
Trop Med Hyg 95:131–137
Buechler S, Devi G (2003) Household food security and wastewater dependent livelihood activities along the
Musi-river in Andhra Pradesh, India: http://www.who.int/water_sanitation_health/wastewater/gwwu
foodsecurity.pdf (Accessed, December 2005)
Delgado C, Rosegrant M, Steinfeld H, Ehui S, Courbois C (1999) Livestock to 2020: the next food
revolution., International Food Policy Research Institute, Food and Agriculture Organization,
International Livestock Research Institute
Ensink JHJ (2006) Wastewater quality and the risk of hookworm infection in Pakistani and Indian sewage
farmers. PhD thesis, University of London
Ensink JHJ, Blumenthal UJ, Brooker S (2008) Wastewater quality and the risk of intestinal nematode
infection in sewage farming in Hyderabad, India. Am J Trop Med Hyg 79(4):561–567
Feachem R, Bradley D, Garelick H, Mara DD (1983) Sanitation and disease: health aspects of excreta and
wastewater management. John Wiley & Sons, Chichester
HACH (1997) Water analysis handbook. HACH company, Loveland
Hofstedt C (2005) Wastewater use in agriculture in Andhra Pradesh, India. An evaluation of irrigation water
quality in reference to associated health risks. Department of soil sciences, Swedish university of
agricultural sciences, Uppsala, p 61
13. HUDA (1994) Hyderabad master plan. Status paper, Hyderabad Urban Development Authority, Hyderabad
Juanico M, Shelef G (1991) The performance of stabilization reservoir as a function of design and operation
parameters. Wat Sci Tech 23:1509–1516
Katta MR (1997) Predatory industrialisation and environmental degradation: a case study of Musi-river.
Telangana: Dimensions of underdevelopment, Center for Telangana studies, Hyderabad, pp 203–212
Kumar RM (2003) Financing of wastewater treatment projects. Infrastructure development finance
corporation and confederation of Indian industries. Water Summit 2003
Kurien V (2004) India’s milk revolution -Investing in rural producer organizations. The World Bank, Gujarat
Lakshminaruyana JS, Abdulappa MK (1972) The effect of sewage stabilization ponds on helminths. In: Sastry
CA (ed) Low cost wastewater treatment. Central Public Health Engineering Research Institute, Nagpur
Mara D (1997) Design manual for waste stabilization ponds in India. Lagoon Technology International Ltd, Leeds
McCartney M, Scott C, Ensink J, Jiang B, Bigg T (2008) Salinity implications of wastewater irrigation in the
Musi river catchment in India. Cey J Sci (Bio Sci) 37:49–59
Otaki M, Okuda A, Tajima K, Iwasaki T, Kinoshita S, Ohgaki S (2003) Inactivation differences of
microorganisms by low pressure UV and pulsed xenon lamps. Wat Sci Tech 47:185–190
Panicker PVRC, Krishnamoorthi KP (1981) Parasitic egg and cyst reduction in oxidation ditchs and aerated
lagoon. J Wat Poll Cont Fed 53:1413–1419
Pescod MD (1992) Wastewater treatment and use in agriculture. Food and Agricultural Organization, Rome
Rhoades JD, Kandiah A, Mashali AM (1992) The use of saline waters for crop production. Food and
Agricultural Organization, Rome
Shaw E (1984) Hydrology in practice. Van Nostrand Reinhold (UK) Co. Ltd. Wokingham, 569 pp
UNPD (2003) http://esa.un.org/unup/ (Accessed July 2005)
van Rooijen DJ, Turral H, Bigg TW (2005) Sponge city: water balance of mega-city water use and
wastewater use in Hyderabad. India Irrig and Drain 54:S81–S91
Venkateswarlu V (1969) An ecological study of algae of the river Moosi, Hyderabad (India) with special
reference to water pollution. I. Physico-chemical complexes. Hydrobiologica 33:117–143
WHO (2006) Guidelines for the safe use of wastewater in agriculture. WHO, Geneva
Yoon CG, Kwun SK, Ham JH (2001) Effects of treated sewage irrigation on paddy rice culture and its soil.
Irrig and Drain 50:227–236