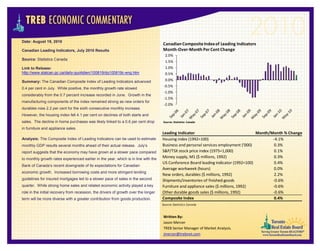
The Canadian Composite Index of Leading Indicators rose 0.4% in July, signaling slower monthly economic growth compared to earlier in the year. While manufacturing new orders remained strong, the housing index fell 4.1% due to declines in housing starts and sales. The slowdown in the housing sector was likely linked to a 0.6% drop in furniture and appliance sales.
Annie Williams Real Estate Report - September 2021Annie Williams
While off the highs reached in June, sales prices of single-family, re-sale homes are higher than the year before. The median sales price for single-family, re-sale homes was flat in August from July. It was up 11.y% year-over-year. The average sales price for single-family, re-sale homes fell 6.7% month-over-month. Yet, year-over-year it was up 4.5%.
Annie Williams Real Estate Report - October 2021Annie Williams
After being higher than the year before thirteen months in a row, sales of single-family, re-sale homes dipped 0.4% year-over-
year. Sales were down 2.9% from August. There were 238 homes sold in San Francisco last month. The average since 2000 is 214.
Arbor Realty's U.S. Economic Overview for 2018 q4 with insights on U.S. employment growth, the consumer price index, average earnings and the homeownership rate.
I want to share with you the latest edition of the Texas Family Office Association (“TFOA”) monthly economic update. The attached report includes a wealth of data and exhibits on the state of the USA economy and selected States. We hope you’ll find this useful. For more information, please visit www.tfoatx.com. Thank you
I want to share with you the latest edition of the Texas Family Office Association (“TFOA”) monthly economic update. The attached report includes a wealth of data and exhibits on the state of the USA economy and selected States. We hope you’ll find this useful. For more information, please visit www.tfoatx.com. Thank you!
The Metro Vancouver housing market saw steady home sale and listing activity in May, a shift back from the record-breaking activity seen in the earlier spring months.
Sales decreased 13% from APRIL 2021.
Stats provided by the real estate Board of Greater Vancouver
Annie Williams Real Estate Report - February 2021Annie Williams
Sales of single-family, re-sale homes rose again in January, gaining 59.4% year-over-year. They were down 42.7% from December. There were 153 homes sold in San Francisco last month. The average since 2000 is 214. The average sales price for homes fell 12.7% year-over-year. The median sales price for single-family, re-sale homes rose 7.4% year-over-year.
1. Date: August 19, 2010
Canadian Composite Index of Leading Indicators
Canadian Leading Indicators, July 2010 Results Month-Over-Month Per Cent Change
2.0%
Source: Statistics Canada
1.5%
Link to Release: 1.0%
http://www.statcan.gc.ca/daily-quotidien/100819/dq100819c-eng.htm 0.5%
Summary: The Canadian Composite Index of Leading Indicators advanced 0.0%
-0.5%
0.4 per cent in July. While positive, the monthly growth rate slowed
-1.0%
considerably from the 0.7 percent increase recorded in June. Growth in the
-1.5%
manufacturing components of the index remained strong as new orders for
-2.0%
durables rose 2.2 per cent for the sixth consecutive monthly increase.
However, the housing index fell 4.1 per cent on declines of both starts and
sales. The decline in home purchases was likely linked to a 0.6 per cent drop Source: Statistics Canada
in furniture and appliance sales.
Leading Indicator Month/Month % Change
Analysis: The Composite Index of Leading Indicators can be used to estimate Housing index (1992=100) -4.1%
monthly GDP results several months ahead of their actual release. July’s Business and personal services employment ('000) 0.3%
report suggests that the economy may have grown at a slower pace compared S&P/TSX stock price index (1975=1,000) 0.1%
to monthly growth rates experienced earlier in the year, which is in line with the
Money supply, M1 ($ millions, 1992) 0.3%
US Conference Board leading indicator (1992=100) 0.4%
Bank of Canada’s recent downgrade of its expectations for Canadian
Average workweek (hours) 0.0%
economic growth. Increased borrowing costs and more stringent lending
New orders, durables ($ millions, 1992) 2.2%
guidelines for insured mortgages led to a slower pace of sales in the second Shipments/inventories of finished goods -0.6%
quarter. While strong home sales and related economic activity played a key Furniture and appliance sales ($ millions, 1992) -0.6%
role in the initial recovery from recession, the drivers of growth over the longer Other durable goods sales ($ millions, 1992) -0.6%
term will be more diverse with a greater contribution from goods production. Composite Index 0.4%
Source: Statistics Canada
Written By:
Jason Mercer
TREB Senior Manager of Market Analysis.
jmercer@trebnet.com