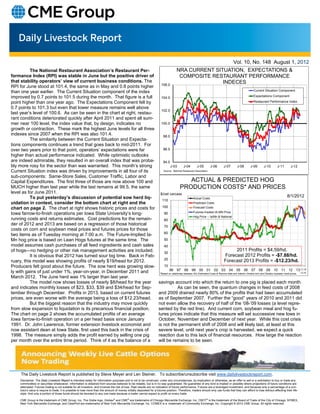
SlideShare a Scribd company logo
Vol. 10, No. 148 August 1, 2012
          The National Restaurant Association’s Restaurant Per-                                                                       NRA CURRENT SITUATION, EXPECTATIONS &
formance Index (RPI) was stable in June but the positive driver of                                                                     COMPOSITE RESTAURANT PERFORMANCE
that stability operators’ view of current business conditions. The                                                                                   INDECES
                                                                                                                         106.0
RPI for June stood at 101.4, the same as in May and 0.8 points higher
than one year earlier. The Current Situation component of the index                                                                                                                                       Current Situation Component

improved by 0.7 points to 101.5 during the month. That figure is a full                                                                                                                                   Expectations Component
                                                                                                                         104.0
point higher than one year ago. The Expectations Component fell by                                                                                                                                        Restaurant Performance Index
0.7 points to 101.3 but even that lower measure remains well above
                                                                                                                         102.0
last year’s level of 100.6. As can be seen in the chart at right, restau-
rant conditions deteriorated quickly after April 2011 and spent all sum-
mer near 100 level, the index value that, by design, indicates no                                                        100.0
growth or contraction. These mark the highest June levels for all three
indexes since 2007 when the RPI was also 101.4.                                                                           98.0
          The similarity between the Current Situation and Expecta-
tions components continues a trend that goes back to mid-2011. For
over two years prior to that point, operators’ expectations were far                                                      96.0
higher than actual performance indicated. While optimistic outlooks
are indeed admirable, they resulted in an overall index that was proba-                                                   94.0
bly more rosy for the sector than was warranted. This month’s strong                                                             J-03       J-04        J-05         J-06       J-07       J-08        J-09        J-10        J-11        J-12
Current Situation index was driven by improvements in all four of its                                                      Source: National Restaurant Association

sub-components: Same-Store Sales, Customer Traffic, Labor and
Capital Expenditures. The first three of those are now above 100 and                                                                        ACTUAL & PREDICTED HOG
MUCH higher than last year while the last remains at 99.5, the same                                                                      PRODUCTION COSTS* AND PRICES
level as for June 2011.                                                                                                 $/cwt carcass
          To put yesterday’s discussion of potential sow herd liq-                                                                                   Actual Costs
                                                                                                                                                                                                                                       8/1/2012
                                                                                                                         110
uidation in context, consider the bottom chart at right and the                                                                                      Predicted Costs
chart on page 2. The chart at right shows historic prices and costs for                                                  100                         Forecast Costs
                                                                                                                                                     Futures-Implied IA-MN Price
Iowa farrow-to-finish operations per Iowa State University’s long-                                                         90
                                                                                                                                                     Hog Price -- Ia/Mn & National
running costs and returns estimates. Cost predictions for the remain-                                                      80
der of 2012 and 2013 are based on a regression of those historical                                                         70
costs on corn and soybean meal prices and futures prices for those
                                                                                                                           60
two items as of Tuesday morning at 7:00 a.m. The Future-Implied Ia-
Mn hog price is based on Lean Hogs futures at the same time. The                                                           50
model assumes cash purchases of all feed ingredients and cash sales                                                        40
of hogs—no hedging or other risk management activities are included.                                                                                                                 2011 Profits = $4.59/hd.
                                                                                                                           30
          It is obvious that 2012 has turned sour big time. Back in Feb-                                                                                                        Forecast 2012 Profits = -$7.88/hd.
                                                                                                                           20
ruary, this model was showing profits of nearly $19/head for 2012.                                                                                                              Forecast 2013 Profits = -$12.23/hd.
Producers felt good about the future. The sow herd was growing slow-                                                       10
                                                                                                                                96    97     98    99     00     01    02     03    04     05    06     07    08     09     10    11     12    13‐17.18
ly with gains of just under 1%, year-on-year, in December 2011 and                                                      *Based on relationsip between ISU Estimated Costs & Returns data and historic Omaha corn and Decatur soybean meal prices   ‐12.42
March 2012. The June herd was 1% larger than last year.
          The model now shows losses of nearly $8/head for the year                                                    savings account into which the return to one pig is placed each month.
and indicates monthly losses of $23, $33, $39 and $34/head for Sep-                                                              As can be seen, the quantum changes in feed costs of 2008
tember through December. Profits in 2013, based on current futures                                                     and 2009 drained nearly 80% of the profits that had been accumulated
prices, are even worse with the average being a loss of $12.23/head.                                                   as of September 2007. Further the “good” years of 2010 and 2011 did
          But the biggest reason that the industry may move quickly                                                    not even allow the recovery of half of the ‘08-’09 losses (a level repre-
from slow expansion to liquidation is its precarious financial position.                                               sented by the red line). And current corn, soybean meal and hog fu-
The chart on page 2 shows the accumulated profits of an average                                                        tures prices indicate that this measure will set successive new lows in
Iowa farrow-to-finish operation on a per head basis since January                                                      October, November and December of next year. While this cost crisis
1991. Dr. John Lawrence, former extension livestock economist and                                                      is not the permanent shift of 2008 and will likely last, at least at this
now assistant dean at Iowa State, first used this back in the crisis of                                                severe level, until next year’s crop is harvested, we expect a quick
1998. The measure simply adds the profit earned by selling one pig                                                     reaction due to this lack of financial resources. How large the reaction
per month over the entire time period. Think of it as the balance of a                                                 will be remains to be seen.


     The Daily Livestock Report is published by Steve Meyer and Len Steiner. To subscribe/unsubscribe visit www.dailylivestockreport.com.
    Disclaimer: The Daily Livestock Report is intended solely for information purposes and is not to be construed, under any circumstances, by implication or otherwise, as an offer to sell or a solicitation to buy or trade any
    commodities or securities whatsoever. Information is obtained from sources believed to be reliable, but is in no way guaranteed. No guarantee of any kind is implied or possible where projections of future conditions are
    attempted. Futures trading is not suitable for all investors, and involves the risk of loss. Past results are no indication of future performance. Futures are a leveraged investment, and because only a percentage of a con-
    tract’s value is require to trade, it is possible to lose more than the amount of money initially deposited for a futures position. Therefore, traders should only use funds that they can afford to lose without affecting their life-
    style. And only a portion of those funds should be devoted to any one trade because a trader cannot expect to profit on every trade.

    CME Group is the trademark of CME Group, Inc. The Globe logo, Globex® and CME® are trademarks of Chicago Mercantile Exchange, Inc. CBOT® is the trademark of the Board of Trade of the City of Chicago. NYMEX,
    New York Mercantile Exchange, and ClearPort are trademarks of New York Mercantile Exchange. Inc. COMEX is a trademark of Commodity Exchange, Inc. Copyright © 2012 CME Group. All rights reserved.
Vol. 10, No. 148 August 1, 2012


                                                 ACCUMULATED PROFITS
                                           IOWA FARROW-TO-FINISH OPERATIONS
                                                           (Sum of the profits from selling one pig per month since January 1991)


      $900
                                  Top to Bottom:                                                                               Peak in Sept '07 = $786.87
      $800
                                Sept '07 to Feb '10
      $700                         Lost $639.68
      $600                      81% of peak amount
      $500
                                                                                                                       8 years
      $400
      $300
      $200
      $100
           $-
    $(100)
                                                                                                                                                                                         June '12 = $384.26
    $(200)
                      91 92 93 94 95 96 97 98 99 00 01 02 03 04 05 06 07 08 09 10 11 12 13

       Source: Paragon Economics, Inc. using data from Estimated Costs and Returns, Department of Economics, Iowa State University


The Daily Livestock Report is published by Steve Meyer and Len Steiner. To subscribe/unsubscribe visit www.dailylivestockreport.com.
Disclaimer: The Daily Livestock Report is intended solely for information purposes and is not to be construed, under any circumstances, by implication or otherwise, as an offer to sell or a solicitation to buy or trade any
commodities or securities whatsoever. Information is obtained from sources believed to be reliable, but is in no way guaranteed. No guarantee of any kind is implied or possible where projections of future conditions are
attempted. Futures trading is not suitable for all investors, and involves the risk of loss. Past results are no indication of future performance. Futures are a leveraged investment, and because only a percentage of a con-
tract’s value is require to trade, it is possible to lose more than the amount of money initially deposited for a futures position. Therefore, traders should only use funds that they can afford to lose without affecting their life-
style. And only a portion of those funds should be devoted to any one trade because a trader cannot expect to profit on every trade.

CME Group is the trademark of CME Group, Inc. The Globe logo, Globex® and CME® are trademarks of Chicago Mercantile Exchange, Inc. CBOT® is the trademark of the Board of Trade of the City of Chicago. NYMEX,
New York Mercantile Exchange, and ClearPort are trademarks of New York Mercantile Exchange. Inc. COMEX is a trademark of Commodity Exchange, Inc. Copyright © 2012 CME Group. All rights reserved.

More Related Content

Similar to Daily livestock report aug 1 2012

Daily livestock report sep 5 2012
Daily livestock report sep 5 2012Daily livestock report sep 5 2012
Daily livestock report sep 5 2012joseleorcasita
 
Daily livestock report oct 2 2012
Daily livestock report oct 2 2012Daily livestock report oct 2 2012
Daily livestock report oct 2 2012joseleorcasita
 
Daily livestock report nov 2 2012
Daily livestock report nov 2 2012Daily livestock report nov 2 2012
Daily livestock report nov 2 2012joseleorcasita
 
Daily livestock report jan 3 2013
Daily livestock report jan 3 2013Daily livestock report jan 3 2013
Daily livestock report jan 3 2013joseleorcasita
 
Daily livestock report mar 04 2013
Daily livestock report mar 04 2013Daily livestock report mar 04 2013
Daily livestock report mar 04 2013joseleorcasita
 
Credit suisse bac cs-1
Credit suisse bac cs-1Credit suisse bac cs-1
Credit suisse bac cs-1gro77
 
3 Reasons Why IT Pricing Should Not Increase final
3 Reasons Why IT Pricing Should Not Increase final3 Reasons Why IT Pricing Should Not Increase final
3 Reasons Why IT Pricing Should Not Increase final
Everest Group
 
AEP Q4 2010 Earnings Presentation
AEP Q4 2010 Earnings Presentation AEP Q4 2010 Earnings Presentation
AEP Q4 2010 Earnings Presentation
American Electric Power
 
AEP | Credit Suisse 2011 Energy Summit
AEP | Credit Suisse 2011 Energy SummitAEP | Credit Suisse 2011 Energy Summit
AEP | Credit Suisse 2011 Energy Summit
American Electric Power
 
Daily livestock report oct 16 2012
Daily livestock report oct 16 2012Daily livestock report oct 16 2012
Daily livestock report oct 16 2012joseleorcasita
 
Daily livestock report july 19 2012
Daily livestock report july 19 2012Daily livestock report july 19 2012
Daily livestock report july 19 2012joseleorcasita
 
Ifc investor presentation_june_2011
Ifc investor presentation_june_2011Ifc investor presentation_june_2011
Ifc investor presentation_june_2011Intact
 
IFC Investor Presentation June 2011
IFC Investor Presentation June 2011IFC Investor Presentation June 2011
IFC Investor Presentation June 2011Intact
 
Astm restore cli update nov 2010
Astm restore cli update nov 2010Astm restore cli update nov 2010
Astm restore cli update nov 2010
James Hilbert
 
Conference presentation draft v 4.11
Conference presentation draft v 4.11Conference presentation draft v 4.11
Conference presentation draft v 4.11Daniel Novichkov
 

Similar to Daily livestock report aug 1 2012 (16)

Daily livestock report sep 5 2012
Daily livestock report sep 5 2012Daily livestock report sep 5 2012
Daily livestock report sep 5 2012
 
Daily livestock report oct 2 2012
Daily livestock report oct 2 2012Daily livestock report oct 2 2012
Daily livestock report oct 2 2012
 
Daily livestock report nov 2 2012
Daily livestock report nov 2 2012Daily livestock report nov 2 2012
Daily livestock report nov 2 2012
 
Daily livestock report jan 3 2013
Daily livestock report jan 3 2013Daily livestock report jan 3 2013
Daily livestock report jan 3 2013
 
Daily livestock report mar 04 2013
Daily livestock report mar 04 2013Daily livestock report mar 04 2013
Daily livestock report mar 04 2013
 
Credit suisse bac cs-1
Credit suisse bac cs-1Credit suisse bac cs-1
Credit suisse bac cs-1
 
3 Reasons Why IT Pricing Should Not Increase final
3 Reasons Why IT Pricing Should Not Increase final3 Reasons Why IT Pricing Should Not Increase final
3 Reasons Why IT Pricing Should Not Increase final
 
AEP Q4 2010 Earnings Presentation
AEP Q4 2010 Earnings Presentation AEP Q4 2010 Earnings Presentation
AEP Q4 2010 Earnings Presentation
 
AEP | Credit Suisse 2011 Energy Summit
AEP | Credit Suisse 2011 Energy SummitAEP | Credit Suisse 2011 Energy Summit
AEP | Credit Suisse 2011 Energy Summit
 
Daily livestock report oct 16 2012
Daily livestock report oct 16 2012Daily livestock report oct 16 2012
Daily livestock report oct 16 2012
 
Daily livestock report july 19 2012
Daily livestock report july 19 2012Daily livestock report july 19 2012
Daily livestock report july 19 2012
 
Ifc investor presentation_june_2011
Ifc investor presentation_june_2011Ifc investor presentation_june_2011
Ifc investor presentation_june_2011
 
IFC Investor Presentation June 2011
IFC Investor Presentation June 2011IFC Investor Presentation June 2011
IFC Investor Presentation June 2011
 
Ratio Analysis
Ratio AnalysisRatio Analysis
Ratio Analysis
 
Astm restore cli update nov 2010
Astm restore cli update nov 2010Astm restore cli update nov 2010
Astm restore cli update nov 2010
 
Conference presentation draft v 4.11
Conference presentation draft v 4.11Conference presentation draft v 4.11
Conference presentation draft v 4.11
 

More from joseleorcasita

Inac boletin semanal 24082013
Inac boletin semanal 24082013Inac boletin semanal 24082013
Inac boletin semanal 24082013joseleorcasita
 
Bcr boletin informativo 23082013
Bcr boletin informativo 23082013Bcr boletin informativo 23082013
Bcr boletin informativo 23082013joseleorcasita
 
Bcr informativo semanal 19042013
Bcr informativo semanal 19042013Bcr informativo semanal 19042013
Bcr informativo semanal 19042013joseleorcasita
 
Inac boletin semanal 13042013
Inac boletin semanal 13042013Inac boletin semanal 13042013
Inac boletin semanal 13042013joseleorcasita
 
Daily livestock report apr 19 2013
Daily livestock report apr 19 2013Daily livestock report apr 19 2013
Daily livestock report apr 19 2013joseleorcasita
 
Daily livestock report apr 18 2013
Daily livestock report apr 18 2013Daily livestock report apr 18 2013
Daily livestock report apr 18 2013joseleorcasita
 
Daily livestock report apr 17 2013
Daily livestock report apr 17 2013Daily livestock report apr 17 2013
Daily livestock report apr 17 2013joseleorcasita
 
Daily livestock report apr 16 2013
Daily livestock report apr 16 2013Daily livestock report apr 16 2013
Daily livestock report apr 16 2013joseleorcasita
 
Daily livestock report apr 15 2013
Daily livestock report apr 15 2013Daily livestock report apr 15 2013
Daily livestock report apr 15 2013joseleorcasita
 
Usda report april 2013
Usda report april 2013Usda report april 2013
Usda report april 2013joseleorcasita
 
Daily livestock report apr 12 2013
Daily livestock report apr 12 2013Daily livestock report apr 12 2013
Daily livestock report apr 12 2013joseleorcasita
 
Daily livestock report apr 11 2013
Daily livestock report apr 11 2013Daily livestock report apr 11 2013
Daily livestock report apr 11 2013joseleorcasita
 
Daily livestock report apr 10 2013
Daily livestock report apr 10 2013Daily livestock report apr 10 2013
Daily livestock report apr 10 2013joseleorcasita
 

More from joseleorcasita (20)

Bcr boletin 06092013
Bcr boletin 06092013Bcr boletin 06092013
Bcr boletin 06092013
 
Inac boletin 31082013
Inac boletin 31082013Inac boletin 31082013
Inac boletin 31082013
 
Boletim do leite 221
Boletim do leite 221Boletim do leite 221
Boletim do leite 221
 
Boletim do leite 220
Boletim do leite 220Boletim do leite 220
Boletim do leite 220
 
Boletim do leite 219
Boletim do leite 219Boletim do leite 219
Boletim do leite 219
 
Boletim do leite 218
Boletim do leite 218Boletim do leite 218
Boletim do leite 218
 
Boletim do leite 217
Boletim do leite 217Boletim do leite 217
Boletim do leite 217
 
Inac boletin semanal 24082013
Inac boletin semanal 24082013Inac boletin semanal 24082013
Inac boletin semanal 24082013
 
Bcr boletin informativo 23082013
Bcr boletin informativo 23082013Bcr boletin informativo 23082013
Bcr boletin informativo 23082013
 
Bcr informativo semanal 19042013
Bcr informativo semanal 19042013Bcr informativo semanal 19042013
Bcr informativo semanal 19042013
 
Inac boletin semanal 13042013
Inac boletin semanal 13042013Inac boletin semanal 13042013
Inac boletin semanal 13042013
 
Daily livestock report apr 19 2013
Daily livestock report apr 19 2013Daily livestock report apr 19 2013
Daily livestock report apr 19 2013
 
Daily livestock report apr 18 2013
Daily livestock report apr 18 2013Daily livestock report apr 18 2013
Daily livestock report apr 18 2013
 
Daily livestock report apr 17 2013
Daily livestock report apr 17 2013Daily livestock report apr 17 2013
Daily livestock report apr 17 2013
 
Daily livestock report apr 16 2013
Daily livestock report apr 16 2013Daily livestock report apr 16 2013
Daily livestock report apr 16 2013
 
Daily livestock report apr 15 2013
Daily livestock report apr 15 2013Daily livestock report apr 15 2013
Daily livestock report apr 15 2013
 
Usda report april 2013
Usda report april 2013Usda report april 2013
Usda report april 2013
 
Daily livestock report apr 12 2013
Daily livestock report apr 12 2013Daily livestock report apr 12 2013
Daily livestock report apr 12 2013
 
Daily livestock report apr 11 2013
Daily livestock report apr 11 2013Daily livestock report apr 11 2013
Daily livestock report apr 11 2013
 
Daily livestock report apr 10 2013
Daily livestock report apr 10 2013Daily livestock report apr 10 2013
Daily livestock report apr 10 2013
 

Daily livestock report aug 1 2012

  • 1. Vol. 10, No. 148 August 1, 2012 The National Restaurant Association’s Restaurant Per- NRA CURRENT SITUATION, EXPECTATIONS & formance Index (RPI) was stable in June but the positive driver of COMPOSITE RESTAURANT PERFORMANCE that stability operators’ view of current business conditions. The INDECES 106.0 RPI for June stood at 101.4, the same as in May and 0.8 points higher than one year earlier. The Current Situation component of the index Current Situation Component improved by 0.7 points to 101.5 during the month. That figure is a full Expectations Component 104.0 point higher than one year ago. The Expectations Component fell by Restaurant Performance Index 0.7 points to 101.3 but even that lower measure remains well above 102.0 last year’s level of 100.6. As can be seen in the chart at right, restau- rant conditions deteriorated quickly after April 2011 and spent all sum- mer near 100 level, the index value that, by design, indicates no 100.0 growth or contraction. These mark the highest June levels for all three indexes since 2007 when the RPI was also 101.4. 98.0 The similarity between the Current Situation and Expecta- tions components continues a trend that goes back to mid-2011. For over two years prior to that point, operators’ expectations were far 96.0 higher than actual performance indicated. While optimistic outlooks are indeed admirable, they resulted in an overall index that was proba- 94.0 bly more rosy for the sector than was warranted. This month’s strong J-03 J-04 J-05 J-06 J-07 J-08 J-09 J-10 J-11 J-12 Current Situation index was driven by improvements in all four of its Source: National Restaurant Association sub-components: Same-Store Sales, Customer Traffic, Labor and Capital Expenditures. The first three of those are now above 100 and ACTUAL & PREDICTED HOG MUCH higher than last year while the last remains at 99.5, the same PRODUCTION COSTS* AND PRICES level as for June 2011. $/cwt carcass To put yesterday’s discussion of potential sow herd liq- Actual Costs 8/1/2012 110 uidation in context, consider the bottom chart at right and the Predicted Costs chart on page 2. The chart at right shows historic prices and costs for 100 Forecast Costs Futures-Implied IA-MN Price Iowa farrow-to-finish operations per Iowa State University’s long- 90 Hog Price -- Ia/Mn & National running costs and returns estimates. Cost predictions for the remain- 80 der of 2012 and 2013 are based on a regression of those historical 70 costs on corn and soybean meal prices and futures prices for those 60 two items as of Tuesday morning at 7:00 a.m. The Future-Implied Ia- Mn hog price is based on Lean Hogs futures at the same time. The 50 model assumes cash purchases of all feed ingredients and cash sales 40 of hogs—no hedging or other risk management activities are included. 2011 Profits = $4.59/hd. 30 It is obvious that 2012 has turned sour big time. Back in Feb- Forecast 2012 Profits = -$7.88/hd. 20 ruary, this model was showing profits of nearly $19/head for 2012. Forecast 2013 Profits = -$12.23/hd. Producers felt good about the future. The sow herd was growing slow- 10 96 97 98 99 00 01 02 03 04 05 06 07 08 09 10 11 12 13‐17.18 ly with gains of just under 1%, year-on-year, in December 2011 and *Based on relationsip between ISU Estimated Costs & Returns data and historic Omaha corn and Decatur soybean meal prices ‐12.42 March 2012. The June herd was 1% larger than last year. The model now shows losses of nearly $8/head for the year savings account into which the return to one pig is placed each month. and indicates monthly losses of $23, $33, $39 and $34/head for Sep- As can be seen, the quantum changes in feed costs of 2008 tember through December. Profits in 2013, based on current futures and 2009 drained nearly 80% of the profits that had been accumulated prices, are even worse with the average being a loss of $12.23/head. as of September 2007. Further the “good” years of 2010 and 2011 did But the biggest reason that the industry may move quickly not even allow the recovery of half of the ‘08-’09 losses (a level repre- from slow expansion to liquidation is its precarious financial position. sented by the red line). And current corn, soybean meal and hog fu- The chart on page 2 shows the accumulated profits of an average tures prices indicate that this measure will set successive new lows in Iowa farrow-to-finish operation on a per head basis since January October, November and December of next year. While this cost crisis 1991. Dr. John Lawrence, former extension livestock economist and is not the permanent shift of 2008 and will likely last, at least at this now assistant dean at Iowa State, first used this back in the crisis of severe level, until next year’s crop is harvested, we expect a quick 1998. The measure simply adds the profit earned by selling one pig reaction due to this lack of financial resources. How large the reaction per month over the entire time period. Think of it as the balance of a will be remains to be seen. The Daily Livestock Report is published by Steve Meyer and Len Steiner. To subscribe/unsubscribe visit www.dailylivestockreport.com. Disclaimer: The Daily Livestock Report is intended solely for information purposes and is not to be construed, under any circumstances, by implication or otherwise, as an offer to sell or a solicitation to buy or trade any commodities or securities whatsoever. Information is obtained from sources believed to be reliable, but is in no way guaranteed. No guarantee of any kind is implied or possible where projections of future conditions are attempted. Futures trading is not suitable for all investors, and involves the risk of loss. Past results are no indication of future performance. Futures are a leveraged investment, and because only a percentage of a con- tract’s value is require to trade, it is possible to lose more than the amount of money initially deposited for a futures position. Therefore, traders should only use funds that they can afford to lose without affecting their life- style. And only a portion of those funds should be devoted to any one trade because a trader cannot expect to profit on every trade. CME Group is the trademark of CME Group, Inc. The Globe logo, Globex® and CME® are trademarks of Chicago Mercantile Exchange, Inc. CBOT® is the trademark of the Board of Trade of the City of Chicago. NYMEX, New York Mercantile Exchange, and ClearPort are trademarks of New York Mercantile Exchange. Inc. COMEX is a trademark of Commodity Exchange, Inc. Copyright © 2012 CME Group. All rights reserved.
  • 2. Vol. 10, No. 148 August 1, 2012 ACCUMULATED PROFITS IOWA FARROW-TO-FINISH OPERATIONS (Sum of the profits from selling one pig per month since January 1991) $900 Top to Bottom: Peak in Sept '07 = $786.87 $800 Sept '07 to Feb '10 $700 Lost $639.68 $600 81% of peak amount $500 8 years $400 $300 $200 $100 $- $(100) June '12 = $384.26 $(200) 91 92 93 94 95 96 97 98 99 00 01 02 03 04 05 06 07 08 09 10 11 12 13 Source: Paragon Economics, Inc. using data from Estimated Costs and Returns, Department of Economics, Iowa State University The Daily Livestock Report is published by Steve Meyer and Len Steiner. To subscribe/unsubscribe visit www.dailylivestockreport.com. Disclaimer: The Daily Livestock Report is intended solely for information purposes and is not to be construed, under any circumstances, by implication or otherwise, as an offer to sell or a solicitation to buy or trade any commodities or securities whatsoever. Information is obtained from sources believed to be reliable, but is in no way guaranteed. No guarantee of any kind is implied or possible where projections of future conditions are attempted. Futures trading is not suitable for all investors, and involves the risk of loss. Past results are no indication of future performance. Futures are a leveraged investment, and because only a percentage of a con- tract’s value is require to trade, it is possible to lose more than the amount of money initially deposited for a futures position. Therefore, traders should only use funds that they can afford to lose without affecting their life- style. And only a portion of those funds should be devoted to any one trade because a trader cannot expect to profit on every trade. CME Group is the trademark of CME Group, Inc. The Globe logo, Globex® and CME® are trademarks of Chicago Mercantile Exchange, Inc. CBOT® is the trademark of the Board of Trade of the City of Chicago. NYMEX, New York Mercantile Exchange, and ClearPort are trademarks of New York Mercantile Exchange. Inc. COMEX is a trademark of Commodity Exchange, Inc. Copyright © 2012 CME Group. All rights reserved.