1. Reliability and residual strength of double hull tankers designed according to
the new IACS common structural rules
A.W. Hussein, C. Guedes Soares Ã
Centre for Marine Technology and Engineering (CENTEC), Technical University of Lisbon, Instituto Superior Te´cnico, Av. Rovisco Pais, 1049-001 Lisboa, Portugal
a r t i c l e i n f o
Article history:
Received 24 July 2008
Accepted 16 April 2009
Available online 3 May 2009
Keywords:
Ship structural reliability
Damaged ships
Longitudinal strength
a b s t r a c t
This paper studies the residual strength of three double hull tankers designed according to the new
International Association of Classification Societies (IACS) common structural rules (CSR). Different
damage scenarios at side and bottom are considered with different damage size to define a lower limit
of strength which might be accounted for during design. The residual strength is calculated using
progressive collapse method (PCM) and applying the failure modes defined in the new rules. The
reduction in section modulus (SM) due to damage is considered to check whether the section modulus
is still acceptable after damage. A design modification factor (DMF) is applied to the deck thickness to
compensate for the strength lost with damage. The reliability of the three ships is calculated considering
the worst scenarios. The change in the still-water bending due to damage is taken into account while
calculating the reliability. The effect of damage on the reliability is also studied.
& 2009 Elsevier Ltd. All rights reserved.
1. Introduction
In the new common structural rules (CSR), (IACS, 2006) four
limit states are considered: serviceability, ultimate, fatigue and
accidental limit states. The limit states are conditions that will
cause a particular structural member or a system to experience
performance failure. The limit state designs consider various
conditions under which a structure may fail to function, and
account for the uncertainties associated with determining the
safety margins. It is also considered more accurate than the
traditional allowable stress designs.
The accidental limit state design is based on safety and
environmental objectives. There could be many combinations
of these objectives, such as loss of life prevention, injury or loss
prevention, property damage prevention or mitigation, environ-
mental pollution prevention or mitigation. Structural design
criteria have been based on meeting these defined objectives.
Ship collision and grounding accidents will continue to happen
no matter how a ship is designed, constructed and operated. It
became very important to assess damages and their associated
probability levels, to minimize the consequences of the accidents
and to suggest ways of improving damage resistance in design.
Accidents could be sufficiently severe to cause major structural
damage, loss of life or property and pollution. Above all, a ship
may collapse after a collision or grounding because of inadequate
longitudinal strength.
A damaged ship may collapse after a collision or grounding if
she does not have adequate longitudinal strength. Calculating the
ultimate strength after damage is important to determine the
options for recovery.
The Prestige’s accident, in 2002, showed the importance of a
reliable assessment of the damaged vessels’ longitudinal strength
in real emergency situations and time pressure. Therefore, it is
important to keep the residual strength at a certain level to avoid
additional catastrophic consequences.
Paik et al. (1998) developed a fast method for exploring the
possibility of hull girder breakage after collision or grounding.
The authors defined the residual strength index based either on
the section modulus (SM) or the ultimate bending strength. The
proposed procedure was applied to residual strength assessment
of a hypothetical PANAMAX bulk carrier after collision and
grounding. The authors concluded that the procedure is useful
for assessing the reserve and residual strength of ships in
damaged conditions.
Gordo and Guedes Soares (2000) studied the strength of two
different designs of tankers. The authors concluded that the
hogging moment is much more affected by bottom damage than
the sagging moment. For a single hull tanker 326 m long, reduction
of 13% of the cross-section area, due to damage, led to 7% loss of the
sagging ultimate moment and 29% loss in the hogging ultimate
moment. While for a double hull tanker 168 m long, 9.4% reduction
in the cross-section area led to 4% loss in the sagging bending
moment and 14.1% loss in the hogging bending moment.
ARTICLE IN PRESS
Contents lists available at ScienceDirect
journal homepage: www.elsevier.com/locate/oceaneng
Ocean Engineering
0029-8018/$ - see front matter & 2009 Elsevier Ltd. All rights reserved.
doi:10.1016/j.oceaneng.2009.04.006
à Corresponding author.
E-mail address: guedess@mar.ist.utl.pt (C. Guedes Soares).
Ocean Engineering 36 (2009) 1446–1459
2. Wang et al. (2000) studied the residual strength of damaged
ships. It was found that for double hull tankers, a 10% loss of
bottom results in a 4.4% loss in section modulus to the bottom, a
4% loss in section modulus to the deck, a 2.7% loss of ultimate
strength under hogging conditions and a 2.2% loss in ultimate
strength under sagging conditions. For bulk carriers, a 10% loss of
bottom results in a 4.2% loss in section modulus to the bottom, a
0.9% loss in section modulus to the deck, a 2.7% loss of ultimate
strength under hogging conditions and a 1.5% loss in ultimate
strength under sagging conditions. For single hull tankers, a 10%
loss of bottom results in a 6.7% loss in section modulus to the
bottom, a 1.7% loss in section modulus to the deck, a 4.5% loss of
ultimate strength under hogging conditions and a 3.9% loss in
ultimate strength under sagging conditions.
Wang et al. (2002a) reviewed the state-of-the-art research on
collision and grounding. The paper focused on the three issues
that a standard for design against accidents needs to address:
definition of accident scenarios, evaluation approaches and
acceptance criteria. Residual strength of damaged ships can be
estimated using simple formulae, simplified analytical methods,
or non-linear FEM techniques of different complexity. Perfor-
mance of a ship in an accident can be measured by energy
dissipation, penetration depth, quantity of oil outflow or residual
hull girder strength. Acceptance criteria should be established on
extensive studies, and provides a means for balancing numerous
variables to achieve an optimal solution.
Wang et al. (2002b) derived an analytical equation for the
residual hull girder strength and it was verified with direct
calculations of sample commercial ships for a broad spectrum of
accidents. Simple equations correlating residual strength with
damage extent were given.
Fang and Das (2005) studied the relationship between the risk
evaluation and structural reliability, and then reviewed the
evolution of structural reliability applied to ship structures. The
authors presented the limit state function of a damaged ship with
consideration of the special situations after collision and ground-
ing. The failure probabilities of damaged ship were obtained based
on the Monte Carlo simulation technique, given different damage
scenarios and external loads conditions.
Luı´s et al. (2006) studied the longitudinal strength reliability of
a grounded SUEZMAX double hull tanker. Different sizes of
damage were analyzed which extended up to 20% of the breadth.
The strength was assessed for two cases: when the outer bottom
is damaged and when the inner bottom was also damaged, which
was called major damage.
This paper studies the ultimate strength of three double hull
tankers designed according to the new International Association
of Classification Societies (IACS) common structural rules. The
ultimate strength calculations are based on the net scan-
tlings+50% corrosion addition defined in the rules. The ultimate
bending moment is calculated using the progressive collapse
method (PCM). The stress–strain curves and the failure modes are
defined according to the new IACS CSR.
Damaged ships are studied considering different scenarios of
collision and damage with different sizes. The residual strength
of each scenario is calculated to define the most critical location of
damage. The loss in the midship section modulus is calculated to
check its compliance with the minimum rule requirements.
Considering the loss due to damage, a design modification factor
(DMF) can be imposed to the deck plating to increase the intact
ultimate strength so that the residual strength will remain within
an acceptable range after damage.
The reliability of the damaged ship is calculated and compared
with the intact ship reliability. The ultimate bending moment is
calculated using progressive collapse method, the still-water
bending moment (SWBM) is calculated using IACS rules and the
wave bending moment is used as the rule value with probability
of exceedance 10À8
.
2. Existing design standards
The risks of damage and collision were usually addressed in
damage stability and subdivision requirements. These rules and
regulations are mostly prescriptive in nature, and often address
individual events separately. Over the past decades, the structural
engineering design community has increasingly applied limit
state and risk assessment methodology which takes into account
during design the risk of ship damage and its consequences on the
ship integrity.
Traditionally, ship collisions and groundings have been related
to damage stability or cargo spill from damaged hulls. Recently,
more attention has been given to a vessel’s structural strength to
an accident. There is also more focus on the impact that structural
designs have on the extent of resulting damage and the
consequential loss of stability, oil outflow and residual strength.
The principles of collision and grounding design standards are
composed of many elements. First, it should be defined how and
why accidents occur. This includes defining accident scenarios and
probability of occurrence of certain types of accidents. Second,
studying what would happen to the structure when a collision or
grounding occurs, structurally wise. This includes defining the
structural mechanics in collisions and groundings. The third
element is the expected consequences of structural damage. This
might be property damages, environmental damages, loss of life
or maybe a catastrophic combination of all of these. Fourth,
studying how accidents can be prevented, a structural damage is
minimized and a damage consequence be mitigated.
Germanischer Lloyd (GL) has a class notation COLL that ranks
the collision resistance of ships (GL, 2004). To date, GL has
assigned the COLL notation to about 60 ships. The collision
resistance is measured by comparing a vessel’s strengthened side
to another vessel’s non-strengthened single hull. Analyses of a
struck ship’s energy absorption are based on two different striking
bows (with and without a bulb), four draught differences of both
striking and struck vessels, and assumed probability of these draft
differences.
The American Bureau of Shipping (ABS) has a class notation
RES for SafeHull vessels that demonstrate adequate residual hull
girder strength after a collision or grounding accident. Dozens of
tankers have been built with this RES notation. The ABS ‘‘Guide for
assessing hull girder residual strength’’ (ABS, 1995) provides
guidelines and assumptions for facilitating an assessment of
structural redundancy and hull girder residual strength. This
notation requires a ship to maintain a minimum hull girder
residual strength after sustaining structural damages in the
prescribed most unfavorable condition. This minimum strength
will help to prevent or substantially reduce the risk of a major oil
spill, ship loss due to a post-accident collapse, or disintegration of
the hull during a tow or rescue operation.
The International Association of Classification Societies has
developed a series of Unified Requirements for bulk carriers that
directly require adequate structural strength in flooded condi-
tions. Structures of various levels (hull girders, double bottoms
and corrugated bulkheads) are required to prove their capability
in flooded conditions. Though events that lead to flooding of holds
are not defined, some of these IACS Unified Requirements are
intended to design against accidents, including collision or
grounding prevention as possible accident scenarios.
With limited exceptions (GL and ABS), structural designs do
not consider collisions and groundings. The International Mari-
time Organization (IMO) is developing ‘‘Goal-Based Standards’’
ARTICLE IN PRESS
A.W. Hussein, C. Guedes Soares / Ocean Engineering 36 (2009) 1446–1459 1447
3. (GBS) for new ship construction. Traditionally, IMO and various
maritime administrations have not developed structural stan-
dards. Instead, they have relied on classification societies to
develop such standards. However, through GBS, IMO is attempting
to define certain ‘‘high level’’ goals that must be met. While this
effort is in its early stages, the current discussions at IMO do not
include structural performance of ship structures in collisions and
groundings (Wang et al., 2000, 2006).
The IMO developed a procedural concept for approving
alternative tank arrangement (IMO, 2002). This IMO document
has a basic philosophy of comparing the critical deformation
energy from the case of a side collision with a strengthened design
to that of a double hull design, complying with the damage
stability calculations. IMO (2002) explicitly requires minimum
structural crashworthiness for transporting nuclear fuel and
nuclear waste on international waters.
The recent IACS common scantling rules projects involve re-
vamping structural design codes for tankers and bulk carriers. The
development clearly shows the tendency of moving towards limit
state design, even though collisions and groundings are not yet
considered in structural designs. Certain IACS requirements
indirectly take into account strength of bulk carriers with flooded
compartment.
3. Intact ultimate strength
The moment–curvature curve is obtained by means of an
incremental–iterative approach based on the principles of Smith’s
method (Smith, 1977). The bending moment Mi that acts on the
hull girder transverse section due to the imposed curvature ki is
calculated for each step of the incremental procedure. This
imposed curvature corresponds to an angle of rotation of the hull
girder transverse section about its effective horizontal neutral
axis, which induces an axial strain e in each hull structural
element. In the sagging condition, the structural elements below
the neutral axis are lengthened, whilst elements above the neutral
axis are shortened.
The stress s induced in each structural element by the strain e
is obtained from the stress–strain curve s–e of the element, which
takes into account the behavior of the structural element in the
non-linear elasto-plastic domain. The force in each structural
element is obtained from its area times the stress and these forces
are summed to derive the total axial force on the transverse
section. The element area is taken as the total net area of the
structural element. To achieve equilibrium, the summations of the
forces above and below the neutral axis have to be equal. The total
forces above and below the original neutral axis may not be equal
as the effective neutral axis may have moved due to the non-linear
response. Hence, it is necessary to adjust the neutral axis position,
recalculate the element strains, forces and total sectional force
and iterate until the total force above and below the neutral axis
are equal.
Once the position of the new neutral axis is known, then
the correct stress distribution in the structural elements is
obtained. The bending moment Mi about the new neutral axis
due to the imposed curvature ki is then obtained by summing the
moment contribution given by the force in each structural
element.
Mi ¼
X
sj Aj jzj À zNAÀij (1)
In applying the procedure described above, the following
assumptions are to be made:
the ultimate strength is calculated at a hull girder transverse
section between two adjacent transverse webs.
The hull girder transverse section remains plane during each
curvature increment.
The material properties of steel are assumed to be elastic,
perfectly plastic.
The hull girder transverse section can be divided into a set of
elements which act independently of each other.
The elements making up the hull girder transverse section are:
(a) longitudinal stiffeners with attached plating,
(b) transversely stiffened plate panels,
(c) hard corners.
The following structural areas are to be defined as hard corners:
(a) the plating area adjacent to intersecting plates,
(b) the plating area adjacent to knuckles in the plating with an
angle greater than 301,
(c) plating in rounded sections.
The plate panels and stiffeners are assumed to fail according to
one of the failure modes specified in Table 1. The hard corners are
assumed to buckle and fail in an elastic-perfect plastic manner.
The method just described was coded in a program to estimate
the vertical ultimate bending moment, following the failure
modes presented in the new common structural rules CSR
(Table 1). This method will be referred as IACSi method. The
method was checked by comparing its results with other
methods, i.e. HULLCOL (Gordo et al., 1996) and MARS2000 (BV,
2000) as described in Hussein et al. (2007).
4. Study cases
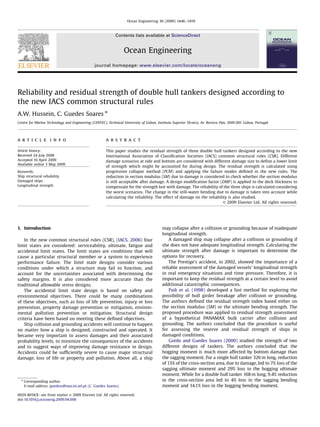
Three double hull tankers are under study, as shown in
Figs. 1–3. The principal dimensions of the three ships are
presented in Table 2. The ultimate strength of the three ships is
calculated in intact condition to define the pre-damage strength.
The used scantlings are the net scantlings+50% of the corrosion
addition according to CSR, tnet50. These scantlings are the strength
scantling as defined in the new CSR which corresponds to the
minimum strength the ship might has and which is considered
during design phase.
The intact ultimate strength and section modulus at deck and
bottom are presented in Table 3. The ultimate strength is
calculated using the developed code applying the progressive
collapse method.
ARTICLE IN PRESS
Table 1
Failure modes according to IACS CSR.
Element Failure mode
Lengthened transversely framed plate panels or
stiffeners (tension)
Elastic perfectly plastic failure
Shortened stiffeners (compression) Beam column buckling
Torsional buckling
Web local buckling of
flanged profile
Web local buckling bars
Shortened transversely framed plate Plate buckling
A.W. Hussein, C. Guedes Soares / Ocean Engineering 36 (2009) 1446–14591448
4. 5. Damaged ultimate strength
Damaged structures are unable to carry longitudinal stresses
and should be excluded from the calculation of the ultimate
bending moment. The inner hull is considered the final
barrier separating the oil from sea. It is assumed to withstand
longitudinal stresses. In this study, the vertical damage extent
of the hull is considered to be less than the double hull
height.
ABS (1995) considers that for grounding on rocky sea bed there
is considerable rupture of the double bottom structure. The
damaged bottom structure is assumed to be in the most unfavorable
location anywhere on the flat bottom within the fore part of the hull
between 0.5 and 0.2 L aft from F.P. Bottom structures are assumed to
be damaged over a considerable length and the damaged members
should be excluded from the hull girder. The bottom shell plating for
a width 4 m or B/6, whichever is greater, are assumed to be
damaged. The attached girders and the bottom longitudinals within
this area are to be damaged and inactive.
Collision is considered with another ship on one side which
results in extensive rupture on the side structure. It is assumed in
the most favorable location anywhere between 0.15 L aft from F.P.
and 0.2 L forward from the A.P. The collision is assumed to be
located at the upper part of the side shell, down from the stringer
plate of the strength deck. The shell plating for the vertical extend
of 4 m or D/4, whichever is greater, and the attached girders and
side longitudinals are to be damaged and inactive.
Smith’s method has been extensively used to determine hull
girder ultimate strength of the intact ship. Many authors
calculated the ultimate strength of the damaged ship by Smith’s
method too (Gordo and Guedes Soares, 1996, 1997, 2000; Fang and
ARTICLE IN PRESS
Fig. 1. Tanker 1 with L ¼ 320 m.
Fig. 2. Tanker 2 with L ¼ 264 m.
Fig. 3. Tanker 3 with L ¼ 233 m.
Table 2
Ship properties.
Tanker 1 Tanker 2 Tanker 3
LBP(m) 320 264 233
B (m) 58 45.1 42
D (m) 31 23.8 20.0
CB 0.82 0.83 0.84
Table 3
Intact ship strength properties based on tnet50.
Tanker 1 Tanker 2 Tanker 3
Ship length (m) 320 264 233
UBM_PCM (MN.m) 19967 11062 7623
SMI at deck (m3
) 70.49 39.31 24.25
SMI at bottom (m3
) 122.48 48.6 34.54
A.W. Hussein, C. Guedes Soares / Ocean Engineering 36 (2009) 1446–1459 1449
5. Das, 2004; Luı´s et al., 2006; Jia and Moan, 2008; Khan and Das,
2007). The damage is simulated by removing the damaged
elements from the midship section and re-calculating the
ultimate strength of the section.
The adequacy of such approach has been recently checked by
comparing the predictions of several codes with the results of a
finite-element analysis of a damaged ship hull (Guedes Soares
et al., 2008).
The residual strength index is a way of comparing the ultimate
strength of the damaged hull with the intact one. The residual
strength index (RIF) used in this study was defined by Fang and
Das (2004) as
RIF ¼
MDamage
MIntact
(2)
where Mdamage is the ultimate moment of the damaged section
and MIntact is the ultimate moment of the intact section.
5.1. Side damage (collision)
To calculate the minimum damage ultimate bending moment
many different damage scenarios are assumed. The damage is
assumed to take place at the side. The damage sizes progresses
from D/6 to D/2.
In the first scenario, the damage is assumed to start at the
upper part of the side and extends D/6 m toward the bottom. The
stiffeners at this area are then inactive. The ultimate strength
(UBM) is then calculated. The second scenario starts at the next
stiffener and extends D/6 towards the bottom. Again, the UBM is
calculated for this scenario. The location of damage keeps moving
towards the bottom and extends to the specified damage size. For
each case, the UBM is calculated as shown in Figure.
The same calculations are then repeated for different damage
sizes: D/5, D/4, D/3 and D/2. Fig. 4 shows the location of damage
extend and the corresponding UBM.
Figs. 5–7 show the residual bending moment for many
collision scenarios. The figures also show the ultimate bending
moment versus the damage location for many damage sizes. It is
clear from the figures that the minimum residual strength always
ARTICLE IN PRESS
Fig. 4. Location of damage and corresponding UBM.
L = 320m
0
18.5 19 19.5 20 20.5
5
10
15
20
25
30
35
Ultimate Bending Moment (GN.m)
VerticalLocationofDamage(m)
D/6 D/5 D/4 D/3 D/2 Intact
Fig. 5. Residual strength versus damage location at side.
L = 264 m
0
5
10
15
20
25
10.2 10.4 10.6 10.8 11 11.2
Ultimate bending moment (GN.m)
VerticalLocationofDamage(m)
D/6 D/5 D/4 D/3 D/2 Intact
Fig. 6. Residual strength versus damage location at side.
A.W. Hussein, C. Guedes Soares / Ocean Engineering 36 (2009) 1446–14591450
6. occurs when the upper part is damaged. Furthermore, as
expected, the bigger the damage is, the smaller the residual
strength. It is also clear that the ship might lose up to 7% of its
strength after collision.
Fig. 8 shows the RIF for the three ships for the worst cases
which gave minimum residual strength; the upper part of the ship
side. Table 4 presents the numerical results.
From the data presented in Fig. 8, one can fit a linear equation
presenting the relation between the RIF and the damage size. This
equation can be presented as follows:
RIF ¼ 0:98 À ð0:084 Ã Damage sizeÞ (3)
The damage size in the above formula is the ratio between
actual damage size and the depth of the ship.
5.2. Bottom damage (grounding)
The same calculations were done to bottom damage. The
location of the damage was assumed at different locations along
the ship’s bottom starting from the left side and proceeding to the
right side. Fig. 9 represents a typical case to show how the damage
position is assumed and the corresponding ultimate strength. The
damage size varies from B/6 to B/2. The ultimate strength is
calculated for each scenario. Figs. 10–12 present the results.
One can conclude from the figures that the minimum
capacity occurs when the keel is damaged and the ship might
lose up to 12% of its strength after grounding. This damage
scenario was considered by Luı´s et al. (2006). Table 5 shows
the RIF for minimum grounding residual strength. This
corresponds to damage at B/4 from the midship. Fig. 13 presents
the RIF’s results which seem to be linearly dependent on damage
size.
One can notice from the figure that the scatter between the
cases is very small. Fig. 13 can be used to estimate the loss in
ultimate strength due to bottom damage, since it covers a big
range of tankers size. A regression line can be defined from the
scattered points of the RIF values
RIF ¼ 1:02 À ð0:254 Ã Damage sizeÞ (4)
ARTICLE IN PRESS
L = 233 m
0
5
10
15
20
25
7.1 7.2 7.3 7.4 7.5 7.6 7.7
Ultimate strength (GN.m)
VerticalLocationofDamage(m)
D/3 D/4 D/5 D/6 D/2 Intact
Fig. 7. Residual strength versus damage location at side.
Side Damage
0.5
0.6
0.7
0.8
0.9
1.0
0.10 0.20 0.30 0.40 0.50 0.60
Damage size / Depth
RIF
L = 320 L = 264 L = 233
Fig. 8. RIF values for minimum residual strength in collision.
Table 4
RIF for ship collision.
Damage size RIF
L ¼ 320 m L ¼ 264 m L ¼ 233 m
D/6 0.97 0.96 0.96
D/5 0.96 0.96 0.96
D/3 0.95 0.95 0.95
D/4 0.94 0.95 0.95
D/2 0.93 0.94 0.94
Fig. 9. Damage location and corresponding UBM.
L = 320 m
17.5
18
18.5
19
19.5
20
20.5
-30
Horizontal position of damage (m)
UltimatebendingmomentinGN.m
B/6 B/5 B/4 B/3 B/2 Intact
20-20 -10 0 10 30
Fig. 10. Damage locations versus residual strength at bottom.
A.W. Hussein, C. Guedes Soares / Ocean Engineering 36 (2009) 1446–1459 1451
7. Fig. 14 shows the line and the approximated equation to
estimate the RIF value for certain bottom damage. The damage
size in the above formula is the actual damage size divided by the
ship breadth.
6. Loss in section modulus
The minimum section modulus at deck or bottom is defined by
the rule requirements. At the midship cross-section, the net
vertical hull girder section modulus, Zmin, at the deck and keel is
not to be less than the rule minimum hull girder section modulus
defined as
Zmin ¼ 0:9 K Cwv L2
B ðCB þ 0:70Þ 10À6
m3
(5)
where k is the high-strength steel factor ¼ 0.72, Cwv the wave
coefficient, L the rule length in m, B the moulded breadth in m and
CB the block coefficient.
After damage and due to loss of the stiffeners and shell plating,
the section modulus will be reduced. Thereby, the section
modulus after damage has to be checked. The section modulus
at deck and bottom was calculated for the worst damaged
scenarios which gave minimum residual strength.
Figs. 15 and 16 show normalized values of the section modulus
at bottom for the side damaged hull. The values are normalized to
the rule value, i.e. value 1 corresponds to the rule values. It is clear
that the bottom still comply with rule requirements after damage.
Figs. 17 and 18 show the normalized deck section modulus in
bottom and side damage. From the figures, one can notice that the
ARTICLE IN PRESS
L = 264 m
10.5
10.6
10.7
10.8
10.9
11
11.1
Horizontal position of damge (m)
UltimateBendingMomentinGN.m
B/6 B/5 B/4 D/3 D/2 Intact
B/4
-20 -15 -10 -5 0 5 10 15 20
Fig. 11. Damage locations versus residual strength at bottom.
L = 233 m
7.1
-25 -20 -15 -10 -5 0 5 10 15 20 25
7.2
7.3
7.4
7.5
7.6
.
Horizontal position of damage (m)
BendingmomentinGN.m
B/4 B/3 B/2 B/5 B/6 Intact BM
7.7
Fig. 12. Damage locations versus residual strength at bottom.
Table 5
RIF for ship grounding.
Damage size RIF
L ¼ 320 m L ¼ 264 m L ¼ 233 m
B/6 0.978 0.991 0.984
B/5 0.959 0.974 0.962
B/4 0.948 0.966 0.951
B/3 0.925 0.948 0.928
B/2 0.884 0.917 0.885
0.00
0.20
0.40
0.60
0.80
1.00
1.20
0.15 0.20 0.25 0.30 0.35 0.40 0.45 0.50 0.55
Damage size / Breadth
RIF
L = 320 L = 264 L = 233
Fig. 13. RIF values for minimum residual strength in grounding.
y = -0.2535 Damage size + 1.02
0.00
0.20
0.40
0.60
0.80
1.00
1.20
0.10 0.20 0.30 0.40 0.50 0.60
Damage size / Breadth
RIF
Fig. 14. RIF formula for bottom damage.
Bottom SM at side damage
0.50
0.70
0.90
1.10
1.30
1.50
1.70
1.90
0.00 0.10 0.20 0.30 0.40 0.50
Damage / Ship Depth
BottomSM/RuleMin.Value
L =233 L = 264 L = 320 Rule value
Fig. 15. Normalized values of SMbottom after side damage.
A.W. Hussein, C. Guedes Soares / Ocean Engineering 36 (2009) 1446–14591452
8. section modulus at the deck reduces rapidly due to damage, while
the section modulus at the bottom does not change at the same
level. Consequently, if the ship will have modified scantlings to
compensate the loss in SM due to damage, this modification
should be done to the deck plating.
7. Design modification factor
To compensate for the loss in the ultimate capacity and the
section modulus, a design modification factor is applied to the deck
plating thickness. This factor is to be multiplied by the original deck
plating thickness, tnet50. When bigger than 1, this will improve the
ultimate strength and increase the section modulus of the midship
section. If this factor is considered during design the ship will have
acceptable section modulus and strength after damage.
7.1. Design modification factor and ship strength
The DMF ranges from 0.8 to 1.4. The deck plating is increased
by these values and the ultimate strength is calculated for each
case using the developed computer code. Fig. 19 shows the effect
of the DMF on the intact ultimate strength.
Fig. 19 shows that the relation between the DMF and the
ultimate strength is almost linear for all the ships. The ultimate
strength values are then normalized to the ultimate bending
corresponding to tnet50, which is referred as UBM1; subscript 1
refers to DMF equal to 1. Fig. 20 shows the normalized values, with
an equation which gives the relation between the required
increase in ultimate bending moment and the corresponding
increase in deck plating.
DMF ¼ 0:441 Ã
UBM
UBMi
þ 0:56 (6)
If the ship is going to loose 10% of its strength after damage, the
required increase has to be this 10%. The value UBM/UBM1 will be
1.1. The value of DMF according to the above equation will be 1.05.
Therefore, the deck plating thicknesses need to be increased
by 5%.
7.2. Design modification factor and ship section modulus
The same process is done for the ship section modulus. The
deck plating thickness is increased using DMF and the section
modulus is calculated. The results for bottom section modulus are
ARTICLE IN PRESS
Bottom SM at bottom damage
0.50
0.70
0.90
1.10
1.30
1.50
1.70
1.90
0.00 0.10 0.20 0.30 0.40 0.50
damage size / ship breadth
BottomSM/RuleMin.Value
L = 320 L = 264 L = 233 m Rule value
Fig. 16. Normalized values of SMbottom after bottom damage.
Deck SM for side damage
0.50
0.60
0.70
0.80
0.90
1.00
1.10
1.20
0.00 0.05 0.10 0.15 0.20 0.25 0.30 0.35 0.40 0.45 0.50
Damage /Ship Depth
DeckSM/RileMin.Value
L =233 L = 264 L = 320 Rule value
Fig. 17. Normalized values of SMdeck after side damage.
Deck SM for bottom damage
0.50
0.60
0.70
0.80
0.90
1.00
1.10
1.20
0.00 0.10 0.20 0.30 0.40 0.50
Damage size / Ship breadth
DeckSM/Ruleminvalue
L = 320 L = 264 L = 233 m Rule value
Fig. 18. Normalized values of SMdeck after bottom damage.
0
0.2
0.4
0.6
0.8
1
1.2
1.4
1.6
10 15 20 255
Ultimate Strength (GN.m)
DesignModificationFactor
L = 320 L = 264 L = 233 Intact UBM1
Fig. 19. Design modification factor versus ultimate strength.
DMF =( 0.4411*UBM/UBM1) + 0.5602
0.00
0.20
0.40
0.60
0.80
1.00
1.20
1.40
0.7 0.8 0.9 1 1.1 1.2 1.3 1.4 1.5
UBM /UBM1
DMF
Fig. 20. Design modification factor versus UBM ratio.
A.W. Hussein, C. Guedes Soares / Ocean Engineering 36 (2009) 1446–1459 1453
9. presented in Fig. 21. The results of the deck section modulus are
almost similar and can be presented by the equation shown in
Fig. 22. Table 6 shows the numerical results and Eqs. (7) and (8)
show the relation between the DMF and the loss of the SM for deck
and bottom.
If one considers the 10% loss in ultimate capacity this requires
1.05 DMF. In this case and according to the above formulae, the
section modulus at the deck will increase by 2% and the section
modulus the bottom will be almost 0.4% more.
DMF ¼ 9:104 Ã
SM
SMi
bottom
À 8:1 (7)
DMF ¼ 2:45 Ã
SM
SMi
deck
À 1:45. (8)
8. Damage of strengthened sections
When the DMF is larger than 1, the cross-section is strength-
ened and the ultimate strength is enhanced. In this section, the
strength of the damaged strengthened sections will be assessed.
The same damage scenario is applied to study how the ultimate
strength changes after strengthening the deck plating. The
damage position and the damage size in the ship bottom are
changing and the ultimate strength is determined for each case
and the minimum strength is defined.
The RIF is defined for all the cases, comparing the damaged
strength with the UBM based on tnet50, to compare the attitude of
both sections: original and strengthened. The purpose of this
comparison is to study how the strengthened section will behave
if it is subjected to the same damage, since the objective of
strengthening the section is to achieve scantlings which when
damaged the section will still satisfy its minimum requirement.
Table 7 shows the RIF for the strengthened section for the three
tankers and it is clear how the loss in the UBM was reduced due to
strengthening the deck. One can notice that when the deck plating
is increased by 20%, the UBM of the strengthened sections, for the
three ships, will satisfy the minimum strength requirement even
if one quarter of the bottom is damaged. If the damage extends to
one third of the breadth the AFRAMAX and the SUEZMAX ships
will have the minimum UBM while the VLCC still miss 3% of the
required strength.
9. Reliability analysis
In the present reliability assessment, a time-independent first-
order reliability formulation corresponding to one-year operation
is considered. The limit state equation corresponds to the hull
girder failure under vertical bending:
gðxÞ ¼ Mu XR À ½Mwn Xst Xnl þ Msw XswŠ (9)
where, MU is the ultimate capacity with a model uncertainty
factor XR. MWV is the wave bending moment with model
uncertainty factors; Xst for the linear response calculation and
Xnl for non-linear effects. MSW is the random still-water bending
moment with a model uncertainty factor XSW. The values of the
above mentioned uncertainties are taken as presented in Table 8.
ARTICLE IN PRESS
Bottom section modulus
DMF = 9.1047 *(SM/SM1) - 8.096
0
0.2
0.4
0.6
0.8
1
1.2
1.4
1.6
0.95 0.96 0.97 0.98 0.99 1.00 1.01 1.02 1.03 1.04 1.05
SM/SM1
DMF
Fig. 21. Design modification factor versus bottom SM ratio.
Deck section modulus
DMF = 2.453(SM/SM1) - 1.4499
0
0.2
0.4
0.6
0.8
1
1.2
1.4
1.6
0.9 0.95 1 1.05 1.1 1.15 1.2
SM deck/SM1
DMF
Fig. 22. Design modification factor versus deck SM ratio.
Table 6
Section modulus ratio for different DMF.
DMF L ¼ 320 L ¼ 264 L ¼ 233
Bottom Deck Bottom Deck Bottom Deck
0.8 0.98 0.94 0.98 0.91 0.97 0.92
0.9 0.99 0.97 0.99 0.95 0.99 0.96
1 1.00 1.00 1.00 1.00 1.00 1.00
1.1 1.01 1.03 1.01 1.05 1.01 1.04
1.2 1.02 1.06 1.02 1.10 1.02 1.08
1.3 1.03 1.10 1.03 1.14 1.03 1.12
1.4 1.04 1.13 1.04 1.19 1.04 1.16
Table 7
RIF of strengthened sections.
DMF
1 1.1 1.2 1.3
L ¼ 320
B/6 0.978 1.006 1.033 1.065
B/5 0.959 0.986 1.011 1.042
B/4 0.948 0.975 0.998 1.030
B/3 0.925 0.951 0.971 1.002
B/2 0.884 0.910 0.921 0.951
L ¼ 264
B/6 0.991 1.036 1.082 1.129
B/5 0.974 1.019 1.064 1.110
B/4 0.966 1.010 1.056 1.101
B/3 0.948 0.992 1.037 1.081
B/2 0.917 0.959 1.001 1.041
L ¼ 233
B/6 0.984 1.030 1.077 1.126
B/5 0.962 1.007 1.042 1.102
B/4 0.951 0.996 1.042 1.090
B/3 0.928 0.972 1.017 1.064
B/2 0.885 0.926 0.968 1.010
A.W. Hussein, C. Guedes Soares / Ocean Engineering 36 (2009) 1446–14591454
10. The ultimate strength is calculated using the progressive
collapse method and the results used are those presented in
Table 3, with coefficient of variance equal to 0.08 (Guedes Soares
et al., 1996).The structural response due to waves is based on
linear hydrodynamic analysis and the long-term response is
computed assuming a narrow-banded Gaussian response in each
sea state. Finally, the annual extreme value distribution is
obtained assuming independence between sea states.
The stochastic model of still-water bending moment is
normally distributed with a mean value of 0.7 times the
maximum value in the loading manual. The stochastic model of
the bending moments are shown in Table 9.
9.1. Stochastic model of ultimate capacity
The ultimate bending moment is calculated using the pro-
gressive collapse method. The ultimate capacity distribution is
lognormal with a mean value as calculated by the code and the
COV is 0.08 the mean value. Table 10 shows the stochastic model
of all the ultimate capacity for the three ships.
9.2. Stochastic model of wave-induced load effects
To calculate the wave-induced bending moment, the ship lines
and the weight distribution are needed. Tanker 2 has all necessary
information to calculate the wave bending moment using
hydrodynamic analysis. The short term structural response due
to waves in terms of mid ship bending moment is obtained by
linear hydrodynamic analysis and assuming the Pierson Mosko-
witz (PM) spectrum. The long-term response is then computed
using IACS (2001) North Atlantic scatter diagram covering areas 8,
9, 15 and 16. The resultant probability distribution is fitted by a
Weibull model, which describes the distribution of the peaks at a
random point in time
FXðxÞ ¼ 1 À exp À
x
w
k
(10)
where w and k are, respectively, the scale and shape parameters of
the Weibull distribution.
However, one is normally interested in having the probability
distribution of the maximum amplitude of wave-induced effects
in n cycles where n corresponds to the mean number of load
cycles expected during the ship’s lifetime. Gumbel (1958) has
shown that whenever the initial distribution of a variable has an
exponential tail, the distribution of the largest value in n
observations follows an extreme distribution. Thus, the distribu-
tion of the extreme values of the wave-induced bending moment
over the time period T is obtained as a Gumbel law (Guedes
Soares, 1984)
FeðxeÞ ¼ exp À exp À
xe À xn
s
h i
(11)
where xn and s are parameters of the Gumbel distribution. The
Gumbel parameters xn and s can be estimated from the initial
Weibull distribution using the following equation:
xn ¼ w½lnðnÞŠ1=k
(12)
s ¼
w
k
½lnðnÞŠ1Àk=k
(13)
where w and k are the Weibull parameters and n is the mean
number of load cycles expected during the time period T which is
equal to one year. Table 11 shows the results of the stochastic
modeling of wave bending moment for Tanker 2.
For the Tankers 1 and 3, no information is available to calculate
the wave bending moment; therefore, the reliability is calculated
based on the rule value which is used as a reference to determine
a corresponding Weibull distribution. The IACS CSR rules men-
tioned that the rule value is calculated with probability of
exceedance Q ¼ 10À8
. The shape parameter k of Weibull will be
kept the same as the calculated one for Tanker 2, 0.947. The scale
parameter w will be adjusted to give the pre-mentioned
probability of exceedance. Table 12 shows the results.
9.3. Stochastic model of still-water bending moment
The still-water load effects result from the longitudinal
distribution of the cargo on-board. These are likely to change at
each departure and smaller changes may occur during a voyage.
Once the cargo distribution is known, the still-water load effects
can be calculated. However, they will vary with time and so, at the
design stage, they can only be described by a probability
distribution. Guedes Soares and Moan (1988) identified that the
vertical still-water bending moments amidship can be described
by a normal distribution.
ARTICLE IN PRESS
Table 8
Summary of uncertainties of the models.
Variable Distribution m d
XR Normal 1.05 0.1
Xst Normal 1 0.1
Xnl Normal 1 0.1
XSW Normal 1 0.1
Table 10
Stochastic modeling of UBM.
m s
Tanker 1 19967 1597
Tanker 2 11062 885
Tanker 3 7623 610
Table 11
Model of wave bending model Tanker 2.
Load condition Ballast Full load
Fraction of ship life 42.5% 42.5%
Weibull parameters w 281.9 291.9
k 0.920 0.947
Gumbel parameters n 1.91E+06 1.91E+06
se 387 358
Mean 5367 5110
Std 496 459
Table 9
Summary of the probabilistic model.
Variable Distribution
Parameters
m d
WBM Gumbel Function of sea state
SWBM Normal 0.7*Max Value 0.2*m
UBM Lognormal PCM 0.08*m
A.W. Hussein, C. Guedes Soares / Ocean Engineering 36 (2009) 1446–1459 1455
11. Guedes Soares and Dogliani (2000), found that the still-water
moment can vary significantly from departure to arrival.
The authors assumed Gaussian distribution for both the departure
and arrival conditions and a Gaussian distribution at a random
point in time. The mean and standard derivations of this
distribution are the average of the respective values at departure
and arrival.
Due to the lack in information, the maximum still-water
bending moment is going to be taken 90% of the rule value, as
adopted in Hussein and Guedes Soares (2008). The mean value is
going to be taken 70% of the maximum SWBM and with a
standard deviation of 0.2 times the maximum value (Horte et al.,
2007). Table 13 shows the rule value for the three ships with the
stochastic characteristics.
10. Reliability of intact ships
According to the stochastic models presented in Tables 9–13,
the reliability index can be calculated using the computer
program COMREL (Gollwitzer et al., 1988) and the results are
presented for the intact ships in Table 14. The consistent reliability
level can be attributed to using the rule value which is already
calibrated to achieve certain level of reliability.
If improving the ultimate strength is done by applying a design
modification factor to the deck plating, the reliability index will
definitely change. Fig. 23 shows the relation between the
reliability index and the DMF for intact ships. One can see from
the figures that the increase in the reliability index is linear with
the increase of the DMF.
11. Reliability after damage
The loss in the ultimate strength due to damage has been
considered in Section 5. The ultimate strength used in the
reliability calculations will be decreased by the RIF’s values in
Table 5 for damage size B/2, since it presents the worst scenario.
After damage, the still-water bending moment can change
dramatically due to the increase of the weight. The location of the
damage will define the event. Damage may occur in a position
which causes one compartment to be flooded. Other scenario
might assume that two compartments are flooded due to the
same damage. Many damage scenarios are assumed for Tanker 2
to check how much the still-water bending moment will increase
due to flooding. Fig. 24 shows the arrangement of the bottom
tanks for the ship.
In each scenario, water is assumed to enter the tank and fill it
up to the waterline. The weight distribution will change according
to the added water weigh. The buoyancy is recalculated again
according to the new draft after damage. Finally, the load
distribution is calculated and the bending moment is assessed
for the resultant load. The same steps are repeated for each
damage scenario. Table 15 shows each damage scenario, according
to the arrangement presented in Fig. 24, with the corresponding
maximum still-water bending moment.
From the above table, one can notice that when one of the
compartments is damaged, at one side, the SWBM will increase
30%. If two compartments are damaged the increase will be 46%.
ARTICLE IN PRESS
Table 12
WBM stochastic model based on rule values.
Full load Tanker1 Tanker2 Tanker3
Weibull parameters w 481 265 177
k 0.947 0.947 0.947
Gumbel parameters n 1.91E+06 1.91E+06 1.91E+06
de 589 325 217
Mean 8412 4639 3240
Std 756 417 279
Table 13
Stochastic model for intact ship of still-water BM.
Rule value m d
Tanker 1 5032 3170 634
Tanker 2 2627 1655 331
Tanker 3 1857 1170 234
Table 14
Reliability index before damage.
b P(f)
Tanker 1 3.18 7.51E-04
Tanker 2 3.25 5.80E-04
Tanker 3 3.20 6.97e-04
1.5
2
2.5
3
3.5
4
4.5
0.70 0.80 0.90 1.00 1.10 1.20 1.30 1.40 1.50
D M F
ReliabilityInbex
L= 320 L = 264 L = 233
Fig. 23. Reliably index versus DMF.
Fig. 24. General plans of ballast tanks for Tanker 2.
A.W. Hussein, C. Guedes Soares / Ocean Engineering 36 (2009) 1446–14591456
12. And if a huge damage occurs in a position such that 4
compartments are damaged the increase in the bending moment
goes up to 60% of the intact SWBM.
Considering the increase in the SWBM due to damage and the
decrease in the ultimate strength due to loss of the damaged part,
the reliability is then calculated after damage. The SWBM is
assumed to increase with 30%, 45% and 60% as a result of different
damage scenarios. Table 16 shows the reliability after damage for
each damage scenario and Fig. 25 indicates that loss is linear for
all the cases. Table 17 shows the loss in the reliability due to
damage.
12. Sensitivity of the parameters
The importance of the variable is assessed for all ships and the
results were almost typical. The sensitivity factor a is given by
ai ¼
1
ffiffiffiffiffiffiffiffiffiffiffiffiffiffiffiffiffiffiffiffiffiffiffiffiffiffiffiffiffiffiffiffiPn
i ð@gðxÞ=@xiÞ2
q
@gðxÞ
@xi
(14)
Fig. 26 shows the results for the intact ship. Positive sensitivity
indicates that an increase in this variable leads to an increase in
the reliability. The importance of the variables does not change
from one ship to the other. It is clear from the figure that the
ultimate strength and the corresponding uncertainty have the
highest importance.
Fig. 27 shows a typical result for one of the cases which shows
clearly the importance of each variable. The ultimate bending
moment and its corresponding uncertainty have the highest
importance and the rest of the variables have almost the same
importance.
13. Sensitivity after damage
The following figures show the change in the sensitivity factors
with the damage, which is interpreted as increase in still-water
bending moment. One can conclude that the importance of the
UBM and the corresponding uncertainty do not change with the
increase of SWBM, Figs. 28 and 29. The importance of the still-
water bending moment and its corresponding uncertainty
increase rapidly with the damage as shown in Figs. 33 and 34.
The importance of the wave bending moment and the
corresponding uncertainty decreased slightly with the damage,
Figs. 30–32.
ARTICLE IN PRESS
Table 15
SWBM for intact and damage conditions for Tanker 2.
Damage position SWBM MN.m Increase %
Damage
Intact ship 2226.7 0.0
B 3P 3221.4 30.9
B 3S 3222.6 30.9
B 3 P+S 4168.4 46.6
B 4P 3018.7 26.2
B 4S 3016.7 26.2
B 4 P+ S 3787.4 41.2
B 3+4 and P+S 5304.1 58.0
Table 16
Reliability Index for damaged ships.
Increase in SWBM Tanker 1 Tanker 2 Tanker 3
Intact (%) 3.17 3.25 3.2
30 2.239 2.699 2.526
45 2.044 2.519 2.339
60 1.85 2.339 2.152
0
0.5
1
1.5
2
2.5
3
30%
percentage of increase in SWBM
β
L = 320 L = 264 L = 233
40% 50% 60%
Fig. 25. Reliability index for damaged ships.
Table 17
Percentage of loss in reliability due to damage.
Increase in SWBM Loss in reliability %
Tanker 1 Tanker 2 Tanker 3
Intact (%) 0.0 0.0 0.0
30 29.4 17.0 21.1
45 35.5 22.5 26.9
60 41.6 28.0 32.8
-0.6
-0.4
-0.2
0
0.2
0.4
0.6
0.8
230
Ship Length
SensitivityFactors
Msw UBM Xu Xnl Mwave Xsw
250 270 290 310 330
Fig. 26. Sensitivity factors for 30% increase in SWBM.
UBM; 0.43
Xu; 0.58
Mwave; -
0.37
Xnl; -0.34
Msw; -0.30Xsw; -0.16
Xst; -0.34
Fig. 27. Sensitivity factors.
A.W. Hussein, C. Guedes Soares / Ocean Engineering 36 (2009) 1446–1459 1457
13. 14. Conclusions
The ultimate strength of three double hull tankers is calculated
using the progressive collapse method with the failure modes
defined in the IACS new common structural rules based on net
scantling plus 50% of the corrosion addition defined in the rule.
Various scenarios with different damage sizes are assumed at
bottom and side. The ultimate strength is calculated for each case
to define the maximum loss in ultimate strength due to collision
or grounding. A simple equation is given to calculate the loss in
strength as a function of the damage size.
The loss in section modulus due to damage is calculated to
check if after damage the ship will have section modulus less than
the minimum value defined by the rule.
A design modification factor is suggested which represent an
increase in the deck thickness to compensate the loss in ultimate
ARTICLE IN PRESS
UBM
0
0.1
0.2
0.3
0.4
0.5
20% 30% 40% 50% 60% 70%
Increase in SWBM
SensitivityFactor
L =320 L = 264 L = 233
Fig. 28. Sensitivity factors for UBM.
Xu
0
0.1
0.2
0.3
0.4
0.5
0.6
0.7
20% 30% 40% 50% 60% 70%
Increase in SWBM
SensitivityFactor
L =320 L = 264 L = 233
Fig. 29. Sensitivity factors for UBM uncertainty.
Mwave
-0.5
-0.4
-0.3
-0.2
-0.1
0
20% 30% 40% 50% 60% 70%
Increase in SWBM
SensitivityFactor
L =320 L = 264 L = 233
Fig. 30. Sensitivity factors for wave BM.
Xnl
-0.4
-0.3
-0.2
-0.1
0
20% 30% 40% 50% 60% 70%
Increase in SWBM
SensitivityFactor
L =320 L = 264 L = 233
Fig. 31. Sensitivity factors for wave non-linear response.
Xst
-0.4
-0.3
-0.2
-0.1
0
20% 30% 40% 50% 60% 70%
Increase in SWBM
Sensitivityfactor
L =320 L = 264 L = 233
Fig. 32. Sensitivity factors for wave uncertainty.
SWBM
-0.4
-0.3
-0.2
-0.1
0
20% 30% 40% 50% 60% 70%
Increase in SWBM
sensitivityfactor
L =320 L = 264 L = 233
Fig. 33. Sensitivity factors for still-water BM.
Xsw
-0.3
-0.2
-0.1
0
20% 40% 50% 60% 70%30%
Increase in SWBM
SensitivityFactor
L =320 L = 264 L = 233
Fig. 34. Sensitivity factors for still-water BM uncertainty.
A.W. Hussein, C. Guedes Soares / Ocean Engineering 36 (2009) 1446–14591458
14. strength due to damage. A simple equation is given to estimate
the required DMF as a function of the loss in ultimate strength.
The ultimate strength of the strengthened sections is assessed
considering damage and it was found that 20% increase in the
deck plating will enable the ship to maintain its strength even if
one quarter of the bottom is damaged.
Reliability of the damaged ships is calculated considering the
increase in the still-water bending moment due to damage and
the loss in ultimate strength. The sensitivity analysis showed that
the ultimate strength and the corresponding uncertainty have the
highest importance. This importance does not change from one
damage scenario to the other. The still-water bending moment
and the wave-induced bending moment have almost the same
importance.
Acknowledgments
The present paper has been prepared within the project
‘‘MARSTRUCT-Network of Excellence on Marine Structures’’
http://www.mar.ist.utl.pt/marstruct/ which has been funded by
the European Union through the Growth program under Contract
TNE3-CT-2003-506141.
References
ABS, 1995. Guide for Assessing Hull-Girder Residual Strength for Tankers. American
Bureau of Shipping.
BV, 2000. MARS2000-User’s guide, Bureau Veritas. Marine Division Development
Department.
Fang, C., Das, P.K., 2004. Hull girder ultimate strength of damaged ships. In:
Proceedings of the Ninth Symposium on Practical Design of Ships and Other
Floating Structures. Luebeck-Travemuende, Germany, pp. 309–316.
Fang, C.L., Das, P.K., 2005. Survivability reliability of damaged ships after collision
and grounding. Ocean Engineering 32, 293–307.
GL, 2004. Rules for Classification and Construction I Ship Technology Part-1
Seagoing Ships Chapter 1 Hull Structures Section 33 Strengthening against
Collisions, Germanischer Lloyd, Hamburg, Germany.
Gollwitzer, S., Abdo, T., Rackwitz, R., 1988. FORM-Program Manual, Munich.
Gordo, J.M., Guedes Soares, C., 1996. Approximate method to evaluate the hull
girder collapse strength. Marine Structures 9 (1), 449–470.
Gordo, J.M., e Guedes Soares, C., 1997. Interaction equation for the collapse of
tankers and containerships under combined bending moments. Journal of Ship
Research 41 (3), 230–340.
Gordo, J.M., Guedes Soares, C., 2000. Residual strength of damaged ship hulls. In:
Proceedings of Ninth IMAM Conference; Napoli, Italy, pp. 79–86.
Gordo, J.M., Guedes Soares, C., Faulkner, D., 1996. Approximate assessment of the
ultimate longitudinal strength of the hull girder. Journal of Ship Research 4 (1),
60–69.
Guedes Soares, C., 1984. Probabilistic Models for Load Effects in Ship Structures.
Division of Marine Structures, The Norwegian Institute of Technology, Report
UR-84-38.
Guedes Soares, C., Moan, T., 1988. Statistical Analysis of Still Water Load Effects in
Ship Structures. Transactions of the Society of Naval Architects and Marine
Engineers (SNAME).Vol. 96. New York, pp. l29–156.
Guedes Soares, C., Dogliani, M., Ostergaard, C., Parmentier, G., Pedersen, P.T., 1996.
Reliability based ship structural design. Transactions of the Society of Naval
Architects and Marine Engineers (SNAME) 104, 357–389.
Guedes Soares, C., Dogliani, M., 2000. Probabilistic modeling of time-varying still-
water load effects in tankers. Marine Structures 13, 129–143.
Guedes Soares, C., Luı´s, R.M., Nikolov, P.I., Modiga, M., Quesnel, T., Dowes, J.,
Toderan, C., Taczala, M., 2008. Benchmark study on the use of simplified
structural codes to predict the ultimate strength of a damaged ship hull.
International Shipbuilding Progress 55, 87–107.
Gumbel, E.J., 1958. Statistics of Extremes. Columbia University Press, New York.
Hørte, T., Wang, G., White, N., 2007. Calibration of the hull girder ultimate
capacity criterion for double hull tankers. In: Proceedings of the Conference
on Practical Design of Ships and Offshore Structures, Houston, USA, October,
2007.
Hussein, A.W., Teixeira, A.P., Guedes Soares, C., 2007. Assessment of the IACS
common structural hull girder check applied to double hull tankers. In: Guedes
Soares, C., Kolev, P. (Eds.), Maritime Industry, Ocean Engineering and Coastal
Resources, Vol. 1. Taylor and Francis, London, pp. 175–183.
Hussein, A.W., Guedes Soares, C., 2008. Partial safety factors assessment for double
hull tankers following the new common structural rules. In: Proceedings of the
27th International Conference on Offshore Mechanics and Arctic Engineering
(OMAE2008), paper OMAE2008-57949.
IACS, 2001. Recommendation no. 34, ‘‘Standard Wave Data,’’ 1992, Rev. 1 June
2000, Corr. November 2001.
IACS, 2006. Common structural rules for double hull oil tankers, International
Association of Classification Societies, London, /http://www.iacs.orgS.
IMO, 2002. Safety Requirements for Seagoing Ships Carrying Spent Nuclear Fuel
Shipping Casks, MSC XL/25/1, Note by Japan, International Maritime Organiza-
tion, /www.imo.orgS.
Jia, H., Moan, T., 2008. Reliability Analysis of Oil Tankers with Collision Damage. In:
Proceedings of the 27th International Conference on Offshore Mechanics and
Arctic Engineering (OMAE2008), paper OMAE2008-57102.
Khan, I.A., Das, P.K., 2007. Structural Safety Assessment of Damaged Ships. In:
Proceedings of 26th International Conference on Offshore Mechanics and
Arctic Engineering, San Diego, USA, 10–15 June 2007. Paper no. OMAE2007-
29121.
Luı´s, R.M., Teixeira, A.P., Guedes Soares, C., 2006. Longitudinal strength reliability of
a tanker accidentally grounded. In: Guedes Soares, C., Zio, E. (Eds.), Safety
and Reliability for Managing Risk, Vol. 2. Taylor Francis, London-UK,
pp. 1499–1509.
Paik, J.K., Thayamballi, A.K., Yang, S.H., 1998. Residual strength assessment of ships
after collision and grounding. Marine Technology 35, 38–54.
Smith, C.S., 1977. Influence of Local Compression Failure on Ultimate Longitudinal
Strength of a Ship’s Hull. In: Proceedings of the International Symposium on
Practical Design in Shipbuilding. (PRADS), Tokyo, Japan, pp. 73–79.
Wang, G., Chen, Y., Zhang, H., Shin, Y., 2000. Residual strength of damaged ship
hull. In: Ship Structures for the New Millennium: Supporting Quality in
Shipbuilding, 13, 14 June 2000, Arlington, VA,2000.
Wang, G., Chen, Y., Zhang, H., Peng, H., 2002a. Longitudinal strength of ships with
accidental damages. Marine Structures 15, 119–138.
Wang, G., Spencer, J., Chen, Y.J., 2002b. Assessment of ship’s performance in
accidents. Marine Structures 15, 313–333.
Wang, G., Ji, C., Kujala, P., Gab Lee, S., Marino, A., Sirkar, J., Suzuki, K., Terndrup
Pederson, P., Vredeveldt, A.W., Yuriy, V., 2006. Report of ISCC Technical
Committee: Collision and Grounding. In: Proceeding of 16th International Ship
and Offshore Structures Congress. Vol. 1. Southampton, UK, 20–25 2006.
ARTICLE IN PRESS
A.W. Hussein, C. Guedes Soares / Ocean Engineering 36 (2009) 1446–1459 1459