Downloaded 508 times
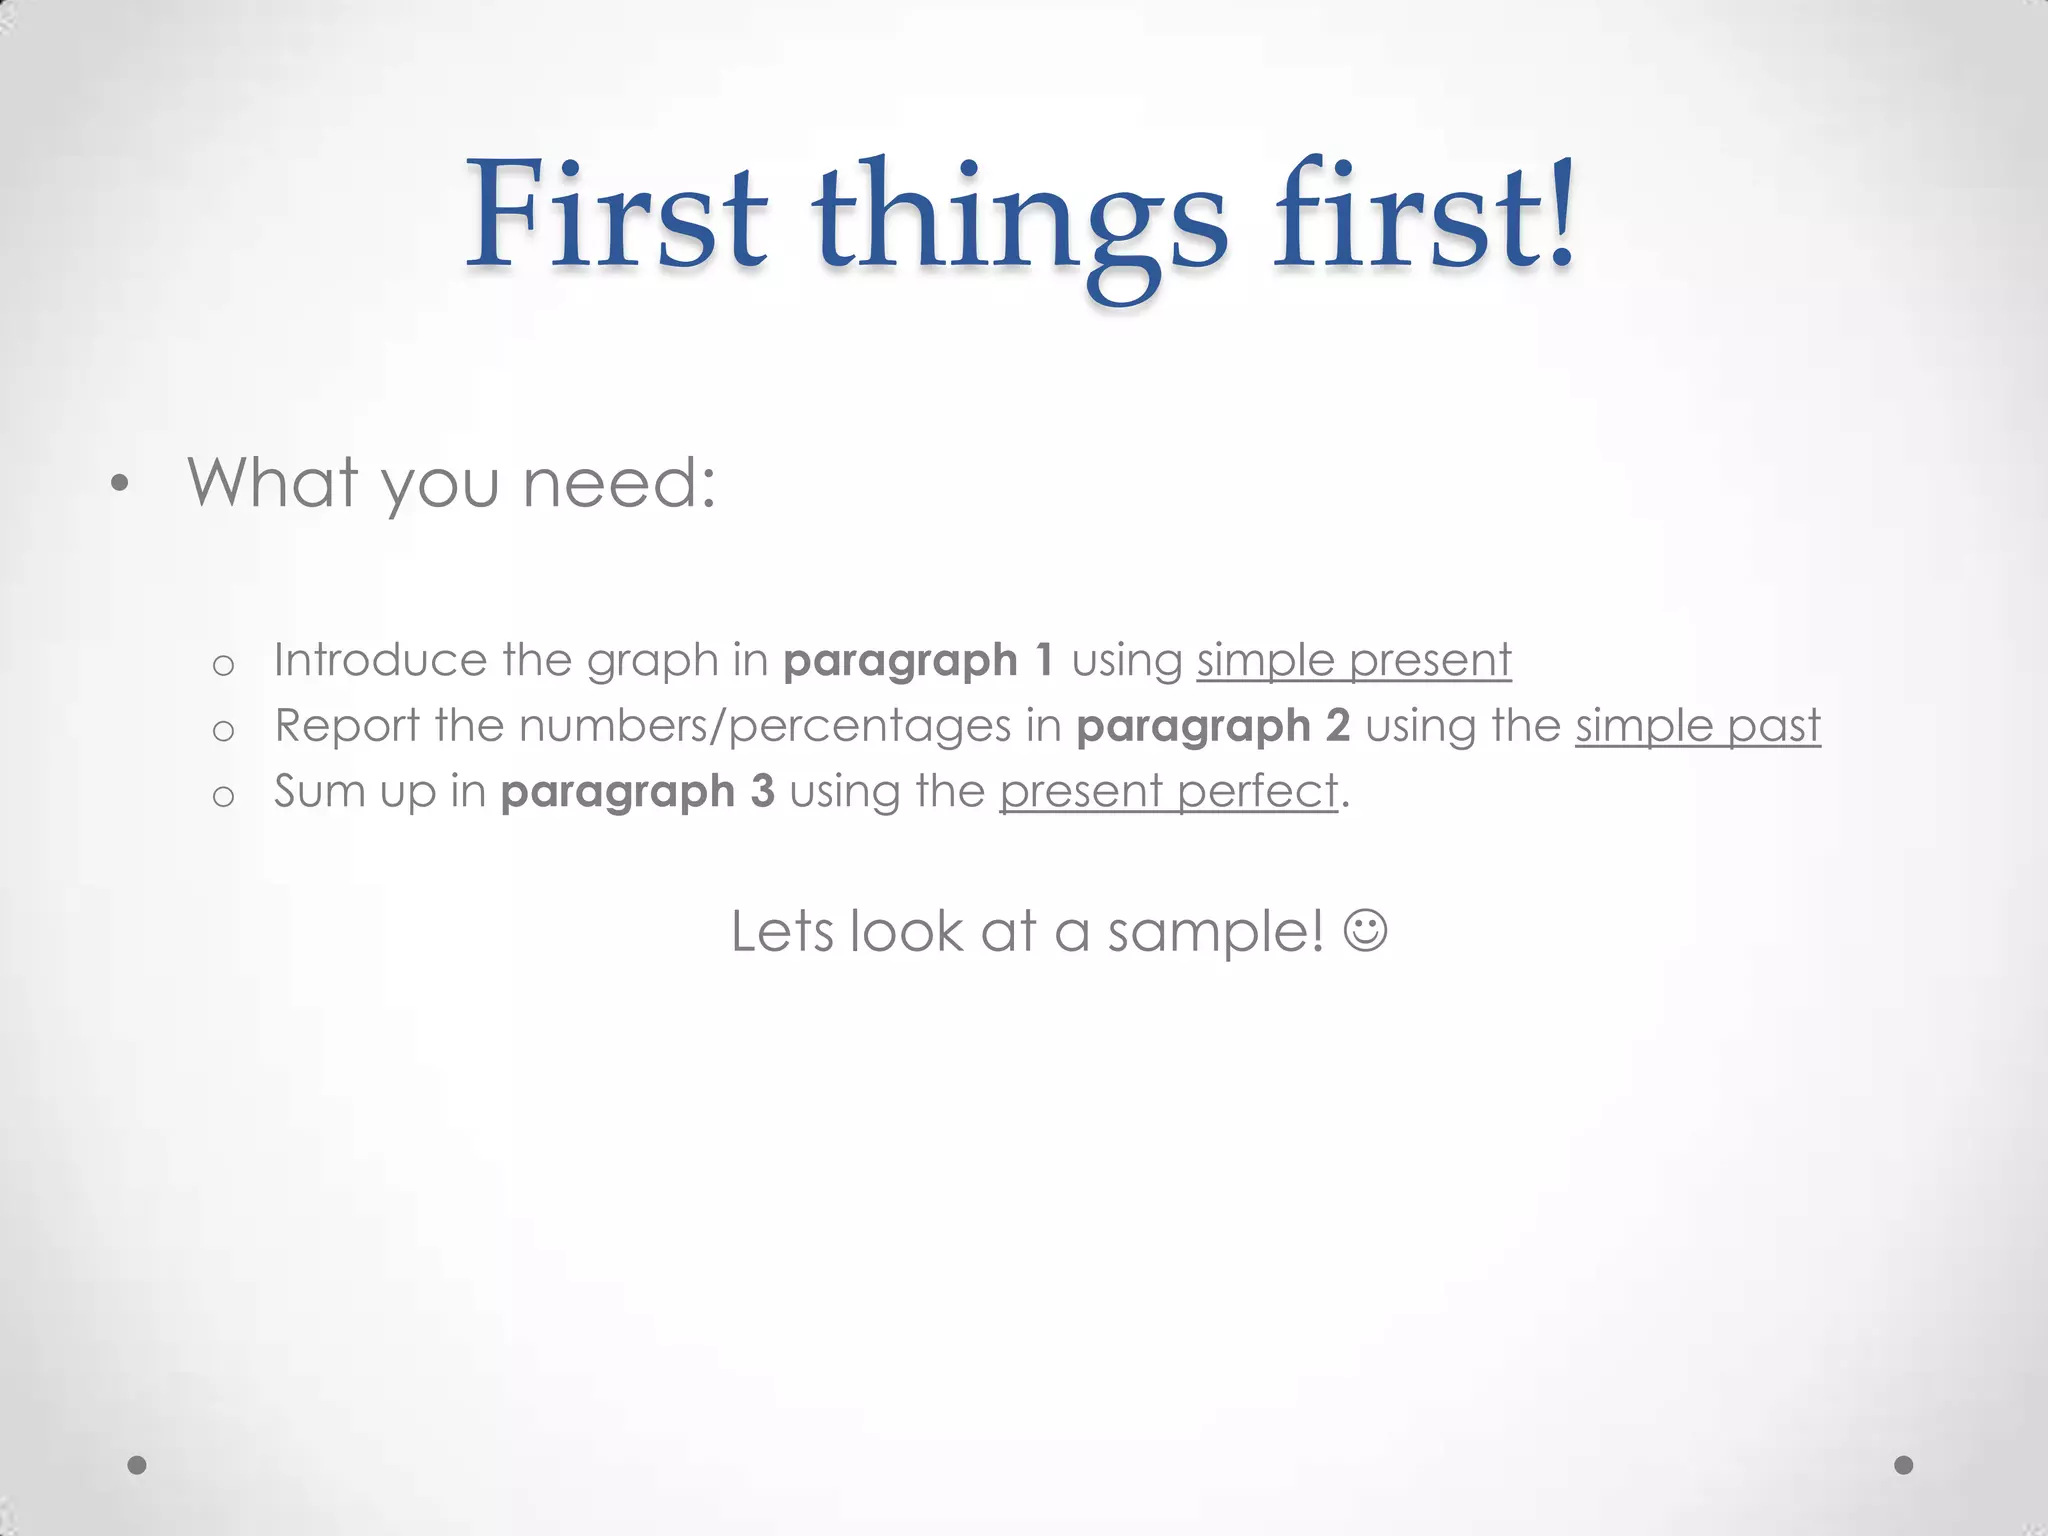
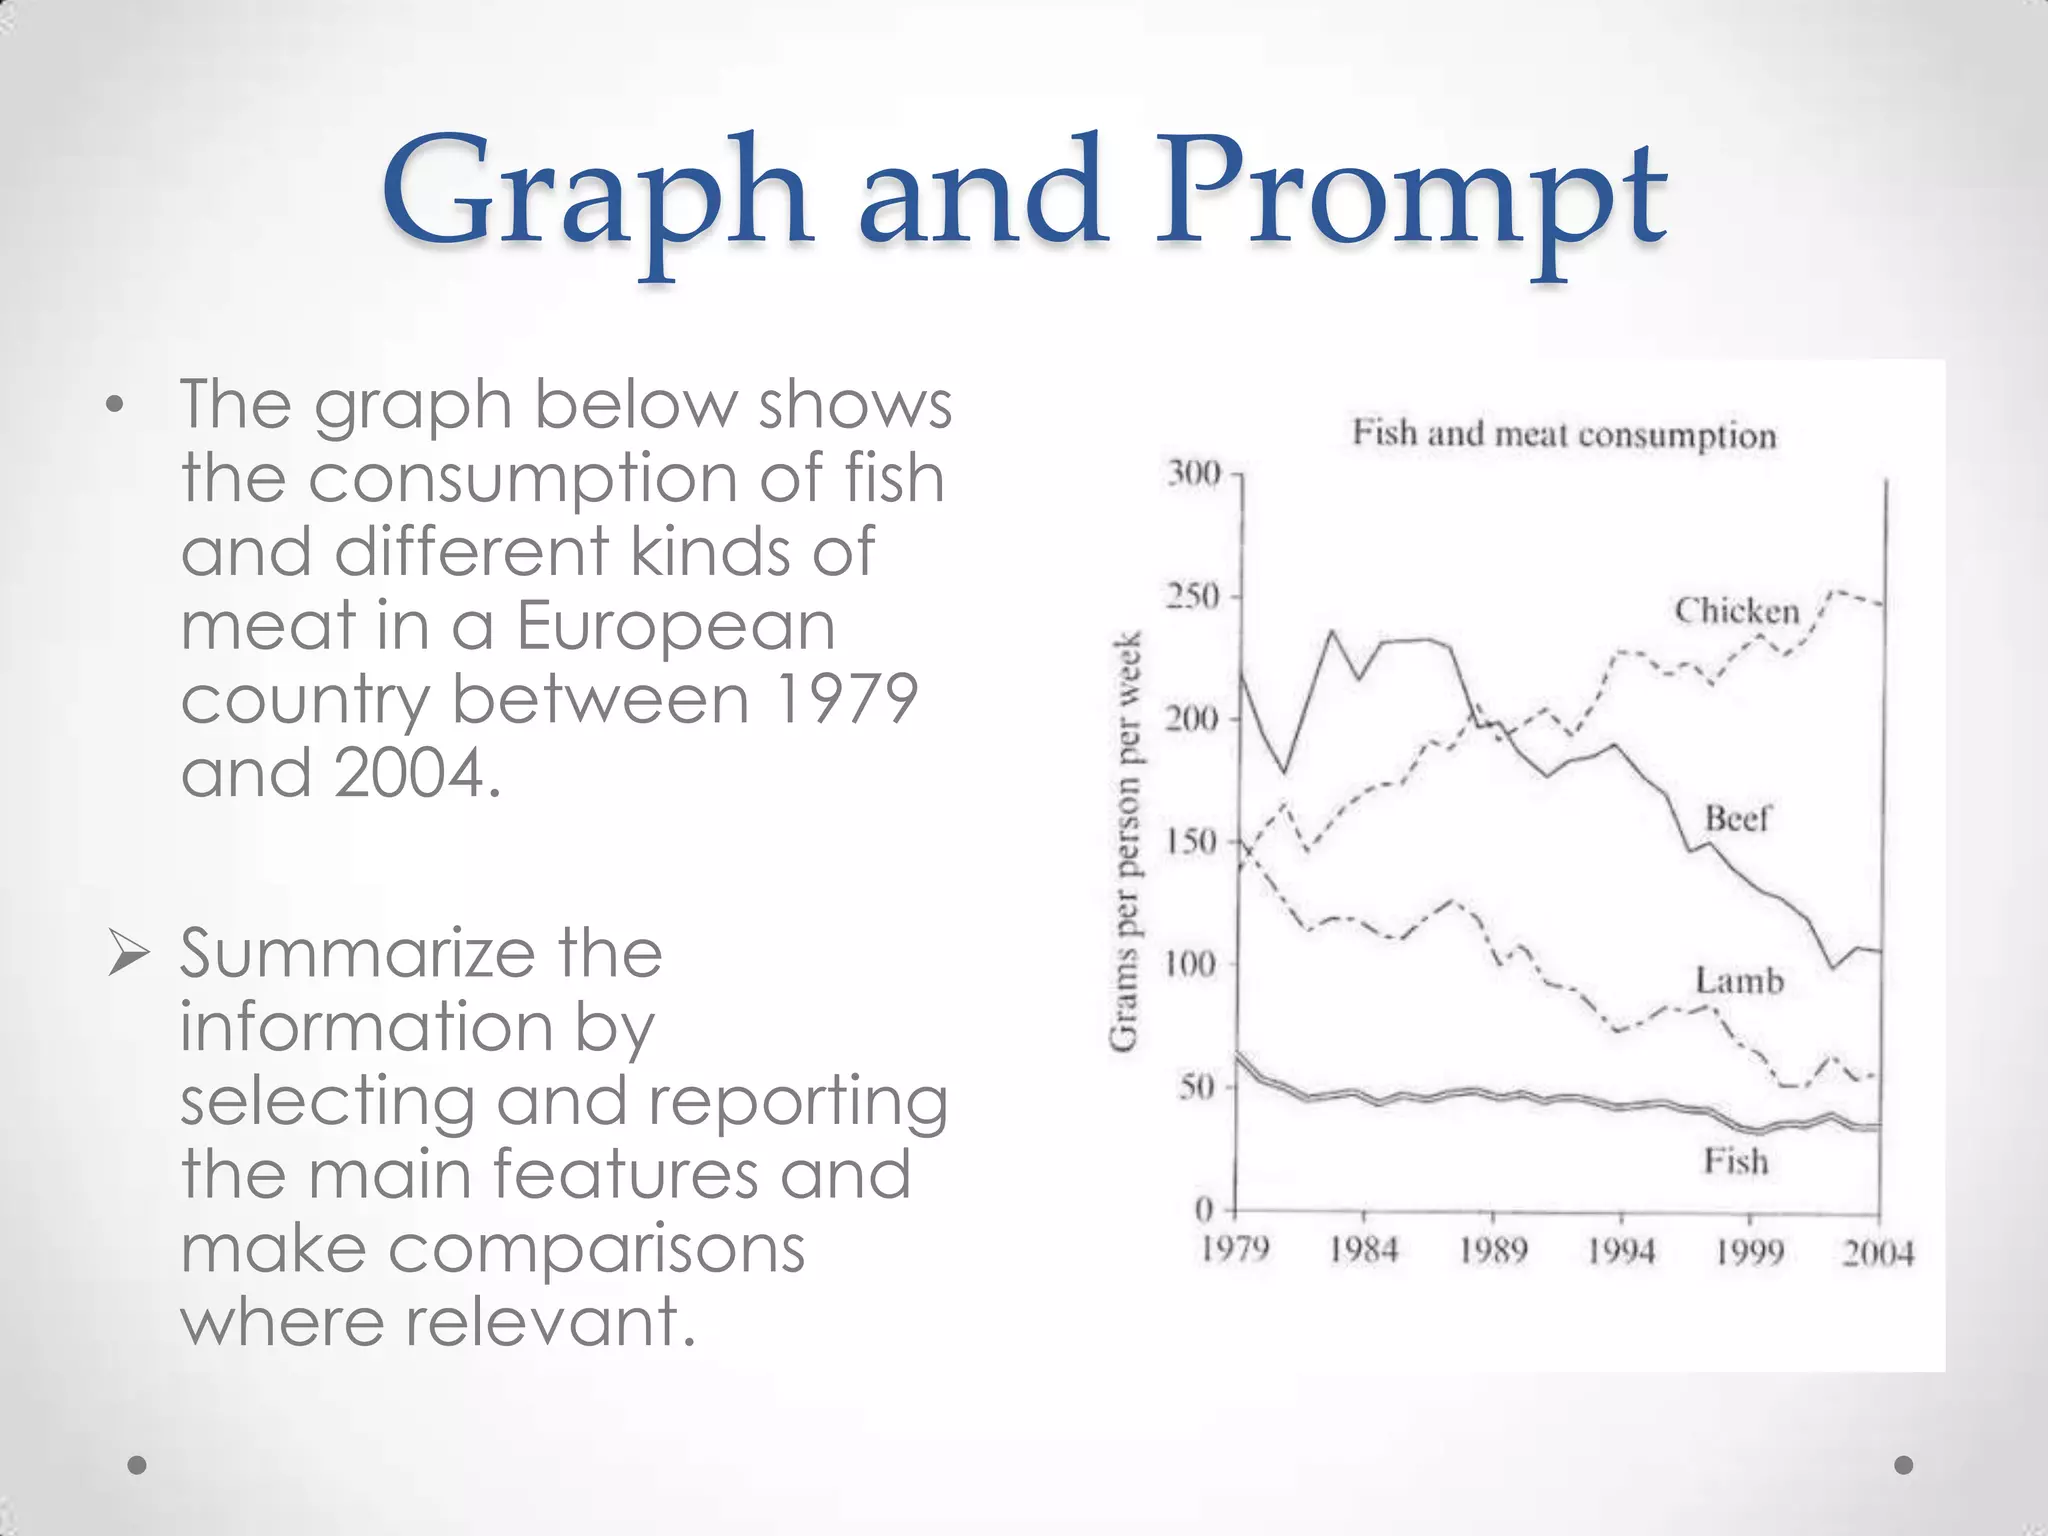
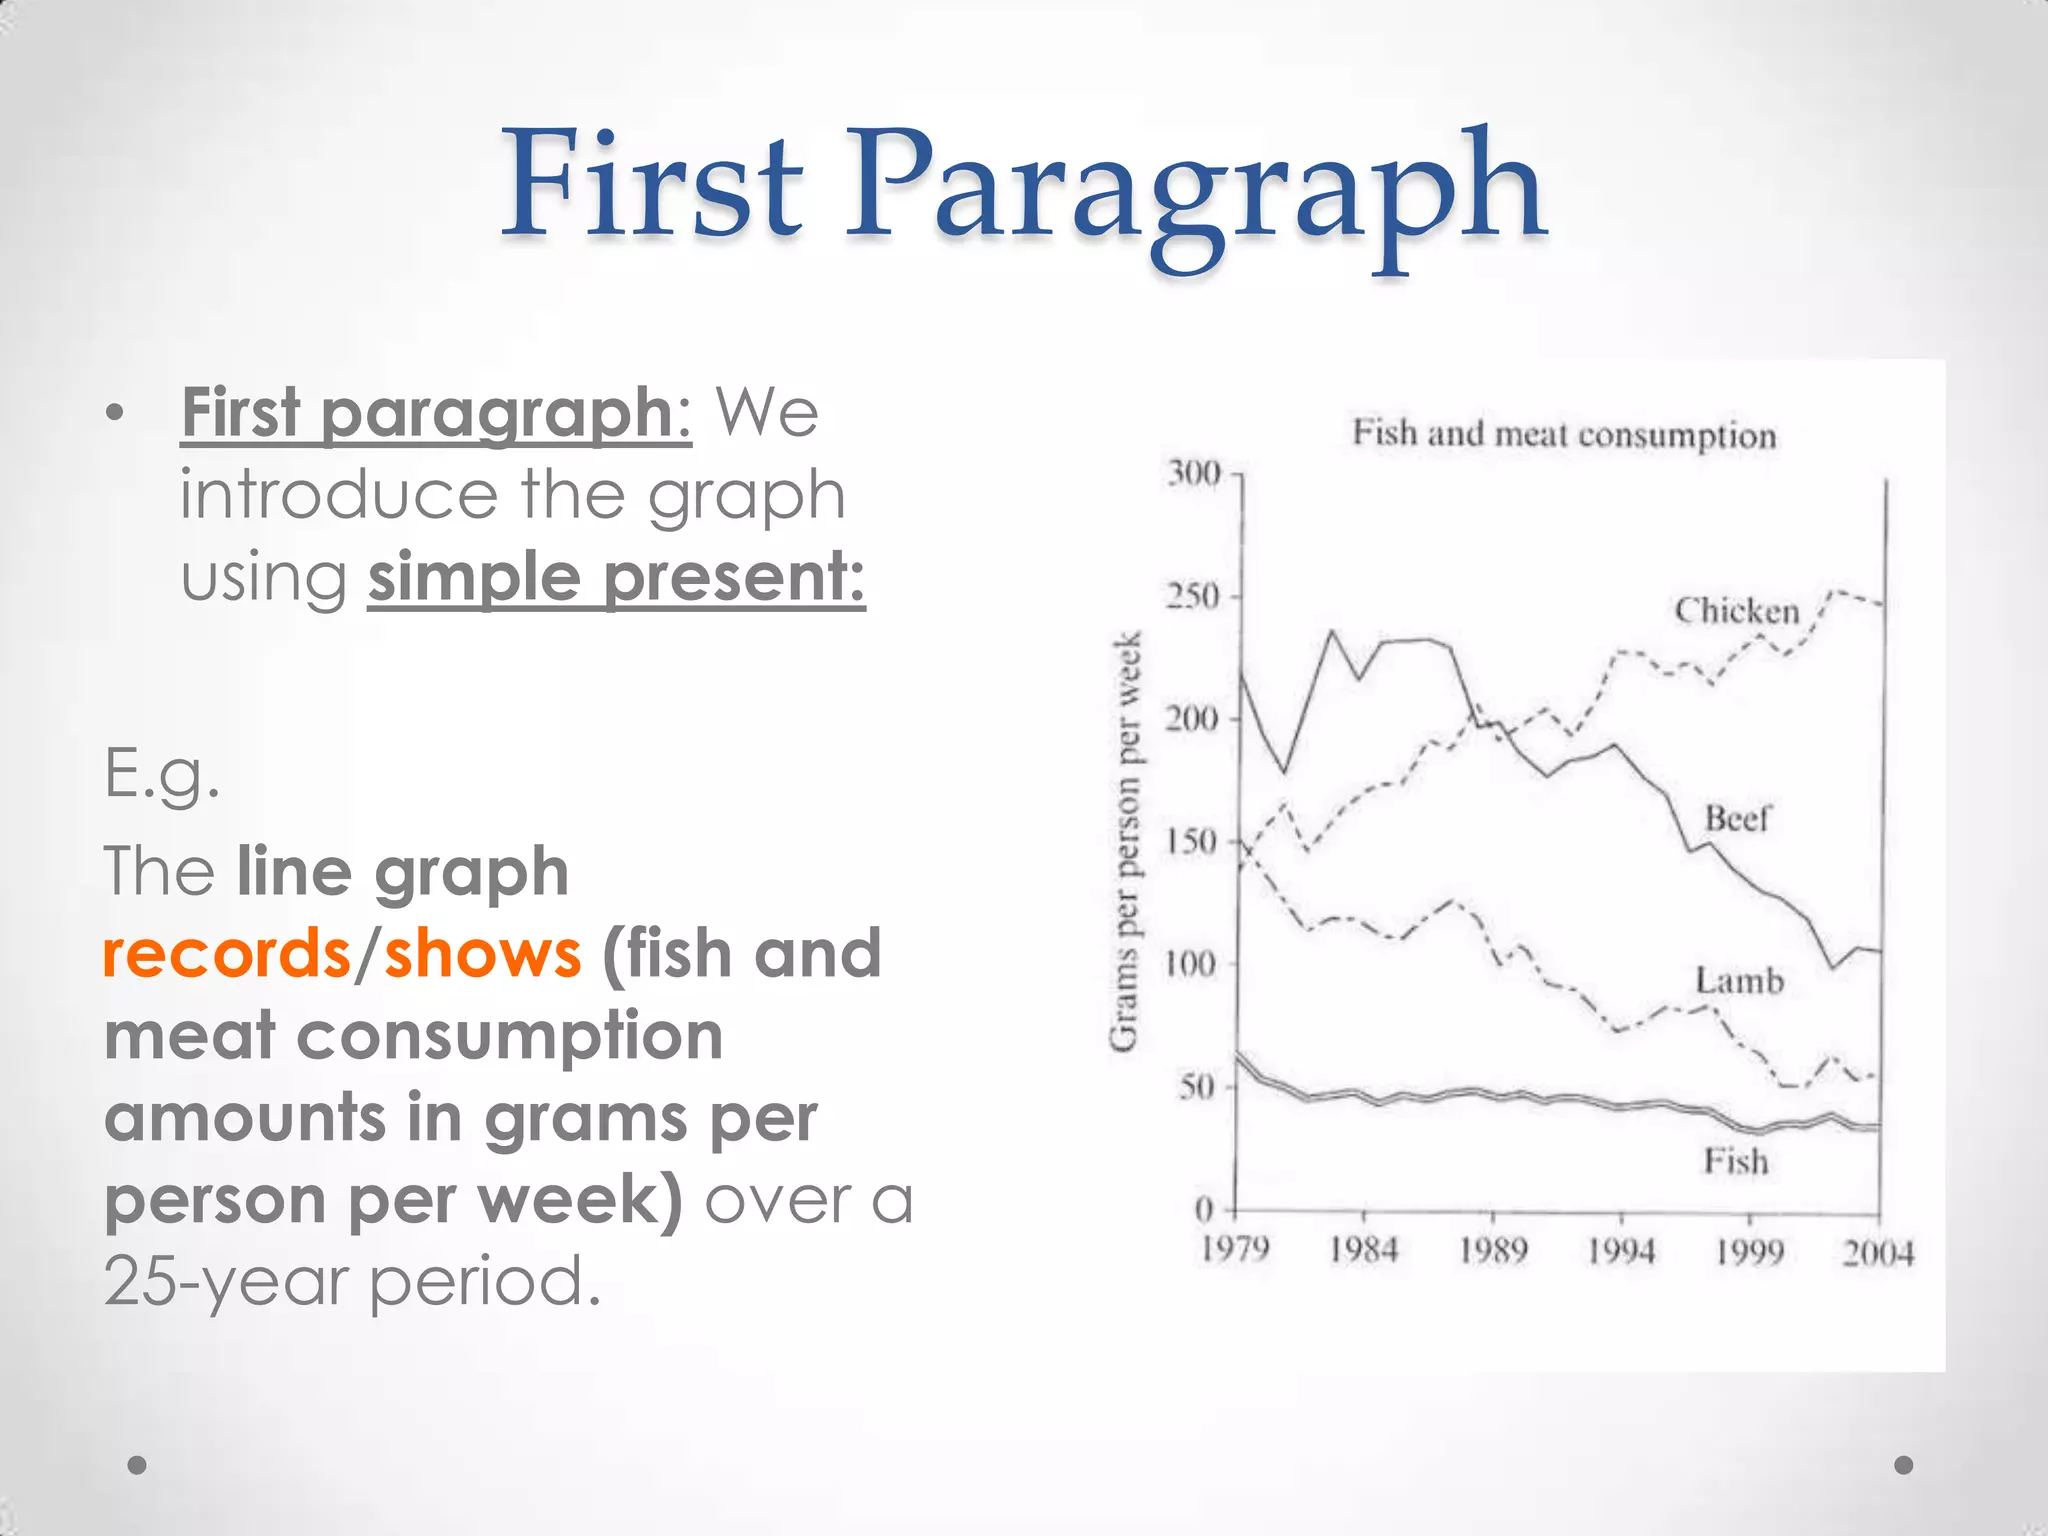
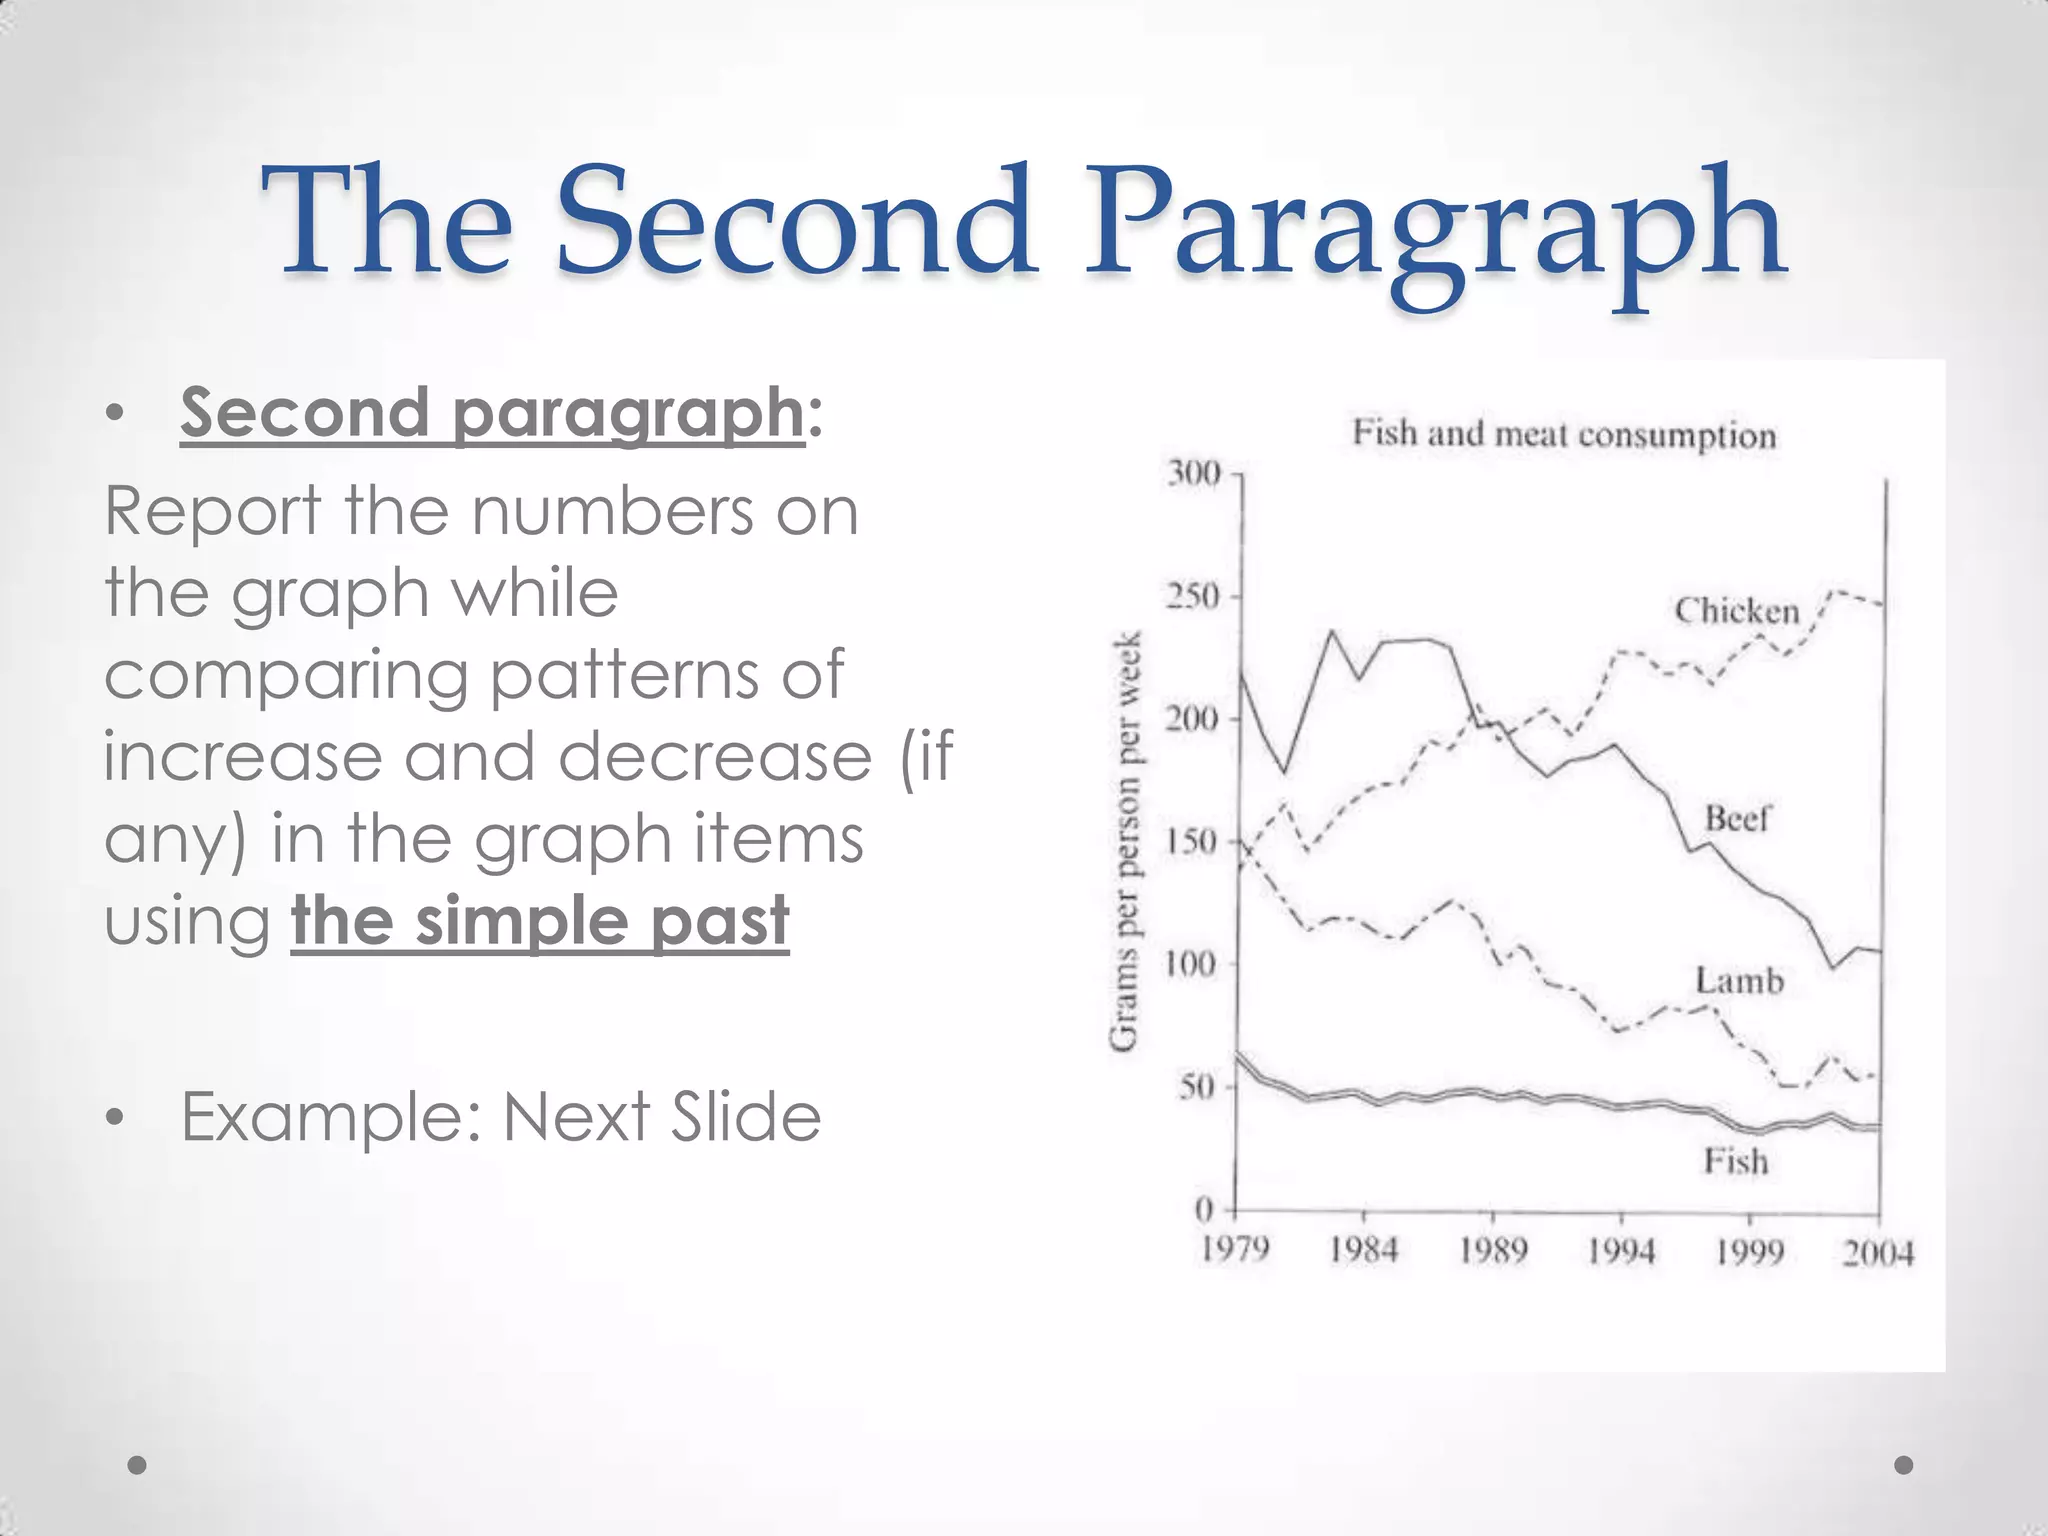
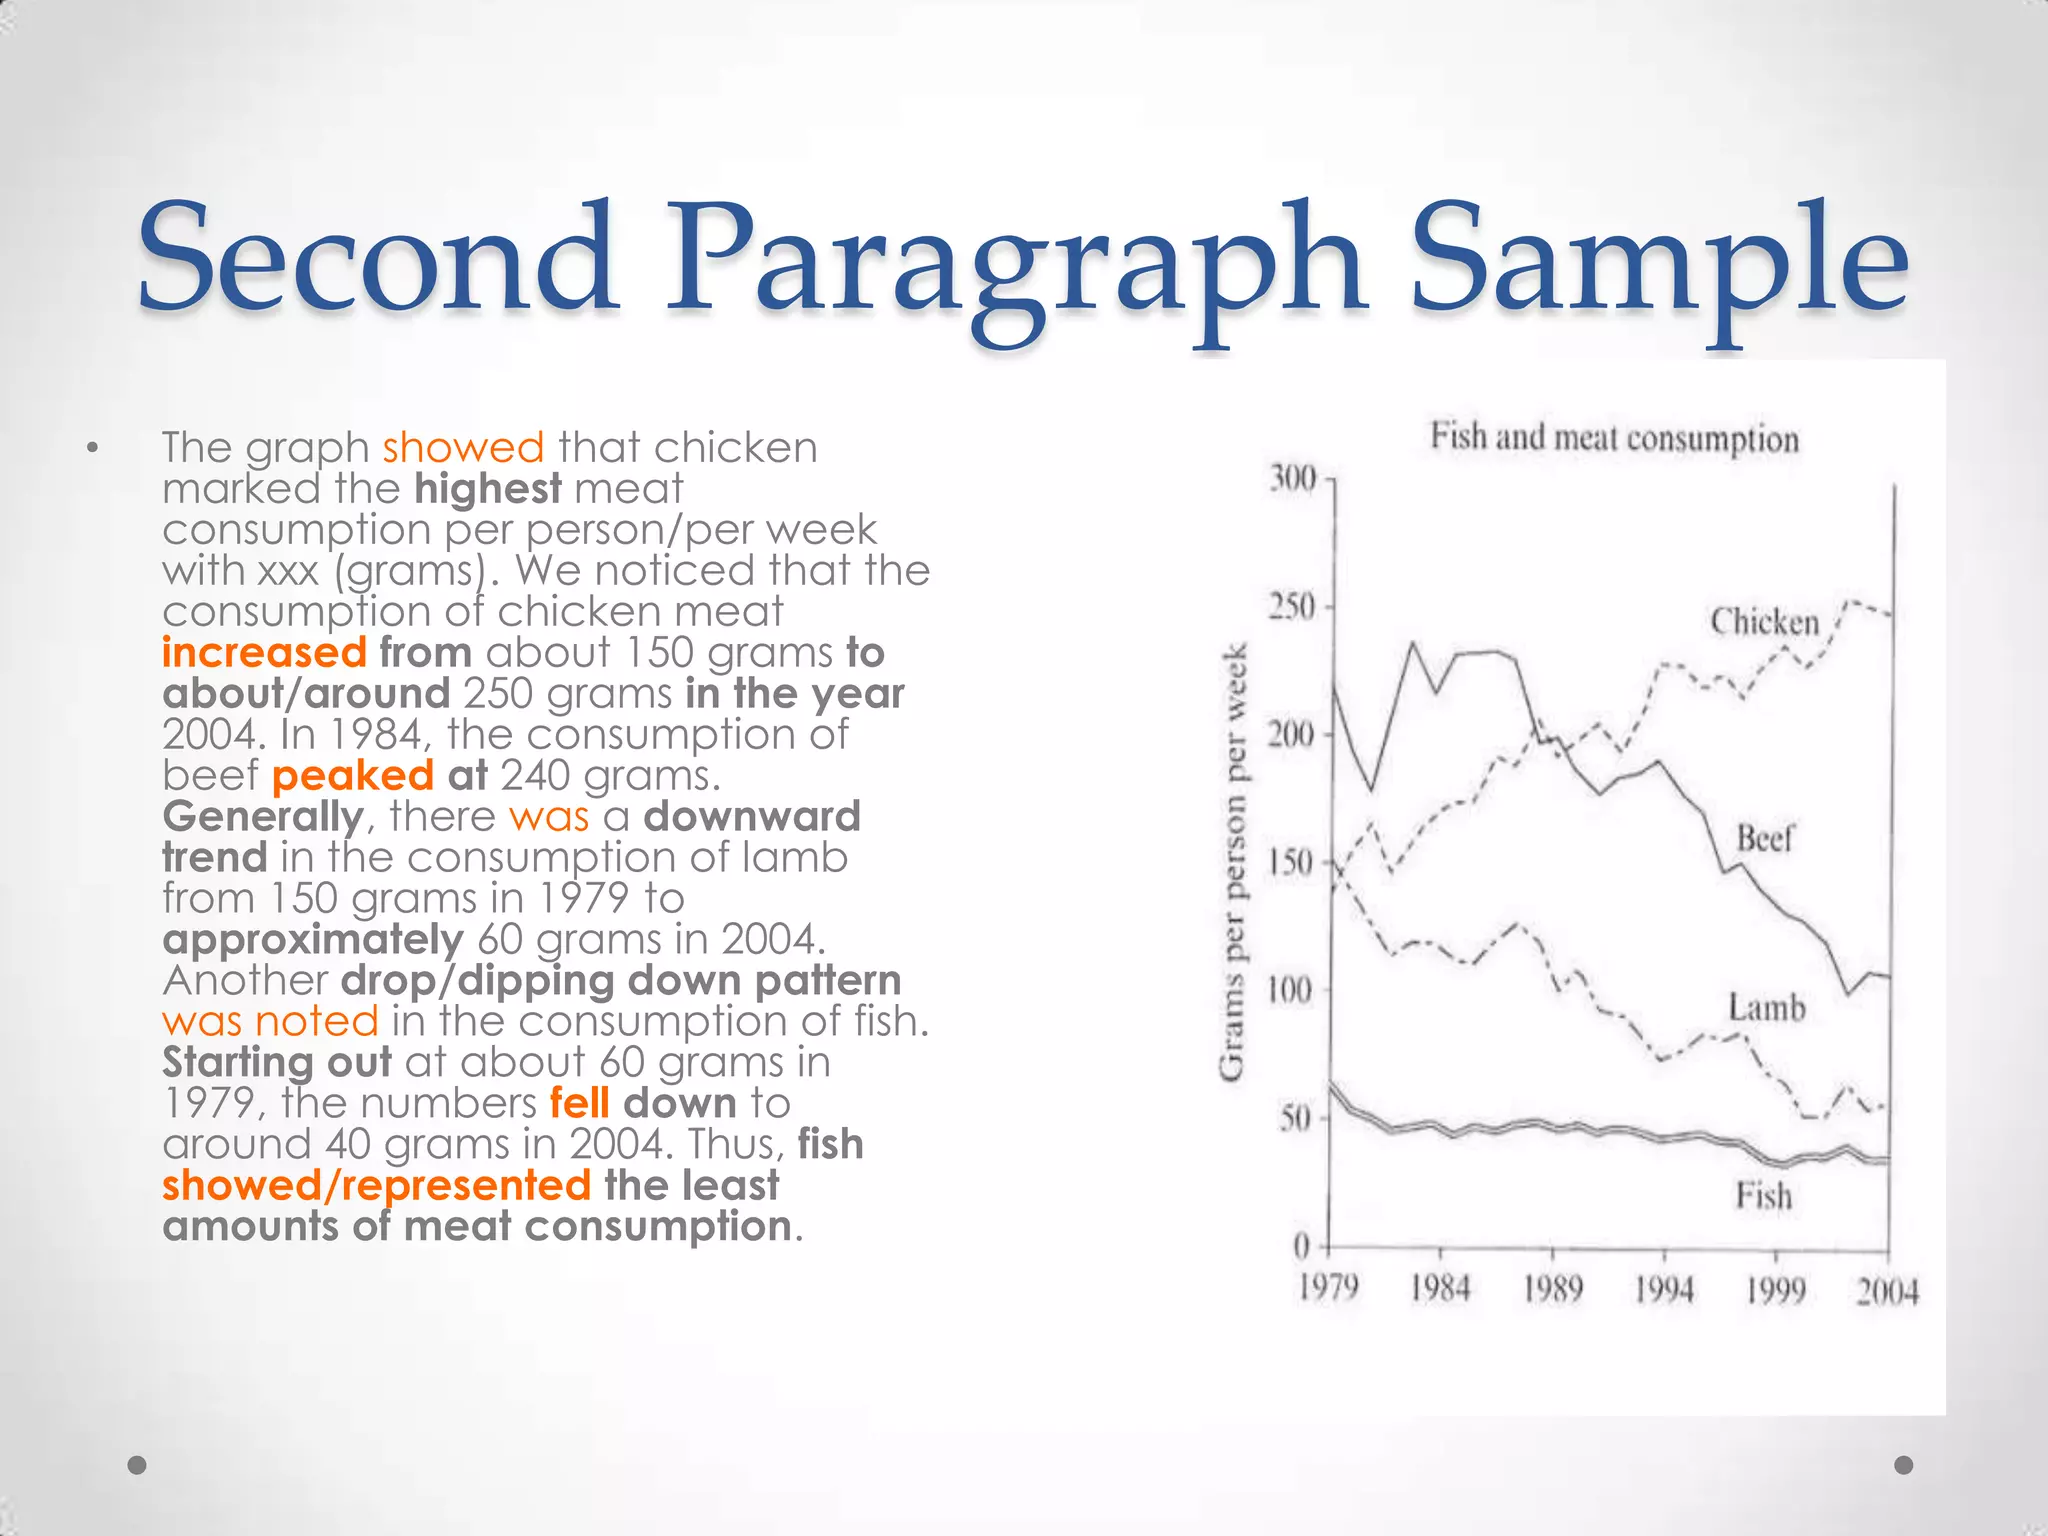
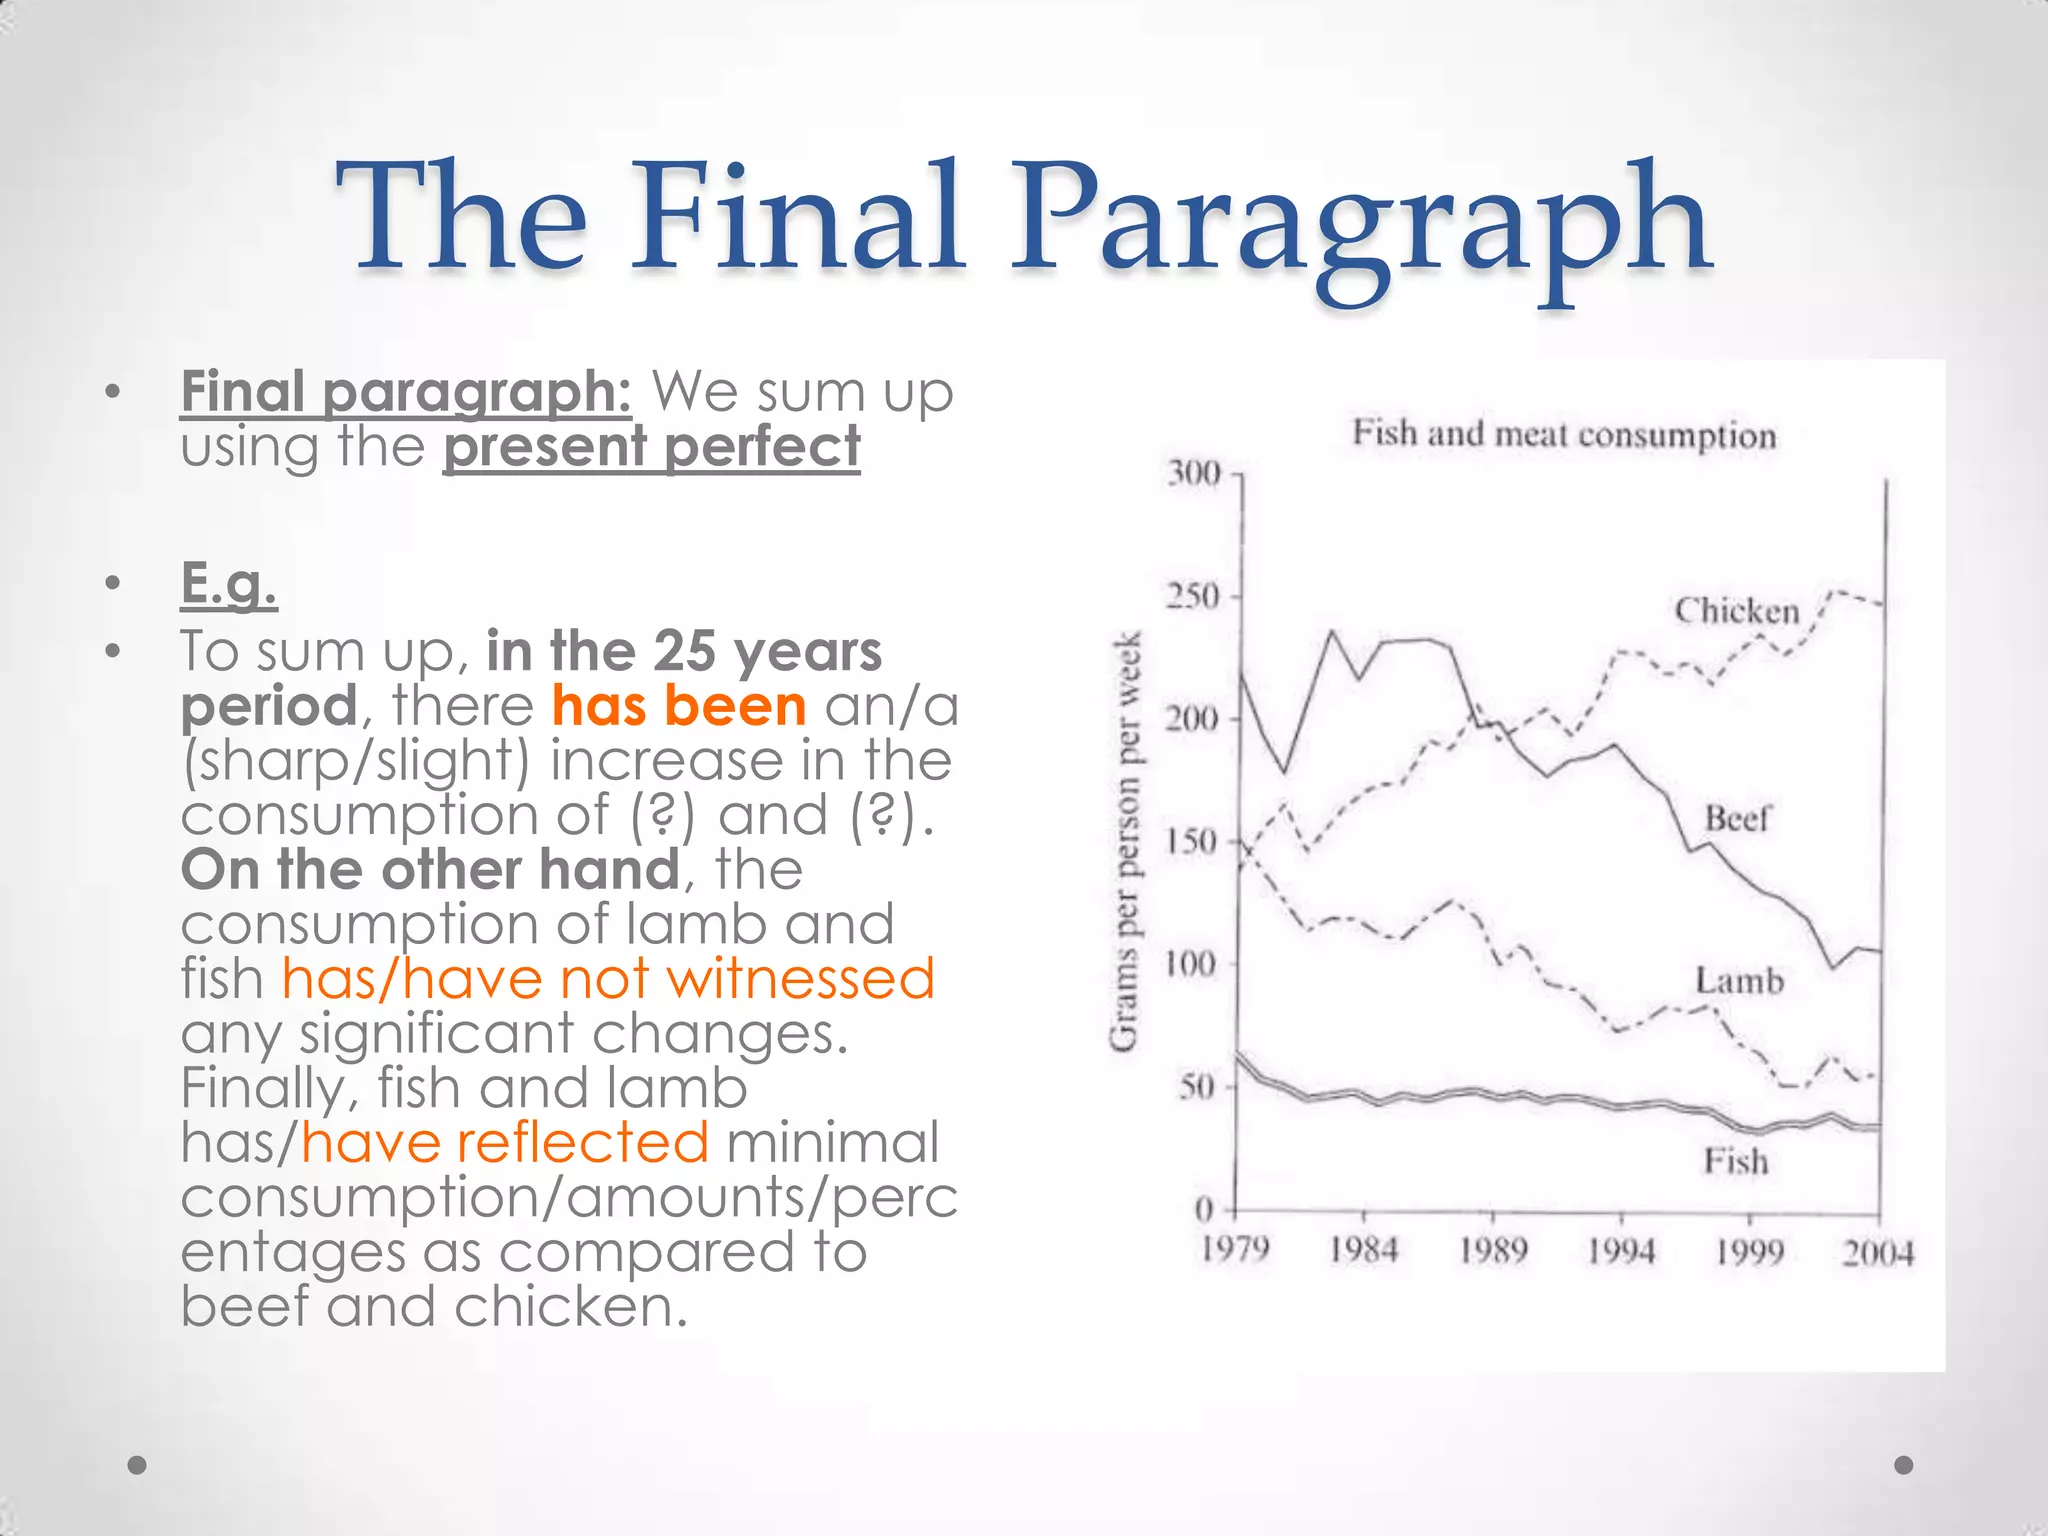


The document provides a sample response for summarizing a line graph as part of an IELTS writing task. It recommends using the simple present tense to introduce the graph in the first paragraph, the simple past tense to report numbers and trends in the second paragraph, and the present perfect tense to summarize in the third paragraph. An example second paragraph compares the consumption patterns of different meats and fish over time, noting increases in chicken and decreases in lamb and fish consumption. The document advises using details from the graph prompt and comparing quantities to fully address the task.


