
Recommended
Recommended
More Related Content
Similar to Single Phase Electricity Meter
Similar to Single Phase Electricity Meter (20)
More from ijtsrd
More from ijtsrd (20)
Recently uploaded
Recently uploaded (20)
Single Phase Electricity Meter
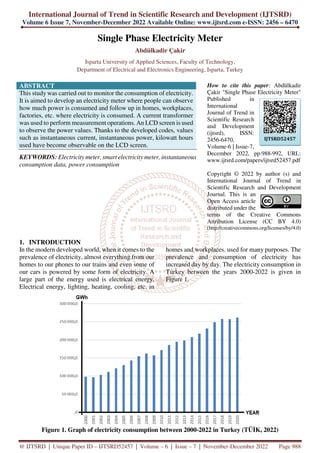
- 1. International Journal of Trend in Scientific Research and Development (IJTSRD) Volume 6 Issue 7, November-December 2022 Available Online: www.ijtsrd.com e-ISSN: 2456 – 6470 @ IJTSRD | Unique Paper ID – IJTSRD52457 | Volume – 6 | Issue – 7 | November-December 2022 Page 988 Single Phase Electricity Meter Abdülkadir Çakir Isparta University of Applied Sciences, Faculty of Technology, Department of Electrical and Electronics Engineering, Isparta, Turkey ABSTRACT This study was carried out to monitor the consumption of electricity. It is aimed to develop an electricity meter where people can observe how much power is consumed and follow up in homes, workplaces, factories, etc. where electricity is consumed. A current transformer was used to perform measurement operations. An LCD screen is used to observe the power values. Thanks to the developed codes, values such as instantaneous current, instantaneous power, kilowatt hours used have become observable on the LCD screen. KEYWORDS: Electricity meter, smart electricity meter, instantaneous consumption data, power consumption How to cite this paper: Abdülkadir Çakir "Single Phase Electricity Meter" Published in International Journal of Trend in Scientific Research and Development (ijtsrd), ISSN: 2456-6470, Volume-6 | Issue-7, December 2022, pp.988-992, URL: www.ijtsrd.com/papers/ijtsrd52457.pdf Copyright © 2022 by author (s) and International Journal of Trend in Scientific Research and Development Journal. This is an Open Access article distributed under the terms of the Creative Commons Attribution License (CC BY 4.0) (http://creativecommons.org/licenses/by/4.0) 1. INTRODUCTION In the modern developed world, when it comes to the prevalence of electricity, almost everything from our homes to our phones to our trains and even some of our cars is powered by some form of electricity. A large part of the energy used is electrical energy. Electrical energy, lighting, heating, cooling, etc. in homes and workplaces. used for many purposes. The prevalence and consumption of electricity has increased day by day. The electricity consumption in Turkey between the years 2000-2022 is given in Figure 1. Figure 1. Graph of electricity consumption between 2000-2022 in Turkey (TÜİK, 2022) IJTSRD52457
- 2. International Journal of Trend in Scientific Research and Development @ www.ijtsrd.com eISSN: 2456-6470 @ IJTSRD | Unique Paper ID – IJTSRD52457 | Volume – 6 | Issue – 7 | November-December 2022 Page 989 Considering that the demand for electrical energy is increasing day by day, it is very important to deliver electrical energy to the consumer with the least loss, in the highest efficiency and in the most economical way. This importance necessitates the quality and reliability of the systems used in the generation, transmission and consumption of electrical energy. In this regard, electricity meters are an extremely effective way of measuring how much electricity we use. That way, we know how much everyone has to pay in line with how much theyuse. Mechanical meters are meters that work with a rotating disk mechanism, have a high margin of error of measurement data and cannot record consumption data. Therefore, as technology developed, electronic meters were used. Electronic meters, on the other hand, are a type of electricity meter that can record consumption data and have a low margin of error. Electricity distribution companies; buildings, factories, etc. They analyze the consumption and perform the billing processes thanks to the meters they install at the places where the power consumption is. Subscribers, on the other hand, only follow billing transactions rather than electricity consumption. Because of this, there may be unconscious use. In this study, in order to prevent unconscious consumption, subscribers should not use the meters provided by electricity distribution companies in their homes, workplaces, etc. Thanks to these meters, which can be kept in places with power consumption, it aims to track its own consumption and perform an estimated invoicing process. Rather than monthly consumption, subscribers, refrigerators, heaters, etc. With this meter, which records the instantaneous consumption data of the items with high power consumption, it can also observe which item consumes how much power. 2. RELATED WORK Karaman (2020), in his study, aimed to develop a smart electricity meter that can be managed remotely with Wi- Fi communication systems for smart grids and smart building applications. In this study, it is mentioned that a solution that does not require an additional infrastructure and investment has been developed for remote reading of meters in environments where there is a shared Wi-Fi network such as large shopping centers, business centers, mass housing estates and villa cities. Thanks to the Wi-Fi-based smart energy measurement module developed within the scope of this study, the consumption of electrical household appliances can be measured and remotely managed. In this period, when Wi-Fi technology is becoming more and more widespread in our living spaces, a mobile application design has also been realized where users can monitor their consumption information, thanks to the smart electricity meter developed within the scope of this thesis and measurement modules with Wi-Fi communication feature. The primary aim of this study is to provide Wi-Fi communication feature to smart meters in accordance with smart grid structure and smart building applications. In this study, Aydoğan and Duman (2019) designed a module that is compatible with the embedded system cards that can read the data of single-phase electricity meters compatible with the Automatic Meter Reading System from their optical ports. While doing this study, they worked on remote reading of meters, transferring data to a system centrally, and storing data. They used software, hardware and communication infrastructure systems to carry out these studies. In this study, they aimed to save the cost of the meters. They communicated the meters with the embedded system using an RS232 card. Prathik, Anitha, and Anitha (2018) aimed to make an IoT-based electricity meter in this study. The most important aim of this project is to raise awareness about energy consumption and efficient use of household appliances for energy saving. Due to manual operation, our current electricity billing system has major disadvantages. Using IoT, this system provides information on meter reading, power failure and warning systems to generate alarms when energy consumption exceeds the specified limit. This idea is implemented to collect monthly reading and reduce human dependencyto minimize technical issues with the billing process. This project extends the design and implementation of an energy monitoring system with pre-warning of the power agenda using Arduino microcontroller and GSM (Global System for Mobile Communications) module. In this study, Patel, Mody, and Goyal (2019) performed remote reading of electricity meters by using the GSM module. The current metering system can be changed minute by minute to apply the recommended meter. The suggested scheme is to connect an LDR sensor to the flashing LED and send the data to the microcontroller via the GSM shield. RTC provides a delay and causes an interrupt action. The system includes the freedom to reconfigure via SMS as well as the provision to send an SMS to the user for an update on energy consumption along with final invoice generation. The interruption of the power supply, optionally or due to pending dues, was implemented using a relay.
- 3. International Journal of Trend in Scientific Research and Development @ www.ijtsrd.com eISSN: 2456-6470 @ IJTSRD | Unique Paper ID – IJTSRD52457 | Volume – 6 | Issue – 7 | November-December 2022 Page 990 3. SINGLE PHASE ELECTRICITY METER In this study, it is aimed to create a counter that measures how much power is consumed byelectronic materials in our homes and can record consumption data. In this direction, there is a need for current transformers that enable the necessary measurement processes for the meter. Some passive circuit elements such as capacitors and resistors are used to connect the Arduino UNO and the current sensor. Figure 2 shows the connection diagram of the Current Sensor with Arduino. Since the LCD Screen to be used will be placed on the Arduino, the current sensor connection is soldered to the LCD screen. In order to calculate the values of the capacitors and resistors to be used for the connection, it is necessary to have the rotation ratio of the current sensor used. The current sensor used is 100A, a current sensor with a 2000:1 turn ratio. The fixed resistance value required for this is 56 ohms. The value of the capacitor used is 10µF which is sufficient for most Current Transformer ranges in home applications. To get the 2.5V reference voltage from the Arduino, two divider resistors are needed and they must be of the same value. Since there is no need for much current, 2 100kΩ resistors are used. Figure 2. Block diagram of the system 3.1. Current Sensor Circuit Connection Current sensors need a load resistor between their wires when they are to be used in the circuit. This is because the current passing through the primary winding creates a magnetic flux on the magnetic iron core. The magnetic flux on the core causes a voltage to be induced on the secondary winding. Therefore, the secondary ends are connected to the load resistor. Otherwise, a reverse magnetic flux will not occur and the iron core will heat up and fail. In Figure 3, the current sensor and circuit setup are shared. As can be seen, a load resistor is placed between the cables of the current sensor. Figure 3. Current sensor circuit connection 3.2. LCD Screen and Current Sensor Phase Connection LCD screen is used to observe the amount of power and current used. Since the LCD Screen will be placed on the Arduino, 5V, GND and A1 pins; The created current sensor is combined with the circuit connection. Figure 4 shows the connection of the LCD Shield and the current sensor. Figure 5 shows the connection of the current sensor to the phase input. Figure 4. LCD and current sensor connection
- 4. International Journal of Trend in Scientific Research and Development @ www.ijtsrd.com eISSN: 2456-6470 @ IJTSRD | Unique Paper ID – IJTSRD52457 | Volume – 6 | Issue – 7 | November-December 2022 Page 991 Figure 5. Current sensor phase connection 3.3. Field Application Instantaneous current, instantaneous power, kilowatt- hours and maximum power values are reflected on the LCD screen thanks to the developed codes. First of all, a 3x600W heater was used for the application (Figure 6). In order for us to see the kilowatt hour in Figure 7, the heater was operated at the 1st stage and the values on the counter were reflected after 1 hour of observation. In Figure 8, the values of the heater in the third stage are reflected. There is a 1.2% margin of error. Figure 6. 3x600W Heater Values Figure 7. One hour power consumption of the heater Figure 8. Power consumption of the heater in the 3rd stage For another application, a 1000-1200W hair dryer was used (Figure 9). RMS (instantaneous) value and maximum value were examined. The power values in the first and second stages are shown in Figure 10. Figure 9. Hair dryer power values
- 5. International Journal of Trend in Scientific Research and Development @ www.ijtsrd.com eISSN: 2456-6470 @ IJTSRD | Unique Paper ID – IJTSRD52457 | Volume – 6 | Issue – 7 | November-December 2022 Page 992 Figure 10. Power values of the machine in the first and second stages 4. CONCLUSIONS Within the scope of this study, an electricity meter has been developed where subscribers can control their own consumption. Parts such as current transformers required for electricity meters were supplied and their connections were made with Arduino. The current sensor used is combined with the necessary passive circuit elements and made usable. Data such as instantaneous current, instantaneous power, and kilowatt-hours used can be read on the LCD screen. Subscribers can analyze their own consumption and estimate the billing process by using this meter, apart from the electricity meters that electricity providers install outside the building or in factories. 5. REFERENCES [1] Aydoğan, T., & Duman, H. (2019). Elektronik- Elektrik Sayaç Verilerinin Optik Porttan Gömülü Sistem Geliştirme Kartları ile Okunması. Kütahya Dumlupınar Üniversitesi, Fen Bilimleri Enstitüsü Dergisi, 42, 27-36. [2] Karaman, B. (2020). Akıllı şebekeler ve akıllı bina uygulamaları için wi-fi tabanlı yeni nesil elektrik sayacı tasarımı. (Master Thesis Master Thesis). Manisa Celal Bayar University, Institute of Science and Technology, Department of Electrical and Electronics Engineering, [3] Patel, H. K., Mody, T., & Goyal, A. (2019). Arduino based smart energy meter using GSM. Paper presented at the 2019 4th International Conference on Internet of Things: Smart Innovation and Usages (IoT-SIU). [4] Prathik, M., Anitha, K., & Anitha, V. (2018). Smart Energy Meter Surveillance Using IoT. Paper presented at the 2018 International Conference on Power, Energy, Control and Transmission Systems (ICPECTS), Chennai, India. [5] TÜİK. (2022). TEİAŞ Türkiye Elektrik Üretim - İletim istatistikleri. Retrieved from https://data.tuik.gov.tr/Bulten/DownloadIstatisti kselTablo?p=vdcAquIDAWkvcdBlI66Osj/ZK8 Xqr2yeIPgf9cfPEihNxGR4laV3fN/KUNoQ6Vt h