The physicochemical parameters and heavy metals in produced water effluent and receiving Ugborodo river in Escravos of the Niger Delta was evaluated. The sampling technique applied was purposive which was designed in descriptive statistical manner involving means and standard deviations, to ensure that all the parameters analysed were effectively recorded and presented accurately. Samples were collected at three points namely produced water effluent at point of discharge, and Upstream and Downstream of the receiving river for comparisons. Findings revealed that pH 7.37 , temperature 31ºC , total suspended solids 36mg l and biochemical oxygen demand 152mg l are within the permissible limit as regulated by Department of Petroleum Resources DPR . The corresponding results of the upstream and downstream samples are also in line and therefore no considerable environmental concern to the ecosystem. However, salinity 9396mg l , turbidity 50NTU , total dissolved solids 11409mg l , chemical oxygen demand 215mg l and total hydrocarbon content 35mg l analyses results indicate slightly higher values than the permissible limits. These higher values could lead to environmental concerns over time therefore, it is recommended that further treatment of the produced water to meet regulatory standards is necessary before discharging to the environment. There is therefore the need to improve treatment facilities, procedures, enforcing compliance and strict supervision to meet standards before discharging of produced water effluent into the environment. In conclusion, this study has created the awareness of the possible environmental impact that may arise from the continuous discharge of produced water effluent that is less than adequate in treatment and management into the Ugborodo river in Escravos, Delta State in the Niger delta. Igonikon, Abariowua Chidiadi | S. A. Ngah | C. L. Eze "Evaluating Water Quality in the Oil and Gas Exploitation Regions within the Excravos River Catchment" Published in International Journal of Trend in Scientific Research and Development (ijtsrd), ISSN: 2456-6470, Volume-6 | Issue-1 , December 2021, URL: https://www.ijtsrd.com/papers/ijtsrd47758.pdf Paper URL: https://www.ijtsrd.com/other-scientific-research-area/enviormental-science/47758/evaluating-water-quality-in-the-oil-and-gas-exploitation-regions-within-the-excravos-river-catchment/igonikon-abariowua-chidiadi
2. International Journal of Trend in Scientific Research and Development @ www.ijtsrd.com eISSN: 2456-6470
@ IJTSRD | Unique Paper ID – IJTSRD47758 | Volume – 6 | Issue – 1 | Nov-Dec 2021 Page 180
Oil wells sometimes produce large volumes of water
with the oil, while gas wells tend to produce water in
smaller proportion.
Produced Water which is natural water or formation
water is always found together with petroleum in
reservoirs. It is slightly acidic and sits below the
hydrocarbons in porous reservoir media, (Reynolds,
2003). Extraction of oil and gas leads to a reduction
in reservoir pressure, and additional water is usually
injected into the reservoir water layer to maintain
hydraulic pressure and enhance oil recovery.
Produced water has a complex composition, but its
constituents can be broadly classified into organic and
inorganic compounds including dissolved and
dispersed oils, grease, heavy metals, radionuclides,
treating chemicals, formation solids, salts, dissolved
gases, scale products, waxes, microorganisms and
dissolved oxygen, (Hayes and Arthur, 2004).
Globally, ∼250 million barrels of water are produced
daily from both oil and gas fields, and more than 40%
of this is discharged into the environment.
Oilfields are responsible for more than 60% of daily
waste water effluent generated worldwide, (Fakhru'l-
Razi et al., 2009). The rate of oilfield produced water
production is expected to increase as oilfield ages.
Other factors have been reported to affect the quantity
of produced water generated in an oilfield. This is
because, Oil field operators are particularlyinterested
in producing crude oil with little attention paid to the
“necessary evil” (produced water) that comes with it.
This produced water though field-dependent contains
a variety of inorganic and organic compounds such as
emulsified oil, organic compounds including
dissolved hydrocarbons, organic acids, phenols and
traces of chemicals added during production,
inorganic compounds, suspended solids, dissolved
solids and natural low-radioactive elements. As the
reservoir matures injected produced water swipes
through to the producing zone and water production
increases with time which causes abandonment of the
well. Oil field brine or produced water associated
with hydrocarbon production is usuallyremoved from
the petroleum products before they can be transported
and used. In the hydrocarbon producing area of the
Nigerian Niger Delta, produced water volume has
risen, because many of its oil and gas fields have
declined in production with increased water cut.
Ideally, the generated produced waters are usually
pressurized, separated by gravitation, and enhanced
by heat treatment or using de-emulsifiers before being
re-injected down a well, either for disposal or
enhanced recovery of hydrocarbons.
However, in the Niger Delta and some oil producing
fields of the world, the produced water is discharged
into coastal waters (Erakhrumen, 2015), thereby
causing potential impacts on the coastal aquatic
ecosystem.
According to Stephenson (1992), oil field brine or
produced water is the most enormous waste effluent
of the hydrocarbon production processes. It comprises
several compounds such as dispersed oil, dissolved
organic compounds which include aromatic
hydrocarbons, phenols, organic acids, inorganic
compounds, as well as relics of chemical substances
derived during the separation process. The amounts of
these associated compounds vary from one oil well to
another in a field, and during the production span of
the well. The polycyclic aromatic hydrocarbons
(PAH), monocyclic aromatic hydrocarbons (benzene,
toluene, ethyl benzene, and xylene—BTEX) and
high-molecular-weight phenols have been observed to
be the major pollutants from oil field brine. In
addition, the studies of Sturve et al. (2006), Carls et
al. (2008), observed that the polycyclic aromatic
hydrocarbons (PAHs) and high-molecular-weight
phenols could result to incomplete growth cycle in
organisms as they usually have the potential to cause
gene mutation and cancer. The high-molecular-weight
phenols also have the potential to disrupt the
endocrine development in organisms (Arukwe et al.,
2000). Benzene, toluene, ethyl benzene, and xylene,
on the other hand, are highly volatile and relatively
soluble in seawater, thereby increase the degree of
toxicity with increasing molecular weight (Arukwe et
al., 2001).
Among the inorganic constituents, heavy metals are
of environmental concern (OGP 2002). According to
Mac-Donald et al. (1996), heavy metals can have
deleterious effects on the environment and public
health especially if present at levels above toxicity
threshold. For example, the works of Miao et al.
(2005) and Lin et al., (2011) showed that copper (Cu)
and zinc (Zn) (heavy metals) can be transported and
deposited with the sea sediments and organisms.
Greater concentrations of these metals in seawater
according to Flemming and Trevors (1989) and Stohs
and Bagchi (1995) have been known to cause growth
imbalance to aquatic organisms. Such negative effects
include reduction in the rates of reproduction,
oxidation-level reduction, and death of cell, which
eventually cause damage to organisms’ gills, liver,
kidneys, and nervous systems. In addition, at lower
concentrations and greater exposure to sea or
sediments contaminated with these metals, they can
cause stunted growth, lower the rate of photosynthesis
of plants, and change the abundance composition of
3. International Journal of Trend in Scientific Research and Development @ www.ijtsrd.com eISSN: 2456-6470
@ IJTSRD | Unique Paper ID – IJTSRD47758 | Volume – 6 | Issue – 1 | Nov-Dec 2021 Page 181
animals (Morrisey et al., 1996). Many other heavy
metals such as chromium (Cr), cadmium (Cd), and
lead (Pb) can cause various acute or chronic
toxicities; and the bioaccumulation potential of these
heavy metals enhances their environmental problems.
This study therefore seeks to determine the
physicochemical properties, heavy metals and
hydrocarbon contents of produced water discharged
into the Escravos River, Delta State.
Material and Methods
The Niger Delta region is situated in the Southern
part of Nigeria and bordered to the South by the
Atlantic Ocean and to the East by Cameroon. It
occupies a surface area of about 112,300 square
kilometers and represents 12% of Nigeria’s total
surface area. Its wetlands of 70,000km2
which are the
largest in Africa form basically sediment depositions.
The Niger Delta has a well-endowed ecosystem
containing one of the highest concentrations of
biodiversity on the planet. Its arable terrain can
sustain a wide variety of crops, lumber of agricultural
trees and many species of fresh water fish than any
ecosystem in Africa.
The Ugborodo River is a tributary of the Escravos
River in southern Nigeria. "Escravos" is a Portuguese
word meaning "slaves" and the area was one of the
main conduits for slave trade between Nigeria and the
United States in the 18th century. The Escravos river
is a distributary of the Niger River, it flows for 57
kilometres (35 mi), ending at the Bight of Benin of
the Gulf of Guinea where it flows into the Atlantic
Ocean, a major US oil company, has its main
Nigerian oil production facility at the mouth of the
Escravos River. It lies within latitude 5°36'24.54"N
and longitude 5°11'38.31"E of the delta.
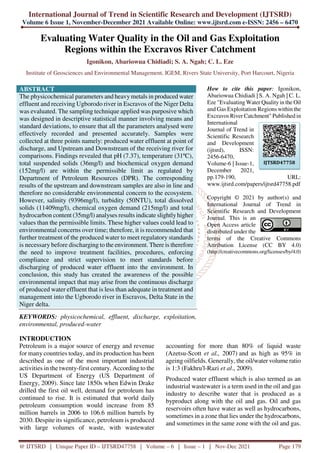
Fig. 1: Map of Niger Delta showing Escravos River, the Location of the Study Area
The hydrology of the Niger Delta is dependent primarily on the River Niger. The River Niger drains a large part
of the West African sub region and discharges sediment laden water into the Atlantic Ocean through the Niger
Delta. The delta is fan shaped in geometry with an apex located some 250 km from the Ocean at Onitsha. The
River Niger bifurcates into two main distributaries, the Nun and Forcados rivers, some 100 km south of the apex
creating a coastline spanning over 450 km. Water and sediments from the delta empty into the Atlantic Ocean
through 11 major rivers namely: Imo river, Bonny river, San Bathelomeo river, Brass river, Nun river,
Pennington river, Dodo river, Ramos river, Forcados river, Escravos river and the Benin river. Ugborodo river is
a tributary of the Escravos river. These rivers which make up the main drainage outlet have fairly large river
mouths of about 1.3 km to 5 km, opening into the Atlantic Ocean.
As a wave dominated delta, the fluvial influence on the development of the Niger delta is relatively weak.
However, river forces have been responsible for the transport and deposition of sediments especially in areas
where there have been accretion and significant land growth, and other phenomena such as the vegetation of
previously bare land and waterbodies. This situation is quite evident in the section between Dodo and the
4. International Journal of Trend in Scientific Research and Development @ www.ijtsrd.com eISSN: 2456-6470
@ IJTSRD | Unique Paper ID – IJTSRD47758 | Volume – 6 | Issue – 1 | Nov-Dec 2021 Page 182
Escravos river. The development and disappearance of near offshore in the mouth of the San Bathelomeo river is
also a possible consequence of sediment discharge into the Atlantic Ocean. Hence the nature of the River Niger
system, and its main tributaries of the Nun and Forcados river is an important player in coastline
dynamics,Abam, et al. (2004). Figure 3.1 shows map of the Niger Delta where Escravos river is situated.
The study adopted an experimental design and a Purposive Sampling Method in examining the produced water
effluent discharged into the Ugborodo River froman oil terminal, Escravos, Delta State. Samples of produced
water from the Point of Discharge, and Upstream and Downstream of the point of discharge of the receiving
river were collected.. Samples were collected at three main points, Upstream, Point of Discharge and
Downstream.
Table 1 Sampling Points and Coordinates
Sample Points: Upstream Produced Water Downstream
Latitude: 5°36'24.54"N Latitude: 5°36'21.13"N Latitude: 5°36'16.89"N
Longitude: 5°11'26.88"E Longitude: 5°11'32.04"E Longitude: 5°11'38.31"E
The upstream and downstream sampling points are about 30 meters from the point of discharge of the produced
water effluent into the Ugborodo River as shown in Fig. 1.
Fig. 2: A Map Showing Ugborodo River and Sampling Points
5. International Journal of Trend in Scientific Research and Development @ www.ijtsrd.com eISSN: 2456-6470
@ IJTSRD | Unique Paper ID – IJTSRD47758 | Volume – 6 | Issue – 1 | Nov-Dec 2021 Page 183
The collected samples were taken to End Point Laboratory, AGIP Estate, Port Harcourt for assessment and
evaluation of their physicochemical properties and heavy metals to ascertain that discharged produced water
meets the required standard.
Standard field methods were used in the samples collection at the sampling locations. Sample collection was
done by dipping the sample bottles into the medium after rinsing the sample bottles with the same medium. It
involves dipping a laboratory glass sampler bottle into the effluent at the point of discharge into the river, as
midstream, where a representative sample was collected and also at the upstream and downstream of the point of
discharge into the Escravos River. I obtained a sample that meets the requirements of the sampling program.
Collected samples were taken to the Lab for analyses, however, proper handling of samples was ensured to avoid
samples being deteriorated, contaminated or compromised before it is analyzed.I ensured that all sampling
equipment were clean and free from contaminants.
Samples for BOD was collected in amber glass bottles while samples for other physicochemical parameters were
collected in plastic containers. Also, sample for hydrocarbon content analysis was collected in glass bottle. For
measurements of heavy metal concentration levels, few drops of concentrated nitric acid was added to acidify
the various samples.
The effluent samples were collected in plastic bottles. The bottles were made ready by first rinsing them with the
same sample medium before collecting the samples to avoid contamination. Samples collection involves dipping
the sampling bottles completely in the effluent at the point of discharge, and then upstream and downstream
samples of the Ugborodo River and collected representative samples. The samples collected from the river are to
serve as a baseline to determine the condition of the river as a result of the continuous discharge of produced
water effluent into it. The collected samples were labelled properly, stored in ice-parked cooler and taken to the
laboratory, End Point Laboratory, for physicochemical properties and heavy metals analyses. Each sample
collected was further divided into three samples (Samples 1, 2 and 3) and analyzed accordingly to ascertain
correctness of the analyses results.
Results and Discussion
The results obtained in this study are presented in Tables 4.1 – 4.6.
Physicochemical Parameters and Heavy Metals
Table 2: Levels of Physicochemical Parameters in Produced Water Effluent Sample
S/N Parameters Method (Code) Sample 1 Sample 2 Sample 3 Average SD(±)
1. pH APHA 4500-HᶧB 7.38 7.34 7.40 7.37 0.03
2. Temperature(°C) APHA 2550B 30.92 31 31 31 0.14
3. Salinity(mg/l) APHA 25208 9390 9397 9400 9396 5.13
4. TDS(mg/l) APHA 2540C 11408 11412 11406 11409 3.06
5. Turbidity(NTU) APHA 2130C 37 40 39 39 1.53
6. TSS(mg/l) APHA 2540D 42 46 43 44 2.08
7. BOD5(mg/l) APHA 5210B 152 148 157 152 4.51
8. COD(mg/l) APHA 5220C 210 216 220 215 5.03
9. THC(mg/l) API 45 & EPA 418.1/413.2 38 35 33 35 2.52
Table 3: Levels of Physicochemical Parameters in Upstream Water Sample
S/N Parameters Method (Code) Sample 1 Sample 2 Sample 3 Average SD(±)
1. pH APHA 4500-HᶧB 6.70 6.70 6.73 6.71 0.02
2. Temperature(°C) APHA 2550B 27.81 27.95 27.98 27.91 0.09
3. Salinity(mg/l) APHA 25208 7874 7880 7887 7880 6.51
4. TDS(mg/l) APHA 2540C 9455 9451 9452 9453 2.08
5. Turbidity(NTU) APHA 2130C 35 33 33 34 1.15
6. TSS(mg/l) APHA 2540D 26 28 25 26 1.53
7. BOD5(mg/l) APHA 5210B 98 95 92 95 3.00
8. COD(mg/l) APHA 5220C 140 145 142 142 2.52
9. THC(mg/l) API 45 & EPA 418.1/413.2 24 22 22 23 1.15
6. International Journal of Trend in Scientific Research and Development @ www.ijtsrd.com eISSN: 2456-6470
@ IJTSRD | Unique Paper ID – IJTSRD47758 | Volume – 6 | Issue – 1 | Nov-Dec 2021 Page 184
Table 4: Levels of Physicochemical Parameters in Downstream Water Sample
S/N Parameters Method (Code) Sample 1 Sample 2 Sample 3 Average SD(±)
1. pH APHA 4500-HᶧB 7.33 7.35 7.30 7.33 0.03
2. Temperature(°C) APHA 2550B 28.56 28.50 28.10 28.39 0.25
3. Salinity(mg/l) APHA 25208 6240 6250 6242 6244 5.29
4. TDS(mg/l) APHA 2540C 7560 7556 7563 7560 3.51
5. Turbidity(NTU) APHA 2130C 56 45 49 50 5.57
6. TSS(mg/l) APHA 2540D 37 35 37 36 1.15
7. BOD5(mg/l) APHA 5210B 112 118 114 115 3.06
8. COD(mg/l) APHA 5220C 180 167 192 180 12.50
9. THC(mg/l) API 45 & EPA 418.1/413.2 35 30 33 33 2.52
Table 5: Concentrations of Heavy Metals in Produced Water Effluent Sample
S/N Heavy Metals (mg/l)
Method
(Code)
Sample 1 Sample 2 Sample 3 Average SD(±)
1. Cr APHA 3111C <0.005 <0.005 <0.005 <0.005 0.00
2. Cu APHA 3111C <0.004 <0.004 <0.004 <0.004 0.00
3. Cd APHA 3111C <0.0028 <0.0028 <0.0028 <0.0028 0.00
4. Fe APHA 3111C 0.705 0.712 0.696 0.704 0.01
5. Pb APHA 3111C 0.031 0.024 0.038 0.031 0.01
6. Zn APHA 3111C 0.116 0.121 0.130 0.122 0.01
7. Ni APHA 3111C 0.141 0.148 0.156 0.148 0.01
8. Mg APHA 3111C 1.647 1.650 1.638 1.645 0.01
9. Na APHA 3111C 1.927 1.938 1.930 1.932 0.01
10. V APHA 3111D <0.12 <0.12 <0.12 <0.12 0.00
Table 6: Concentrations of Heavy Metals in Upstream Water Sample
S/N Heavy Metals (mg/l) Method (Code) Sample 1 Sample 2 Sample 3 Average SD(±)
1. Cr APHA 3111C <0.005 <0.005 <0.005 <0.005 0.00
2. Cu APHA 3111C <0.004 <0.004 <0.004 <0.004 0.00
3. Cd APHA 3111C <0.0028 <0.0028 <0.0028 <0.0028 0.00
4. Fe APHA 3111C 0.503 0.386 0.365 0.418 0.07
5. Pb APHA 3111C <0.012 <0.012 <0.012 <0.012 0.00
6. Zn APHA 3111C 0.011 0.015 0.018 0.015 0.00
7. Ni APHA 3111C 0.021 0.020 0.020 0.020 0.00
8. Mg APHA 3111C 1.821 1.822 1.816 1.820 0.00
9. Na APHA 3111C 2.609 2.776 2.104 2.496 0.35
10. V APHA 3111D <0.12 <0.12 <0.12 <0.12 0.00
Table 7: Concentrations of Heavy Metals in Downstream Water Sample
S/N Heavy Metals (mg/l) Method (Code) Sample 1 Sample 2 Sample 3 Average SD(±)
1. Cr APHA 3111C <0.005 <0.005 <0.005 <0.005 0.00
2. Cu APHA 3111C <0.004 <0.004 <0.004 <0.004 0.00
3. Cd APHA 3111C <0.0028 <0.0028 <0.0028 <0.0028 0.00
4. Fe APHA 3111C 0.355 0.376 0.397 0.376 0.02
5. Pb APHA 3111C <0.012 <0.012 <0.012 <0.012 0.00
6. Zn APHA 3111C 0.164 0.192 0.173 0.176 0.01
7. Ni APHA 3111C 0.038 0.042 0.042 0.041 0.00
8. Mg APHA 3111C 1.985 1.947 1.909 1.947 0.04
9. Na APHA 3111C 2.497 2.613 2.497 2.536 0.07
10. V APHA 3111D <0.12 <0.12 <0.12 <0.12 0.00
Physicochemical Properties
The analyses results obtained indicate that some
physicochemical parameters have values that are
negligible while others that have slightly higher
values require further treatment of the produced water
to meet regulatory standards is recommended before
7. International Journal of Trend in Scientific Research and Development @ www.ijtsrd.com eISSN: 2456-6470
@ IJTSRD | Unique Paper ID – IJTSRD47758 | Volume – 6 | Issue – 1 | Nov-Dec 2021 Page 185
discharging to the environment as stated by the
regulatory authority, Environmental Guidelines and
Standards for the Petroleum Industry in Nigeria
(EGASPIN) 2018 by the regulatory body, DPR as
referenced.
pH
The pH analyses result of the produced water effluent
was 7.37, this value is within the permissible limit of
the regulatory authority, Department of Petroleum
Resources (DPR) which ranges from pH value of 6.5
– 8.5 as an acceptable or permissible limit for
produced water effluent to be discharged to the
environment. The results obtained from the upstream
and downstream samples (6.71 and 7.33 respectively)
are also in line with the permissible limits and
therefore no environmental concern.
Temperature (ºC)
Temperature is the degree of hotness or coldness of a
body. The produced water temperature average value
of 31ºC is within the permissible limit of the
regulatory authority which ranged from 27°C – 31°C
as an acceptable limit for produced water effluent to
be discharged within inland and near shore
environments according to the regulatory body
(DPR). The results indicate that there will be no
negative environmental impact.The analyses result of
the upstream and downstream samples of 27.91ºC and
28.39ºC respectively also indicate no negative impact
on the environment.
Salinity (mg/l)
The average salinity value for the produced water
effluent analysis was 9396mg/l. The difference in
values of upstream and downstream is as a result of
dilution during the flooding processes. The obtained
value is above the permissible limit of 600mg/l –
2000mg/l for inland and near shore environments
from the regulatory authority, therefore
environmental concern is expected.
High ion and chloride concentration results in water
hardness and acidity of the surrounding waters which
may be harmful for rural dwellers depending on the
rivers and lakes around them for water supply for
their daily survival. Meeting discharge regulatory
specifications is the only way out of this harm that
may befall human lives, aquatic lives and the
ecosystem.
Turbidity (NTU)
The analysis result for turbidity was 50NTU, this
value is above the permissible limit of ˂10 and ˂15
for inland and near shore environments and no limit
for offshore environments by the regulatory body
(DPR) as stated in the Environmental Guidelines and
Standards for the Petroleum Industry in Nigeria
(EGASPIN). Also, 34NTU and 50NTU which are
values for the upstream and downstream processes
respectively show that turbidity increased during the
ebbing phase due to dissolved solids from inland.
Total Dissolved Solids (TDS)
The produced water effluent analyses result obtained
for Total Dissolved Solids was 11409mg/l. This value
is over two times greater than the permissible limit of
2000mg/l – 5000mg/l for inland and near shore
environments respectively from the regulatory
authority (DPR). This also affected the analyses
results for upstream and downstream samples of
9453mg/l and 7560mg/l respectively, therefore
negative environmental impact is a concern here.
Total Suspended Solids (TSS)
The Total Suspended Solids value for the produced
water effluent of 44mg/l is within the permissible
limit of ˂30mg/l - ˂50mg/l for inland and near shore
ecosystem respectively from DPR. Upstream and
downstream samples results are (26mg/l and 36mg/l)
respectively are also in line with the permissible limit,
therefore, there is no environmental concern.
Total suspended solids exceeding required limit
present in produced water as well as oil and grease
content would result in discharge of oily water into
the environment, polluting the environment and
destroying the ecosystem and aquatic habitat. These
could be very harmful because the important
component in the marine and aquatic food web
(phytoplankton, periphyton, sphergiral and
zooplankton) would be destroyed. Respiration of
aquatic animals would be hampered by the sealing
caused by large oil droplets in aquatic habitats. This
results in suffocation of aquatic animals.
Biochemical Oxygen Demand (BOD)
The produced water effluent analyses average value
for Biochemical Oxygen Demand is 152ml/g. This
value is within the permissible limit of 140mg/l –
313mg/l for inland and near shore ecosystem
respectively as regulated by DPR. The values for the
upstream and downstream samples analyses results
(95mg/l and 115mg/l) were lower than that of the
produced water as a result dilution from the receiving
river. Therefore, there is no environmental concern or
negative impact on the environment.
Chemical Oxygen Demand (COD)
Chemical Oxygen Demand is defined as the amount
of a specified oxidant that reacts with the sample
under controlled conditions. The produced water
effluent value for COD was 215mg/l. This value is
slightly higher than the permissible limit of 125mg/l
for inland and near shore environments and no limit
for offshore environments as regulated by DPR as
8. International Journal of Trend in Scientific Research and Development @ www.ijtsrd.com eISSN: 2456-6470
@ IJTSRD | Unique Paper ID – IJTSRD47758 | Volume – 6 | Issue – 1 | Nov-Dec 2021 Page 186
stated in Environmental Guidelines and Standards for
the Petroleum Industry in Nigeria (EGASPIN). The
upstream and downstream analyses results of 142mg/l
and 180mg/l show increase in value above the
regulated value. Concentration levels of chemical
oxygen demand of the produced water effluent is
higher than that of the receiving river, environment
will be impacted in the long run.
Total Hydrocarbon Content (THC)
The Total Hydrocarbon Content analysis result
obtained for the produced water effluent was 35mg/l.
The obtained value is slightly higher than the
permissible limit of 20mg/l by the regulatory
authority for inland and near shore environments and
no limit for offshore environments. The upstream and
downstream samples values of 23mg/l and 33mg/l is
an indication of dilution during the flooding and
ebbing process of the receiving Ugborodo river.
Heavy Metals
Ten (10) out of twenty-one (21) heavy metals that
were considered to be common in other sited works in
produced water were analyzed. In addition, a few
metals are of particular environmental concern
because their concentrations may be high enough to
cause bioaccumulation and toxicity (Ray and Rainer,
1992). Heavy metals are very harmful because of
their ability to accumulate in the bodies of fishes and
sea foods, this leads to Bioaccumulation (the gradual
accumulation of substances, such as pesticides or
other chemicals such as contaminants in an
organism). Such fishes and sea foods when consumed
by man and other animals will lead to the
accumulation of heavy metals in different parts of the
body. Heavy metals are non-degradable in nature and
have long biological half-lives because
bioaccumulation occurs when an organism absorbs a
substance at a rate faster than that at which the
substance is lost or eliminated by catabolism and
excretion. Though, they are essential components in
metabolism, they are also toxic when present in high
concentration and over a long period of time. The
quantities of heavy metals in produced water can vary
from different formations, and they vary depending
on the age and geology of the formation from which
the oil and gas are produced. The results of the heavy
metals analyzed were presented in Table 2 – 7
representing produced water effluent, upstream and
downstream samples and results discussed as follows:
Chromium (Cr)
The mean Chromium concentration in the produced
water effluent sample analysis was ˂ 0.005mg/l. This
value of ˂ 0.005mg/l is slightly higher than the
permissible limit of 0.0mg/l of the regulatory
authority (DPR). The upstream and downstream
samples analyses value was also the same as that of
the produced water effluent which is ˂ 0.005mg/l.
Therefore, environmental concern over a period of
time is expected.
Lead (Pb)
The mean Lead concentration in produced water
effluent analyses value was 0.031mg/l. Though this
value is slightly higher but is negligible going by the
allowable or permissible limit of 0.0mg/l and no limit
for inland and near shore by the regulatory authority
(DPR). Also, the upstream and downstream analyses
values are same as <0.012 is lower than that of the
produced water. Therefore, environmental concern
over a period of time is expected.
Nickel (Ni)
Nickel’s mean concentration level value of the
produced water effluent was 0.148mg/l and the
permissible limit is 0.0mg/l. The analysis value is
slightly higher than the permissible value though
negligible. Also, upstream and downstream samples
analyses values of 0.020mg/l and 0.041mg/l
respectively are smaller than that of the produced
water sample value. Therefore, environmental
concern over a period of time is expected.
Zinc (Zn)
Mean concentration level of Zinc in the produced
water effluent analysis was 0.122mg/l. This value is
considered negligible compared to the value of the
allowable limit of 1.0mg/l – 5.0mg/l by the regulator
(DPR) for inland and near shore environments
respectively is far more than the obtained value. The
upstream and downstream samples values are
0.015mg/l and 0.176mg/l respectively. Environmental
issue is not a concern here.
Cupper (Cu)
The mean concentration level of Cupper in the
produced water effluent was ˂ 0.004mg/l for all the
samples. The concentration of cupper as indicated is
of no environmental concern. Also, the permissible
limit as prescribed by DPR for inland and near shore
locations are 2mg/l and no limit respectively, which is
higher than the obtained analysis result. The same
result of 0.004mg/l was obtained for upstream and
downstream samples also. Therefore, no
environmental concern of any sort is expected.
Cadmium (Cd)
The mean concentration level of Cadmium in the
produced water effluent was ˂ 0.0028mg/l Same
concentration level was obtained in the upstream and
downstream samples. No permissible limit was giving
by the regulators. Therefore, no consequences to the
environment.
9. International Journal of Trend in Scientific Research and Development @ www.ijtsrd.com eISSN: 2456-6470
@ IJTSRD | Unique Paper ID – IJTSRD47758 | Volume – 6 | Issue – 1 | Nov-Dec 2021 Page 187
Iron (Fe)
Iron’s mean concentration level according to the
analysis result in the produced water effluent was
0.704. This value is lower than the permissible limit
value of 1.0mg/l and no limit for inland and near
shore by the regulator (DPR).The values for the
upstream and downstream samples of 0.418mg/l and
0.376mg/l respectively are also lower than that of the
produced water effluent, therefore, no threat to the
environment is envisaged.
Magnesium (Mg)
The mean level of Magnesium concentration in the
produced water effluent as per the analysis report was
1.645mg/l, this concentration value is lower than that
of the values of the upstream and downstream
samples of 1.820mg/l and 1.947mg/l respectively. No
permissible limit from the regulatory authority. This
lower value in the produced water effluent compared
to the receiving river indicates no harm to the
environment.
Sodium (Na)
Produced water sample analysis of Sodium mean
concentration level was 1.932mg/l. This has the
highest concentration of all the heavy metals analyzed
and is lower than the values of the upstream and
downstream samples results of 2.496mg/l and
2.532mg/l respectively obtained. These higher values
are attributable to the fact that salt water contains
sodium naturally as expected. However, no
environmental consequence.
Vanadium (V)
The mean concentration level of Vanadium in the
produced water effluent as analysed was < 0.12mg/l.
This value is the same for upstream and downstream
samples concentration. It is therefore negligible and
of no environmental concern of any kind going by the
allowable limit of 0.0mg/l by the regulatory authority
(DPR). From the samples analyses reports as
indicated, most of the heavy metals except chromium,
lead and nickel, have values that are lower than the
permissible limits by the regulatory authority (DPR).
This means that the environment may not be severely
affected in the short while but will be affected in the
long run.
This work is supported by studies carried out by
Oboh et al. (2009), in the Niger Delta which noted
that discharged produced waters had high metal ions
and total hydrocarbon concentrations, THC. Okoro
(2010), on the other hand, demonstrated that
produced water discharges in near shore environment
in the Niger Delta led to substantial accumulation of
hydrocarbons and microorganisms up to 500m from
discharge points. Isehunwa and Onovae (2011)
observed that the produced water discharged into the
environment had high levels of oil and grease as well
as TDS and TSS. Recent environmental impact
assessments show that contrary to the trend in the
Niger Delta, North Sea and Gulf of Mexico have
continued to review their effluent limits pursuant to
ZERO effluent discharge. This contrasts sharply with
the Niger Delta which has maintained its effluent
discharge limits for a long time without review. This
has left the region with discharged effluents that may
fall short of the needed environmental friendliness
level (Adaobi and Omowumi, 2016).
Environmental Impact
The environmental impact caused by discharging
untreated or poorly treated produced water effluent to
surface or coastal waters causes degradation of the
ecosystem and the environment at large. Therefore,
safely disposing of this highly saline water and
mitigating the effect of past disposal practices is a
national concern for environmental officials, land
managers, petroleum companies, and land owners.
Within the oil and gas production industry there is an
increased focus on the discharge of produced waters
to the environment. That there is no universally
agreed standard for oil-in-water discharge quality is
partly an indication of the different capacities of
receiving waters to absorb the pollutants. It is,
however, compounded by a lack of any universally
agreed methods even on how to measure oil-in-water,
which in extreme cases leads to varying results by
orders of magnitude according to the actual methods
used.
Treating produced water properly before disposal
ensures elimination of the harms done to the
environment by the oil and gas industry. This study
indicates that produced water effluent discharged into
the Ugborodo river can be treated further to improve
on the recommended permissible limits and continued
monitoring and supervision by the regulatory
authorities cannot be over emphasized.
Conclusion
The evaluation of produced water effluent discharged
into the Ugborodo River, Escravos indicates that
Some of the physicochemical properties and heavy
metals analyzed such as pH, temperature, total
suspended solids (TSS) and biochemical oxygen
demand (BOD) other physicochemical properties
such as salinity, turbidity, total dissolved solids
(TDS), chemical oxygen demand (COD) and total
hydrocarbon content (THC) whose values were
slightly higher than the permissible limits are
recommended for further treatment and management
before being discharged to meet regulatory
requirement or standard by the Department of
10. International Journal of Trend in Scientific Research and Development @ www.ijtsrd.com eISSN: 2456-6470
@ IJTSRD | Unique Paper ID – IJTSRD47758 | Volume – 6 | Issue – 1 | Nov-Dec 2021 Page 188
Petroleum Resources (DPR) in the protection of the
ecosystem and the environment in general.
Recommendations
The regulatory agencies should adopt strict
compliance measures by routine monitoring and
supervision of samples of produced water effluent to
be discharged and treatment facilities used for
produced water treatment and further treatment of the
produced water should meet regulatory standards as
recommended before discharging to the environment.
REFERENCES
[1] Abam, T. K. S., Gobo, A. E & Opuaji, T.
(2004). Spatial and Temporal Patterns of
Coastal Erosion in the Niger Delta. Global
Journal of Geological Sciences, Vol 2, N0. 1,
2004: 79-90. ISSN 1596 - 6798
[2] Adaobi, S. N. & Omowumi, O. I. (2016).
Produced Water Treatment Methods and
Regulations: Lessons from the Gulf of Mexico
and North Sea for Nigeria. Americam Journal
of Engineering Research, Volume – 5, Issue –
12, pp – 46 - 57
[3] AGA, (1991). Gas Facts 1986, A Statistical
Record of the Gas Utility Industry, American
Gas Association, Department of Statistics,
Arlington, VA. Federal Register, 56, 106-174,
[4] Alonzo, W. L., Miller, J. A., Miller, D. L. &
Hayes, T. D. (1995). “Regional Assessment of
Produced Water Treatment and Disposal
Practices and Research Needs, ” paper SPE
029729 presented at the 1995 SPE/EPA
Exploration & Production Environmental
Conference, Houston, 27-29 March.
[5] American Public Health Association (APHA)
(2017). Standard Methods for the Examination
of water and wastewater (APHA), 23rd
Edition.
[6] American Standard Testing and Materials
(ASTM) (2016). Water and Environmental
Technology, Section 11.
[7] Arukwe, A, Celius, T., Walther, B. T. &
Goksoyr, A. (2000). Effects of xenoestrogen
treatment on zonaradiata protein and
vitellogenin expression in Atlantis salmon
(Salmosalar). Aquatic Toxicology, 49, 159 –
140.
[8] Arukwe, A., Kullman, S. W. & Hinton, D. E.
(2001). Differential Biomarker gene and
protein expression in nonylphenol and
estradiol-17 beta treated juvenile rainbow trout
(Oncorhynchusmykiss). Comparasim of
Biochemistry, Physiology C-Toxicology and
Pharmacology, 129, 1 – 10.
[9] Atlas, R. (2002). Purification of Brackish
Waste Water Using Electronic Water
Purification, presented at the 2002 Ground
Water Protection Council Produced Water
Conference, Colorado Springs, CO, Oct. 16-17.
(Paper available at
http://www.gwpc.org/Meetings/PW2002/Paper
s-Abstracts.htm.)
[10] Azetsu-Scott, K. & Passow, U. (2006).
Ascending marine particles: significance of
transparent exopolymer (TEP) in the upper
ocean. Limnol Oceanoger, 49(3), 741 – 748
[11] Azetsu-Scott, K., Yeats, P. & Wohlgeschaffen,
G. (2007). Precipitation of heavy metals in
produced water: Influence on contaminant
transport and toxicity, Marine Environmental
Research, 63, 146 - 167.
[12] Carls, M. G., Holland, L., Larsen, M., Colliar,
T. K., Scholz, N. L. & Incardonna, J. P. (2008).
Fish embryos are damaged by dissolved PAHs,
not oil particles. Aquatic Toxicology, 88, 121 –
127.
[13] Clark, C. E. &Veil, J. A. (2009). Produced
Water Volumes and Management Practices in
the United States. ANL/EVS/R-09/1. US
Department of Energy, Office of Fossil Energy,
National Energy Technology Laboratory,
Argonne, IL, 60 pp. Available at
http://www.evs.anl.gov/pub/doc/ANL_EVS__R
09_produced_water_volume_report_2437.pdf
(accessed November 11, 2012).
[14] Cline, J. T. (1998). Treatment and discharge of
produced water for deep offshore disposal. In:
API Produced Water Management Technical
Forum and Exhibition, Lafayette, LA.
[15] EGASPIN, 2018, (Environmental Guidelines
and Standards for Petroleum Industry in
Nigeria, 2018).
[16] EPA/601/R-14/003. 9. U. S. EPA. (2016).
Hydraulic Fracturing for Oil and Gas: Impacts
from the Hydraulic Fracturing Water.
[17] Erakhrumen, A. A, Areghan, S. E, Ogunleye,
M. B, Larinde, S. L, & Odeyale, O. O (2015).
Journal of Applied Sciences and Environmental
Management 19 (1), 21 – 27, 2015
[18] Etakhrumen A. A. (2015) Concentration of
heavy metals in untreated produced water from
crude oil production platforms in Niger Delta,
Nigeria. J. Res For Wild Environ 7 (1): 89 –
11. International Journal of Trend in Scientific Research and Development @ www.ijtsrd.com eISSN: 2456-6470
@ IJTSRD | Unique Paper ID – IJTSRD47758 | Volume – 6 | Issue – 1 | Nov-Dec 2021 Page 189
10Igwe JC, Ukaogo PO (2015) Environmental
effects of polycylic aromatic hydrocarbons. J
Nat Sci Res 5 (7): 117 – 131.
[19] Evans, P. & Robinson, K. (1999). Produced
Water Management-Reservoir and Facilities
Engineering Aspects, paper SPE 53254
presented at the 1999 SPE Middle East Oil
Show, Bahrain, 20-23 February.
[20] Fakhru'l-Razi, A., Pendashteh, A. & Abdullah
L. C. (2009). Review of technologies for oil
and gas produced water treatment. Journal of
Hazard Mater, 170, 530 - 551.
[21] Flemming, A. C. & Trevors, J. T. (1989).
Copper toxicity and chemistry in the
environment – a review. Water Air Soil
Pollution, 44, 143 – 158.
[22] Godec, T. S., Bundhrig, K. & Smith, G. E.
(1994). Economic Impacts of Alternative
Produced Water Treatment and Disposal
Practices on Oil and Gas Resources in the Gulf
of Mexico. Offshore Technology Conference
Paper 7404, 2-5 May 1994.
[23] Hayes, T. & Arthur, D. (2004). Overview of
emerging produced water treatment
technologies. Free Radical and Biological
Medicine, 8(4), 3101 – 3109.
[24] Hayes, T. (2009). Sampling and Analysis of
Water Streams Associated with the
Development of Marcellus Shale Gas. Final
report to the Marcellus Shale Coalition. Gas
Technology Institute, Des Plaines, IL, 249 pp.
Available at http://eidmarcellus.org/wp-
content/uploads/2012/11/MSCommission-
Report.pdf (accessed November 11, 2012).
[25] Igunnu, E. T. & Chen, G. Z. (2014). Produced
water treatment technologies". Int. J. Low-
Carbon Technol. Oxford University Press. (9):
157.
[26] Isehunwa S. O. & Onovae S. (2011).
Evaluation of Produced Water discharge in the
Niger Delta. Asian Research Publishing
Network (ARPN). Journal of Engineering and
Applied Sciences, 6 (8), 66-72.
[27] Jacobs, R. P. W. M., R. O. H. Grant, J. Kwant,
J. M. Marqueine, and E. Mentzer, 1992, The
Composition of Produced Water from Shell
Operated Oil and Gas Production in the North
Sea, Produced Water, J. P. Ray and F. R.
Englehart (eds. ), Plenum Press, New York.
[28] Jun, W., X., Liu, B., Bai, Y. & Liang, S.
(2003). Reinjection of Finely Disposed
Produced-water Reduces Formation Damage in
Low Permeability Zones, paper SPE 82234
presented at the 2003 SPE European Formation
Damage Conference, The Hague, 13-14 May.
[29] Lin, M. H., Lee, C. H., Lin, Y. C. & Yang, K.
H. (2011). Potentially toxic trace elements
accumulating in marine sediments and bivalves
in the outfall area of desalination plant. Desal
Water Treatment, 25, 106 – 112.
[30] MacDonald, D. D., Carr, R. S., Calder, F. D.,
Long, E. R. & Ingersoll, G. G. (1996).
Development and evaluation sediment quality
guidelines for Florida coastal waters.
Ecotoxicology, 5, 253 – 278.
[31] Mackay, E. J., Collins, I. R., Jordan, M. M. &
Feasey, N. (2003). “PWRI: Scale Formation
Risk Assessment and Management, ” paper
SPE 80385 presented at the 2003 SPE
International Symposium on Oilfield Scale,
Aberdeen, UK, 29-30 January.
[32] Miao, A. J., Wang, W. S. & Juneau, P. (2005).
Comparison Cd, Cu and Zn toxic effects on
four marine phytoplankton by pulse-amplitude-
modulated-fluorometry. Environmental
Toxicology and Chemistry, 24, 2603 – 2611.
[33] Morrisey, D. J., Underwood, A. J. & Howill, L.
(1996). Effects of Copper on the faunas of
marine soft sediments: An experimental field
study. Marine Biology, 125, 199 – 213.
[34] Neff, J. M. (2011). Bioaccumulation in marine
organisms: effects of contaminants from oil
well produced water. Istedn. Elsevier. London.
p 468.
[35] Nigeria. J Res For Wildl Environ 7(1):89–10
[36] Nwosi-Anele, A. S. (2016). Economic
implication of produced water treatment
methods (with due consideration of discharge
regulatory specification). Masters dissertation,
University of Port Harcourt.
[37] Oboh, I., Aluyor, E. & Audu, T. (2009). Post
treatment of produced water before discharge
using Lorffa Cylindrical Learndo. Electronic
Journal of Practices and Technology, 14, 57-
64.
[38] OGP (International Association of Oil and Gas
Producers) (2004). Environmental Performance
in the E&P Industry. 2003 Data. Report No.
359. OGP, London, UK, 32 pp.
[39] Okoro, C. C. (2010). Microbiological impacts
of produce water discharges in Nearshore
12. International Journal of Trend in Scientific Research and Development @ www.ijtsrd.com eISSN: 2456-6470
@ IJTSRD | Unique Paper ID – IJTSRD47758 | Volume – 6 | Issue – 1 | Nov-Dec 2021 Page 190
shallow marine waters near Chevron's Escravos
tank farm, Nigeria. American Journal of
Science, 6 (3), 93 - 101.
[40] Olawuyi, D. (2015). Principles of Nigerian
Environmental Law, Afe Babalola University
Press.
[41] Ray, J. P. & Rainer, E. F. (1992). Produced
water: Technological/environmental issues and
solutions. Environmental Science Research, 46,
1 – 5.
[42] Reynolds, R. R. (2003). Produced Water and
Associated Issues: A Manual for the
Independent Operator, vol. Vol. 6 Oklahoma
Geological Survey Open-file Report (pg. 1-56).
[43] Stephenson, M. T. (1992). A survey of
produced water studies in: Ray JP. Engelhardt
FR (eds) Produced water:
Technological/environmental issues and
solutions. Plenum Publishing Corp., New York
[44] Stohs, S. & Bagchi, D. (1995). Oxidative
mechanisms in the toxicity of metals-ions. Free
Radical and Biological Medicine, 18, 321 –
336.
[45] Sturve, J., Hasselberg, L., Falth, H., Celander,
M. & Forlin, L, (2006). Effects of North Sea oil
and Alkyphenols on biomarker responses in
juvenile Atlantic cod (Gadusmorhua). Aquatic
Toxicology, 78, 73 – 78.
[46] Tibbetts, B. & Gawel, L. R, (1992). A
Comprehensive Determination of Produced
Water Composition, in Produced Water, J. P.
Ray & F. R. Englehart (eds. ), Plenum Press,
New York.
[47] U. S. DOE. (2018). United States Energy
Information Administration (EIA). Annual
Energy Outlook 2018. United States
Department of Energy.
[48] U. S. EPA. (2015). Analysis of Hydraulic
Fracturing Fluid Data from the FracFocus
Chemical Disclosure Registry
[49] Ukpohor, T. O. (2001). Produced Water:
Environmental Issues/ Technological solution
of the Nigeria depletion Era. SPE conference
paper 71437, 30 September -3 October, 2001.