
Recommended
Recommended
More Related Content
What's hot
What's hot (20)
Similar to Biochemical Analysis of a Leguminous Crop Cajanus Cajan L. with an Insecticide TAFGOR
Similar to Biochemical Analysis of a Leguminous Crop Cajanus Cajan L. with an Insecticide TAFGOR (20)
More from ijtsrd
More from ijtsrd (20)
Recently uploaded
Recently uploaded (20)
Biochemical Analysis of a Leguminous Crop Cajanus Cajan L. with an Insecticide TAFGOR
- 1. International Journal of Trend in Scientific Research and Development (IJTSRD) Volume 4 Issue 3, April 2020 Available Online: www.ijtsrd.com e-ISSN: 2456 – 6470 @ IJTSRD | Unique Paper ID – IJTSRD30555 | Volume – 4 | Issue – 3 | March-April 2020 Page 571 Biochemical Analysis of a Leguminous Crop (Cajanus Cajan L.) with an Insecticide (TAFGOR) Dr. Rasmita Padhy, Ashutosh Panigrahy, Ankita Mohapatra P.G. Department of Botany and Biotechnology, Khallikote Autonomous College, Berhampur, Odisha, India ABSTRACT The article takes into an account of the extraction of different types of biochemical analysis of Pigeon pea with an insecticide(Tafgor)ina laboratory condition. Pigeon pea is a perennial tropical legume grown mainly in India. It belongs to the family Fabaceae. More than any other legumes adapted to the region, Pigeon pea uniquely combines optimal nutritional profiles and high tolerance to environmental stresses, high biomass productivity. Environmental stresses play a crucial role in the productivity, survival and reproductive biology of plants and crops. They result in diminish and loss of crop production. Dimethoate is a widely used organophosphateandacaricide. TAFGOR insecticide (Dimethoate), used as a test chemical, was guaranteed at reagent from Rallis limited, India. First stock solution was prepared by dissolving 1g. of test chemical in 1L of distilled water. we have chosen only 8 concentrations (control,50,100,200,400,600,800,1000) for biochemical analysis. This experiment is done under laboratory conditionswithsowing10 seeds in 8 germination bowls which contain 200 gm. of soil and sand (3:1). The following day, after the exposure of seeds to light, there is rapid elongation of radicle and plumule. The percentage of amino acid content in root and shoot increases at 200 PPM and then decreases at 1000 PPM. The percentage of sugar in root and shoot increases at 400 PPM but decreases at 1000 PPM is 204.70%.and 51.71%. The percentage of protein of shoot is at 400 PPM increases but at 1000 PPM it decreases up to 56.81%. Similarly, in root the percentage of protein decreases at 200 PPM and at 1000 PPM it is 52.94%. At 200 PPM and 1000 PPM the percentage of DNA are 822.99% and 461.38% respectively. Similarly, in root, the percentage of DNA at 200 PPM is 373.42% and at 1000 PPM, it is 209.35%. Due to positive effect, at first it increases to the 200 PPM and after that it decreases due to more toxic effect. At 200 PPM and 1000 PPM the percentage of RNA are 117.01% and 96.35% respectively. Similarly, in root the percentage of RNA is 121.25% and at 1000 PPM it is 82.72%. Due to positive toxicity at first it increases to the 200 PPM and after that it decreases due to more toxic effect. The percentage of the biochemical contents increases from control to 200 or 400 PPM and then the percentage becomes lesser due to more toxic effect. KEYWORDS: BIOCHEMICAL PARAMETERS, INSECTICIDE, Cajanus cajan L., TAFGOR How to cite this paper:Dr.Rasmita Padhy | Ashutosh Panigrahy | Ankita Mohapatra "Biochemical Analysis of a Leguminous Crop (Cajanus Cajan L.) with an Insecticide (TAFGOR)" Published in International Journal of Trend in Scientific Research and Development(ijtsrd), ISSN: 2456-6470, Volume-4 | Issue-3, April 2020, pp.571- 575, URL: www.ijtsrd.com/papers/ijtsrd30555.pdf Copyright © 2020 by author(s) and International Journal ofTrendinScientific Research and Development Journal. This is an Open Access article distributed under the terms of the Creative CommonsAttribution License (CC BY 4.0) (http://creativecommons.org/licenses/by /4.0) INTRODUCTION Pigeon pea is a perennial tropical legume grown mainly in India. It has a huge untapped potential for improvement both in quality and quantity of production in Africa. More than any other legume adapted to the region, Pigeon pea uniquely combines optimal nutritional profiles and high tolerance to environmental stresses, high biomass productivity Plants do not have many response options to stress, but they response in general with eithera highlighted type or a lowlighted type ofgrowthandadaptation response. (Lichtenthaler, 1984) Pesticides or agro-chemicals are chemicals designed to combat the attacks of various pestsin agricultural and horticultural pests. Insecticides are an invaluable tool and anthropogenic stressor widespread environmental occurrence that are subjected to biased perception based on the targeted applications, marketvalue of use and regulatory requirements. Among different insecticides, the organochlorine (OC) insecticides, used successfully in controlling a number of diseases. The introduction of other insecticides- organophosphate(OP) in the 1960s, carbamates in 1970s, pyrethoids in 1980s contributed greatly to pest control and agricultural output. Dimethoate is a widely used organophosphateandacaricide. TAFGOR (30% EC of Dimethoate) is an Acetylcholine esterase inhibitor and also can be used to show the toxic effect on some legume crops like pigeon pea. It is highly effective in controlling and sucking the pests. It is highly compatible with other insecticides and fungicides. KEYWORDS MATERIALS AND METHODS:- 1. SELECTION OF PULSE CULTIVARS: Cajanus cajan L. is a common pulse crop in Odisha and is widely cultivated. The seeds of pigeon pea (Cajanuscajan L.) of variety-Manak, were procured from the Pulse Research IJTSRD30555
- 2. International Journal of Trend in Scientific Research and Development (IJTSRD) @ www.ijtsrd.com eISSN: 2456-6470 @ IJTSRD | Unique Paper ID – IJTSRD30555 | Volume – 4 | Issue – 3 | March-April 2020 Page 572 Institute (CPRI) Ratanpur, Berhampur. The seeds with uniform size, colour and weight were chosen for experimental purpose. CajanuscajanL.isa perennial legume of family Fabaceae and a short duration variety. It is grown during June to July and harvested in the month of October to November. 2. TEST CHEMICAL: TAFGOR insecticide (Dimethoate) used as a test chemical, was guaranteed at reagent from Rallis limited, India. First stock solution was prepared by dissolving 1g. of test chemical in 1L of distilled water. There are 21 concentrations of stress (10,20,30…………100,200,300,400,500,600,700,800,900,100 0 PPM and control) are done but we have chosen only 8 concentrations (control,50,100,200,400,600,800,1000) for biochemical analysis. 3. GERMINATION STUDIES: The bowls were incubated in the dark at room temp (32⁰C) and then kept under the light bulb. The emergence of radicle or plumule was considered as an index of germination. 4. BIOCHEMICAL STUDIES: The root and shoot proportions of the 10 days old seedlings were separated, weighed and analysed for various biochemical components. A. Estimation of Protein: 100mg of fresh shoot & rootwere taken & ground in 80% acetone (vol/vol) by a mortar and pestle. Then the extracts were taken in centrifuge tubes & centrifuged for 10 minutes. The residues were taken & 80% of acetone added, stirred & centrifuged again. The supernatants were rejected & the residues were collected. These collected residues were added 4.5ml of 2N NaOH & kept in 4˚C over night. The suspension wastaken& boiled20 minutes in a water bath & cooled. Then centrifuged for 15 minutes & supernatant were collected. Then 0.5 ml of supernatant,2.5ml alkaline reagent & 0.5ml of 0.1% Folin Phenol Reagent were added & absorbance were recorded at 620nm against a blank. Bovine Serum Albumin (BSA) was used as the reference standard. The concentrationof protein was expressed in mg/ gm (fresh weight) & calculated from the standard curve prepared. Protein = (y = O.D at 620 nm) B. Estimation of Amino Acid: The amino acid content was determined by Ninhydrin method of Moore & Stein (1948). Glycine was used as amino acid in the preparation of standard curve. The concentration of amino acid was expressed in mg/gm fresh weight of tissue after the calculation from standard curve. First 100mg of fresh root & shoot were taken, ground in 70% alcohol (vol/vol) & the extract was subjected to centrifugation for 10 minutes. The supernatant was collected carefully. The residues were added with 70% alcohol, stirred & centrifuged. The supernatant was collected & mixed with the previously collected supernatants & the volume was made up to 10ml. the supernatant was allowed to evaporate to its half. The volume was made up to 10ml with 70%alcohol.Then1ml. of aqueous solution was taken &3ml.of0.3%Ninhydrinadded, boiled in water bath for 20 minutes & then cooled. Absorbance was recorded at 620nm against the blank. The value was calculated by using the formula: - Amino acid = (y = O.D at 620 nm) C. Estimation of Soluble Sugar:- The sugar content was measured by adding Anthrone reagent (Yoshida et al.,1972). A standard curve was prepared by taking D- glucose. The concentrationofsugarwasexpressedinmg/gm of fresh weight. First 100mg of plant material was taken & grounded in 70% ethanol(vol/vol) & the extract were subjected to centrifugation for 10 minutes. The supernatant were collected & the residues were added with 70% alcohol & recentrifuged. The supernatant was collected & mixed with previously collected supernatants & allowed to evaporate till the volume were about0.5ml.volume made up to 10ml. Then 2.5ml of Anthrone reagent was added to the 0.5 ml of aqueous solution & boiled for 10 minutes in water bath. Absorbance were noted at 620nm after the solution were cooled against a blank. The value was calculated by using the formula Sugar = (y = O.D at 620 nm) D. Estimation of Nucleic Acid:- First 100mg of root & shoot were taken & ground in 70% ethanol (vol/vol) & the extract were subjected to centrifugation for 10 minutes. The supernatant was rejected. Then the residues were added with alcohol & centrifuged again. The sediment was taken & 1ml. of 5% TCA (vol/vol) added which is freshly prepared & stored in 4˚C over night. The suspension was centrifuged & the supernatant was rejected. 5ml of 10% TCA was added to the residue & boiled for 20 minutes in a water bath. The suspension was cooled down & centrifuged. The sediment was rejected & the supernatant was collected for DNA & RNA. Estimation of RNA:- RNA content was measured following the method of Schneider (1957). The concentration of RNA was expressed in mg/gm fresh weight being calculatedfrom the standard curve made from commercial RNA. To 1ml. of the supernatant, 3ml. of Orcinol reagent was added & boiled in a water bath for 20minutes. Absorbance were recorded at 620nm after being cooledagainstblank.Thevaluecalculated by using the formula: RNA = (y = O.D at 620 nm) E. Estimation of DNA: The DNA content was estimated by adding Diphenyl amine reagent (DPR) following the method of Schneider (1957). The concentration of DNA was expressed in mg/gm fresh weight. Amount of DNA was calculated from the standard curve prepared from calf thymus DNA. To 1 ml of the supernatant ml 3 ml of Diphenyl reagent was added & boiled in a water bath for 20 minutes. The absorbance was taken & were recorded at 620 nm against blank after being cooled. Thevaluewascalculatedby using the formula: DNA = (y = O.D at 620 nm)
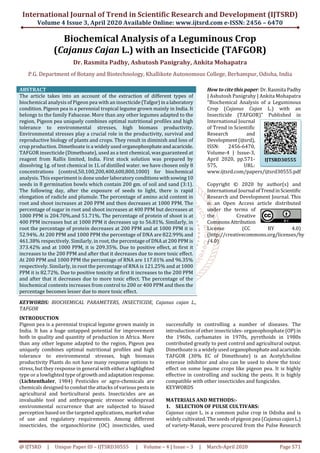
- 3. International Journal of Trend in Scientific Research and Development (IJTSRD) @ www.ijtsrd.com eISSN: 2456-6470 @ IJTSRD | Unique Paper ID – IJTSRD30555 | Volume – 4 | Issue – 3 | March-April 2020 Page 573 TABULATION:- Table-1: Effect of different concentrations of insecticide (in PPM) on DNA, RNA, protein, amino acid, and sugar (Shoot) of Cajanus cajan L. seedling of 9 days old and percentage change with the control. Figures in parenthesis show the % change (+/-) from the control value. Biochemical Analysis Of Shoot Concentration (in PPM) % of DNA % of RNA % of protein %of Amino acid % of sugar 0 (control) 100 100 100 100 100 50 341 95.13 127 112.9 115.1 100 566.3 106.9 129 121 246.5 200 823 117 163.6 140.3 282.5 400 702.4 113.4 152 130.6 276.5 600 631.7 106.1 131.8 100 258.6 800 582 98.78 122.7 98.39 237.5 1000 461.4 96.35 56.81 96.77 204.7 Graph-1: Clustered column chart showing the percentage of change in DNA, RNA, protein, amino acid, and sugar (Shoot) of Cajanus cajan L. seed treated with different concentrations of insecticide (in PPM) of 9 days old seedling. Table-2: Effect of different concentrations of insecticide (in PPM) on DNA, RNA, protein, amino acid, and sugar (Root) of Cajanus cajan L. seedling of 9 days old and percentage change with the control. Figures in parenthesis show the % change (+/-) from the control value. Biochemical Analysis Of Root Concentration (in PPM) % of DNA % of RNA % of protein % of Amino acid % of sugar 0 (control) 100 100 100 100 100 50 154.7 104.5 120.6 294.3 120 100 264 112 138.1 537.7 166.3 200 373.4 121.3 124.5 465.9 153.3 400 323.1 118.6 105.2 423.8 133.7 600 264.1 101.3 67.64 405.3 100 800 234.1 85.32 60.29 385.8 67.31 1000 209.4 82.72 52.94 373.9 51.71 Graph-2: Clustered column chart showing the percentage of change in DNA, RNA, protein, amino acid, and sugar (Root) of Cajanus cajan L. seed treated with different concentrations of insecticide (in PPM) of 9 days old seedling.
- 4. International Journal of Trend in Scientific Research and Development (IJTSRD) @ www.ijtsrd.com eISSN: 2456-6470 @ IJTSRD | Unique Paper ID – IJTSRD30555 | Volume – 4 | Issue – 3 | March-April 2020 Page 574 RESULT:- This experiment is done under laboratory conditions with sowing 10 seeds in 21 germination bowls whichcontain 200 gm. of soil and sand (3:1). The radicle is emerged after 48 hours incubation in a dark room at room temperature. The emergence of radicle and plumule is considered as the index of germination. The seedlings are then exposed to light after germination. The following day, after the exposure of seeds to light, there is rapid elongation of radicle and plumule. By the end of 72 hours, most of the seeds show radicle emergence. Further, there is rapid elongation of the primary root and shoots split from coleoptiles and emerged as primary leaf. On 9th day, it is observed that 100% germination in control. So, we observedthegerminationand leaf emergence of seeds which are shown in different concentrations of TAFGOR, then we measured the length of shoot and root. It is observed with both the fresh weight of root and shoot and dry weight of root and shoot (by keeping in Oven for 15 minutes). On 10th day, in Cajanus cajan L. seedlings grow at 0,50,100, 200, 400, 600, 800 and 1000 PPM TAFGOR treatment, we have done the biochemical analysis. The percentage of amino acidcontentinrootat200 PPM is 465.93% and at 1000 PPM the percentage is 373.94%. in shoot the percentage of amino acid at 200 PPM is 140.33% and at 1000 PPM it is 96.77%. The percentage of sugar at 400 PPM is 276.45%. The percentage of sugar at 1000 PPM is 204.70%. Similarly, in root, at 400 PPM the percentage is 133.65% and at 1000 PPM it is 51.71%. In shoot, at 400 PPM the percentage of protein is 152%. At 1000 PPM the percentage of protein is 56.81%. Similarly, in root the percentage of protein at 200 PPM is 124.45% and at 1000 PPM it is 52.94%. At 200 PPM and 1000 PPM the percentage of DNA are 822.99% and 461.38% respectively. Similarly, in root, the percentage of DNA at 200 PPM is 373.42% and at 1000 PPM, it is 209.35%. Due to positive effect, at first it increases to the 200PPMand after that it decreases due to more toxic effect. At 200 PPM and 1000 PPM the percentage of RNA are 117.01% and 96.35% respectively.Similarly,inrootthepercentageofRNA is 121.25% and at 1000 PPM it is 82.72%. Due to positive toxicity at first it increases to the 200 PPM and after that it decreases due to more toxic effect. DISCUSSION:- Better seed quality parameters were noticed in insecticidal spraying at before 10 days of harvest stage which may be attributed to the increase in less percentageofinfestedpods. Such beneficial effects of repeated spraying at different stages of crop growth period on seed quality parameters were also confirmed by Gidaganti et al. (1998) in cowpea, Patrick et al. (1998). As compared to other treatments, the next best treatment was Spinosad (31.25%). Where as in control, pod was significantlyhigh(48.7%)infested,thismay be related to its broad-spectrum nature, higher photostability compared to other insecticides tried in the present study These results confirmed the usefulness of spraying of insecticides at different stages of crop growth period by showing marked decrease in percentage of infested pods pigeon pea. The similar positive effect of insecticidal sprayings on seed attributes in different field crops were also reported by Ramujagir (1999), Akhilesh kumar and Parasnath (2004) and Siddegowda et al. (2004) in pigeon pea, Ramujagir and Chaudhary (1997) and Manzoor et al. (2002) in green gram. Likewise, seed quality parameters also differed significantly due to insecticides. Decrease in protein may be attributed to seed deterioration and rise in free amino acid level due to ageing. These results are similar to the findings of Kalpana and Madhav Rao (1996) in pigeon pea, Roberts (1979) in ground nut and Halder and Gupta (1980) in sunflower. SUMMARY AND CONCLUSION:- From the above experiment it is concluded that the percentage of amino acid content inrootandshootincreases at 200 PPM and then decreasesat1000PPM.Thepercentage of sugar in root and shoot increases at 400 PPM but decreases at 1000 PPM is 204.70%.and 51.71%. The percentage of protein of shoot is at 400 PPM increasesbutat 1000 PPM it decreases up to 56.81%. Similarly, in root the percentage of protein decreases at 200 PPM and at 1000 PPM it is 52.94%. At 200 PPM and 1000 PPM the percentage of DNA are 822.99% and 461.38% respectively. Similarly, in root, the percentage of DNA at 200 PPM is 373.42% and at 1000 PPM, it is 209.35%. Due to positive effect, at first it increases to the 200 PPM and after that it decreases due to more toxic effect. At 200 PPM and 1000 PPM the percentage of RNA are 117.01% and 96.35% respectively. Similarly, in root the percentage of RNA is 121.25% and at 1000 PPMit is 82.72%. Due to positive toxicity at first it increases to the 200 PPM and after that it decreases due to more toxic effect. The percentage of the biochemical contents increases from control to 200 or 400 PPM and then the percentagebecomes lesser due to more toxic effect. Acknowledgement: Regional Rice Institute, Ratnapur for supply of pure seeds. REFERENCES:- [1] Akhileshkumar and Parasnath, 2004, Effect of insecticides against pod borer and pod fly grain weight and seed quality in pigeon pea. Indian J. Ent., 66(3): 228- 230. [2] Gidaganti et al., Alghali, 1998, Effect of pre- harvest spraying of some pesticides on quality of cowpea seed. Seed research, 23: 102-107 [3] Gupta, I. I., Schmitthenner, A. E. and Mc. Donald, M. B., 1993, Effect of storage fungi on seed of soybean. Seed Sci. and technol., 21.581-591. [4] Kalpana, R., Madhav Rao, K.V.,1994, Absence of the role of lipid peroxidation in the accelerated ageing of seeds of pigeon pea (Cajanus cajan L. Mill sp.) cultivars. Seed Sci. Technol. 22: 253-260. [5] Lichtenthaler, H. K. and Meier, D., 1984, Regulation of chloroplast photo morphogenesis bylightintensityand light quality. In chloroplast biogenesis, Ellis, H., Ed., Cambridge University press, Cambridge, U.K. 261-281. [6] Mittal, V. and Ujagir, R., 2005, Evaluation of naturally spinosad againstpodborercomplexinearlypigeonpea. Indian J. Pl. Protc., 33: 211-215. [7] Patrick, J., Palanysamy, V. and Vakeswaran, V., 1998, Influence of pre-harvest sprays on seed yield and quality of pea. (Pisum sativum L.). Seed Tech News, 28(4): 8. [8] Roberts, B.E, Osborn, D.J., 1973, Protein synthesis and viability in rye grains. In seed ecology Heydecker, W., Butterworth, London. 99-114.
- 5. International Journal of Trend in Scientific Research and Development (IJTSRD) @ www.ijtsrd.com eISSN: 2456-6470 @ IJTSRD | Unique Paper ID – IJTSRD30555 | Volume – 4 | Issue – 3 | March-April 2020 Page 575 [9] Roberts, E.H., Ellis, R.H., 1989, Water and seed survival. Ann. Bot. 63: 39-52. [10] Salunkhe, D. K., Deshpande, S. S. and Cornforth, D.P., 1982 Effect of dehullingonphyticacid,polyphenolsand enzyme inhibitors of dry beans (Phaseolus vulgaris). Journal of Food Science. 47:1846. [11] Saxena, O.P. and Maheswari, D.C., 1980, Biochemical aspects of viability in soybean. Acta Bot. Indica, 8: 229- 234. [12] Selye, H., Stress of my life: A Scientist’s Memoirs. New York: Van Nostrand Reinhold Company; 1979.