
Recommended
Recommended
More Related Content
Similar to Analysis of Soybean Meal Price Discovery Function in China
Similar to Analysis of Soybean Meal Price Discovery Function in China (20)
More from ijtsrd
More from ijtsrd (20)
Recently uploaded
Recently uploaded (20)
Analysis of Soybean Meal Price Discovery Function in China
- 1. International Journal of Trend in Scientific Research and Development (IJTSRD) Volume 5 Issue 6, September-October 2021 Available Online: www.ijtsrd.com e-ISSN: 2456 – 6470 @ IJTSRD | Unique Paper ID – IJTSRD47601 | Volume – 5 | Issue – 6 | Sep-Oct 2021 Page 1251 Analysis of Soybean Meal Price Discovery Function in China Zhang Jiayu1 , Zhang Yuan2 1 Postgraduate Student, Majored in Securities and Futures, 2 Postgraduate Student, Majored in Political Economy, 1,2 School of Economics, Beijing Wuzi University, Beijing, China ABSTRACT Soybean meal, as the largest and most active agricultural product futures in China, involves a wide range of industries and a wide range of industries. After the Sino-US trade friction, the raw material cost of soybean meal has risen, and the price fluctuates greatly. It is important to explore the impact of trade friction on the price discovery function of China's soybean meal futures, which will improve the efficiency of China's soybean meal futures market and promote it to better serve the real economy. significance. This article compares the discovery function of soybean meal futures market before and after the Sino-US trade friction, and analyzes the reasons for the difference. Co-integration test, causality test, variance decomposition, and PT-IS model are used to analyze the soybean meal futures and spot prices from 2014 to 2020. The empirical results show that, in general, the soybean meal futures market plays a leading role in the price discovery process, but trade The price discovery function in the period after the friction occurs is relatively weaker than in the previous period. Finally, specific suggestions are put forward in terms of improving the structure of market participants and the information disclosure system. Keywords: soybean meal futures; price discovery function; trade friction; common factor model How to cite this paper: Zhang Jiayu | Zhang Yuan "Analysis of Soybean Meal Price Discovery Function in China" Published in International Journal of Trend in Scientific Research and Development (ijtsrd), ISSN: 2456- 6470, Volume-5 | Issue-6, October 2021, pp.1251-1258, URL: www.ijtsrd.com/papers/ijtsrd47601.pdf Copyright © 2021 by author (s) and International Journal of Trend in Scientific Research and Development Journal. This is an Open Access article distributed under the terms of the Creative Commons Attribution License (CC BY 4.0) (http://creativecommons.org/licenses/by/4.0) INTRODUCTION Since the soybean meal futures were listed in July 2000, the trading volume has continued to expand, and it has become one of the most active and largest agricultural product futures varieties in China's futures market. According to data from DCE, the turnover of soybean meal futures in 2020 reached 10.6 trillion yuan, a year-on-year increase of 39.69%. Soybean meal is the largest and most widely used in oil meal feed. In 2020, the global soybean meal output will be 246.05 million tons, and China accounts for more than 29% of the global soybean meal output. Soybean meal, the raw material of soybean meal, is heavily dependent on foreign imports. Since 2018, Sino-US trade frictions have continued to ferment. In response to the US trade offensive, China has imposed tariffs on US exports to China. Soybean, the raw material of soybean meal, has become a key product of tariff control. The impact of this policy has caused China's soybean imports and imports from the United States to decline rapidly, and changes in soybean supply directly affect the changes in soybean meal supply. The expected fluctuations in supply make the soybean meal market price volatility intensified, and investors' demand for hedging continues. Increase. In addition, due to the listing of live hog futures, DCE has initially formed a "soybean-soybean meal-live hog" animal husbandry bulk futures industry chain, which better meets the hedging needs of the upstream and downstream of the industry chain. Therefore, in-depth exploration of the function of soybean meal futures price discovery, especially whether the price discovery function of the soybean meal futures market after the Sino-US trade friction has been effectively performed, will enhance the ability of the soybean meal market to serve the real economy and promote the healthy and orderly industrial chain. The direction of development plays a vital role. 1. Literature review There have been many studies on futures price discovery. Price discovery is one of the important functions of the futures market, that is, the process of authenticity, continuity and authoritative price IJTSRD47601
- 2. International Journal of Trend in Scientific Research and Development @ www.ijtsrd.com eISSN: 2456-6470 @ IJTSRD | Unique Paper ID – IJTSRD47601 | Volume – 5 | Issue – 6 | Sep-Oct 2021 Page 1252 formation in an open, fair and just trading market (Yang Junzhan, 2014). In terms of proving the existence of the price discovery function of the futures market, Kawaller et al. (1987) believed that the existence of the price discovery function can only be proved if the futures market can react faster than the spot market when facing the same market information. Chinese scholar Xie Xiaowen (2016) believes that the sign of the existence of futures price discovery is that the futures price guides the spot price of the same period. In a recent study on the price discovery of China’s agricultural product futures, Zhou Jing et al. (2019) conducted an empirical analysis of the transmission relationship between soybean futures and spot prices, and the results showed that the degree of influence of soybean futures prices on spot prices has gradually increased over time. . Dai Peng et al. (2019) selected soybean meal futures and spot price data from August 2009 to May 2017, and used lag periods of 2, 3, 4, and 5 to perform rolling causality tests using the TY method to obtain the soybean meal futures market price. Find the conclusion that the function gradually becomes stronger over time. Chen Zhiyuan (2020) conducted an empirical study on the price discovery function of China's corn futures, and the results showed that China's corn futures have a strong price discovery function for spot prices. Generally speaking, in the current research on the price discovery function of China's agricultural product futures, the futures market is dominant in the price discovery process, and the futures price guides the spot price strongly. Most of the above-mentioned scholars interpret the essence of the price discovery function as the mutual guiding relationship between the futures market and the spot market, which is manifested as the leading and lagging of the two. Wang Zhen (2013) believes that in addition to studying the above relationship, the ratio of the same information integration period and spot price should also be considered to quantitatively analyze the dominant and subordinate relationship between the futures market and the spot market. For this research direction, the academic community mainly adopts the public factor model. The public factor model contains three models, namely the information share model (IS) proposed by Hasbrouck (1995) and the revised information share model (MIS) proposed by Donald Lien (2009). And the permanent-transient model (PT) proposed by Gonzalo and Granger (1995). The public factor is the public factor of the restriction period and the spot trend due to the existence of arbitrage between the existing and the spot. It divides the futures price and the spot price into two parts, that is, the public factor and the own noise. Both IS model and MIS model measure the contribution ratio of own noise to the variance of common factors. The PT model defines the contribution of price discovery through the measurement period and the contribution of spot prices to public factors. At present, there are not many studies concerning the impact of Sino-US trade friction on the price discovery function of China’s futures market. Liu Chen et al. (2020) found that Sino-US trade friction has increased in a study on the efficiency of the Sino- US corn futures market before and after the trade friction. The ability of China's spot market to guide the futures market reduces the efficiency of price discovery in the futures market. In general, judging from the existing research results, there are more recent literature on the discovery of agricultural product futures prices, but fewer documents related to the discovery of soybean meal futures prices, especially the before and after comparison of the discovery function of soybean meal futures under the background of Sino-US trade frictions. Less analysis. On the other hand, most of the current research on futures price discovery focuses on the mutual guiding relationship between futures and spot prices. This article uses a public factor model to quantitatively analyze the dominant and subordinate relationship between the futures market and the spot market. 2. Analysis of the impact of Sino-US trade friction on the price discovery function of domestic soybean meal futures The efficiency of price discovery in the futures market is reflected in the guiding relationship and dominant subordination relationship between the futures market and the spot market. Soybean meal is a by-product of soybean processing, and its supply is greatly affected by the supply of soybeans. Therefore, soybean meal is also greatly affected by the supply of soybeans. The supply of soybeans mainly comes from two parts, one is domestic soybeans, and the other is imported soybeans. The raw material of soybean meal basically depends on imported soybeans. The world's major soybean exporting countries, the United States and Brazil, export more than 75% of the world's soybeans each year, and in the demand market, China imports more than 70% of the soybeans. According to data from the General Administration of Customs, in 2017, before the trade friction, Brazilian soybeans accounted for 53.3% of total imports, and US soybeans accounted for 34.4%. Therefore, international soybeans are largely determined by the supply and demand of these three countries. After the Sino-US trade friction, China imposed a 25% tariff on
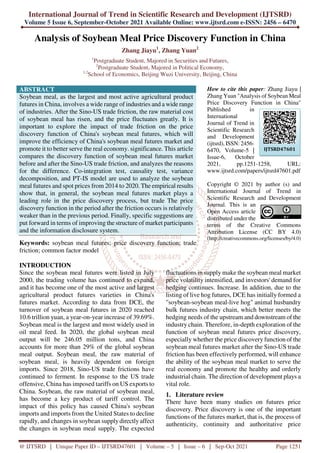
- 3. International Journal of Trend in Scientific Research and Development @ www.ijtsrd.com eISSN: 2456-6470 @ IJTSRD | Unique Paper ID – IJTSRD47601 | Volume – 5 | Issue – 6 | Sep-Oct 2021 Page 1253 US soybeans, which directly caused the increase in US soybean import costs and the decrease in import demand. Affected by this, China's imports of soybeans from the United States have dropped sharply since April 2018, which ultimately led to China's imports of 16.64 million tons of soybeans from the United States in 2018, a year-on-year decrease of 49.4%, accounting for only 18.9% of total imports. This market share is difficult to be digested by soybean producing countries such as Brazil and Argentina in the short term. Therefore, the decrease in soybean supply in the short term will make domestic soybean meal prices stronger. At the same time, the price of soybean futures in the United States began to fall sharply due to the increased tariffs imposed on soybeans, and reached a record low in July 2018. Therefore, under the influence of international market arbitrage, the price of soybean meal futures in China has been dragged down by international prices. The spot price and the basis risk caused by the situation of "currently strong and weak futures" have affected the linkage relationship of the original futures and spot markets, which in turn affects the futures market's price leadership ability. On the other hand, a large number of information shocks after the occurrence of trade frictions will attract a large number of speculators to participate in the soybean meal futures market. According to data from the Dalian Commodity Exchange, the transaction volume of soybean meal futures will increase significantly year-on-year from 2018 to 2020. The average daily position has declined year- on-year for two consecutive years. Among a large number of speculators, irrational traders will ignore the real information and intrinsic value of the market. The herd effect is obvious, which in turn affects the efficiency of market prices in responding to real information, and will eventually weaken the price discovery function of the futures market to a certain extent. 3. Empirical analysis of the impact of Sino-US trade friction on the price discovery function of domestic soybean meal futures 3.1. Data source The data sources of this paper are all Wind database, and the closing prices of active soybean meal futures contracts from October 8, 2014 to November 30, 2020 are selected as the futures prices. For the spot price, the average price of soybean meal spot market prices in 34 regions including Harbin, Siping, Dalian, Shenyang, and Beijing, which are the same period as the futures price, is used as the spot price. Futures and spot prices are matched by date, and 1500 sets of data are obtained, and the first trading day of soybean meal futures in 2018 is January 2 as the demarcation, and the data is divided into two segments before and after. Since the beginning of the Sino-US trade friction in August 2017, it has been escalated step by step until April 4, 2018, with the approval of the State Council to impose 25% tariffs on 106 commodities originating in 14 categories such as soybeans in the United States. Taking into account investor expectations and other factors, this article uses the first trading day of soybean meal futures in 2018 as the demarcation point to compare and analyze the changes in the efficiency of soybean meal futures market price discovery before and after trade frictions. In this article, FP and SP are used to denote futures prices and spot prices, respectively. Use period ( ) to represent the period from October 8, 2014 to December 29, 2017, and period ( ) to represent the period from January 2, 2018 to November 30, 2020. Time period. 3.2. Descriptive statistical analysis The trend of soybean meal futures and spot prices is shown in Figure 1. From October 2014 to April 2016, due to the increase in US soybean production, soybean meal futures(Blue dotted line) and spot prices(Orange solid line) were in a downward period. From April 2016 to June 2016, affected by the speculation of the El Niño weather and the expected increase in soybean production in South America, soybean meal futures rose sharply at the same time as the spot price. Subsequently, from June 2016 to January 2017, domestic soybean meal futures continued to fall under the influence of US soybean futures. However, the spot price of soybean meal remained strong due to the tight domestic supply and increased demand, and the situation of "weak futures but now strong" appeared. By 2017 Spot prices gradually moved closer to futures in June. From August 2018 to December 2019, soybean meal futures and spot prices continued to fluctuate sharply due to the dual impact of the decline in soybean meal imports from the Sino-US trade war on the supply side and the drag on downstream consumption from African swine fever on the demand side. The next stage is from February 2020 to the present. Due to the superimposed effects of the new crown epidemic and Sino-US trade frictions, soybean imports have decreased while terminal market inventories are at a low level, and supply shortages have led to a sharp increase in soybean meal prices. In general, soybean futures and spot prices tend to be synchronized, and most of them are in line with theoretical expectations. The spot price is higher than the futures price, and the price change is always later than the futures price and converges to it, which
- 4. International Journal of Trend in Scientific Research and Development @ www.ijtsrd.com eISSN: 2456-6470 @ IJTSRD | Unique Paper ID – IJTSRD47601 | Volume – 5 | Issue – 6 | Sep-Oct 2021 Page 1254 means that the guiding effect of the futures price on the spot price is confirmed. Figure1 Spot price trend of soybean meal futures Further calculating the correlation coefficients between the futures and spot price series in the two periods (see Table 1), the correlation coefficients for periods(I) and (II) are 0.838 and 0.831, respectively, both of which are greater than 0.8, reflecting the high correlation between soybean meal futures and spot prices. Table 1 Spot correlation analysis (Ⅰ ) SP FP SP 1.000 0.838 FP 0.838 1.00 (Ⅱ ) SP FP SP 1.000 0.831 FP 0.831 1.000 3.3. Analysis of empirical results 3.3.1. Stationarity test. In order to test the cointegration of SP and FP, it is necessary to test the stationarity of the two series. Table 2 shows the ADF test results during periods ( ) and ( ) respectively. DFP and DSP are the first-order difference series of SP and FP respectively. . It can be seen from the table that for the two periods SP,FP~I(1), the corresponding Johansen cointegration test can be developed. Table 2 ADF test results of each variable for the period( ) Variable ADF Statistics 5% Threshold Period( ) Period(Ⅱ ) FP -2.48 -1.91 -2.86 DFP -28.14 -26.11 -2.86 SP -1.92 -1.79 -2.86 DSP -20.48 -19.77 -2.86 3.3.2. Selection of the optimal lag order of the VAR model. The Johansen test is based on the VAR model, and the test results are affected by the lag order. The endogenous variable in the Var model has an L-order lag period, which is called the VAR(L) model. The optimal lag order is determined on the premise of ensuring that the dynamic characteristics of the constructed model are completely reflected and the model is prevented from losing too many degrees of freedom. Count L. According to Akachi Information Criteria (AIC) and Schwartz (SC) criteria, the optimal lag order for the period (I) is 6, and the optimal lag order for the period ( ) is 3. 3.3.3. Johansen cointegration test. Table 3 represents the results of the cointegration test for the period (I), and Table 4 represents the results of the cointegration test for the period (II). The results show that there is a co-integration relationship between FP and SP in periods ( ) and ( ), that is, there is a stable co-integration relationship between futures and spot prices,
- 5. International Journal of Trend in Scientific Research and Development @ www.ijtsrd.com eISSN: 2456-6470 @ IJTSRD | Unique Paper ID – IJTSRD47601 | Volume – 5 | Issue – 6 | Sep-Oct 2021 Page 1255 which is consistent with the conclusions of existing research [3,8,9]. Among them, cointegration equation for the period ( ) is: e=FP--0.709771*SP, cointegration equation for the period( ) is: e=FP- -0.856044*SP. In summary, there is a high correlation between soybean meal futures and spot prices, and the co-integration relationship is significant. Observing the trend of soybean meal futures and spot prices shows that the two trends are basically the same. Even if there is a short-term deviation, the spot price will converge to the futures in the long-term, and the correlation analysis of the two periods shows that the correlation between the period and the spot is 0.8 above. In addition, the Johansen cointegration test shows that there is a cointegration relationship between the two time periods and spot prices. Table 3 Cointegration test results of each variable for the period( ) Null hypothesis Trace inspection Biggest feature and test Statistics 5% Threshold Statistics 5% Threshold The number of cointegration equations is 0 17.140 15.494 12.876 14.265 The maximum number of cointegration equations is 1 4.264 3.841 4.264 3.841 Table 4 Cointegration test results of each variable for the period( ) Null hypothesis Trace inspection Biggest feature and test Statistics 5% Threshold Statistics 5% Threshold The number of cointegration equations is 0 26.902 15.495 19.300 14.265 The maximum number of cointegration equations is 1 7.603 3.841 7.6035 3.841 3.3.4. Granger causality test. The Granger causality test is performed on the futures and spot price sequences in the two periods, and the results are shown in Table 5. It can be seen from the table that: For the period( ), the lag 2 period to the lag 9 period causality test all reject the null hypothesis that the futures do not lead the spot, and neither reject the null hypothesis that the spot does not lead the futures; For the period( ),from lagging 2 periods to lagging 9 periods, the spot price is guided by a single item of futures price to the two-way guidance of futures and spot prices, indicating that the price guiding ability of the soybean meal spot market has gradually become stronger. This shows that the price guiding ability of the spot market has been significantly enhanced after the occurrence of trade frictions. Table 5 Causality test results of each variablefor the period ( ) and period ( ) Lag period Null hypothesis Period( ) Period(Ⅱ ) p Value Whether to reject the null hypothesis p Value Whether to reject the null hypothesis 2 FP does not boot SP 4.00E-09 Refuse 2.00E-12 Refuse SP does not boot FP 0.7387 Don't refuse 0.0285 Don’t refuse 4 FP does not boot SP 2.00E-09 Refuse 2.00E-11 Refuse SP does not boot FP 0.1744 Don’t refuse 0.0526 Don’t refuse 6 FP does not boot SP 2.00E-11 Refuse 1.00E-10 Refuse SP does not boot FP 0.2916 Don’t refuse 0.1194 Don’t refuse 8 FP does not boot SP 9.00E-11 Refuse 0.0069 Refuse SP does not boot FP 0.3921 Don’t refuse 5.00E-12 Refuse 9 FP does not boot SP 1.00E-10 Refuse 0.0252 Refuse SP does not boot FP 0.4002 Don’t refuse 4.00E-11 Refuse 3.3.5. Variance decomposition. Variance decomposition is to analyze the proportion of the standard deviation of the prediction residuals affected by different innovations, that is, the contribution rate of the corresponding endogenous variables to the standard deviation. [12] Table 6 shows the variance decomposition results of the futures price and spot price series in the two periods (I) and (II). It can be seen from the table that the deconstruction of the perturbation term of the spot price sequence in the period ( ) shows that the spot price is affected by the impact from the futures, which increases from 43.231% in the first period to 81.623% in the 100th period, and the impact from the spot is from the first period. 56.769% dropped to 18.377% for the 100th period. Deconstructing the perturbation term of the
- 6. International Journal of Trend in Scientific Research and Development @ www.ijtsrd.com eISSN: 2456-6470 @ IJTSRD | Unique Paper ID – IJTSRD47601 | Volume – 5 | Issue – 6 | Sep-Oct 2021 Page 1256 futures price sequence shows that the futures price is always almost zero when the impact comes from the spot price, and the impact caused by the futures price is always more than 99%. It can be concluded that:Soybean meal futures play a leading role in price discovery during the period(I). In the deconstruction of the disturbance term of the spot price sequence in the period ( ), it can be seen that the spot price has increased from 38.706% in the first period to 86.341% in the 100th period due to the impact from the futures, while the shock from the spot price has decreased from 61.294% in the first period. By the 100th period, 13.659%. Deconstruction of the disturbance term of the futures price sequence shows that the futures price has increased from 0% to 18.401% of the 100-period shock from the spot price, while the impact of the futures price has decreased from 100% to 81.599% of the 150-period shock. It can be seen that during the period (II), soybean meal futures play a leading role in price discovery, but the impact of spot on futures also increases with the growth of the forecast period. Table 6Variance decomposition results of each variable during the Period ( ) and ( ) Forecast period Period( ) Period( ) SP comes from FP comes from SP comes from FP comes from SP FP SP FP SP FP SP FP 1 56.769 43.231 0.000 100.000 61.294 38.706 0.000 100.000 5 39.815 60.185 0.004 99.996 39.973 60.027 0.495 99.505 10 35.830 64.170 0.004 99.996 32.171 67.829 1.223 98.777 20 30.950 69.050 0.034 99.966 21.759 78.241 3.202 96.798 50 23.164 76.836 0.261 99.739 10.487 89.513 10.539 89.461 100 18.377 81.623 0.669 99.331 13.659 86.341 18.401 81.599 From the results of variance decomposition, it can be seen that the proportion of the impact of futures on the spot in the two periods increases with the extension of the forecast period, reaching more than 80% by the 100- period, indicating that the spot price is greatly affected by the futures. On the other hand, in the period before the Sino-U.S. trade friction, the impact from the spot on futures prices only accounted for 0.669%, while the impact from the spot on the futures price in the period after the Sino-US trade friction increased from 0 to 18.401%, although the futures still It is the dominant price discovery, but relatively speaking, the price discovery function of soybean meal futures in the period before the Sino-US trade friction occurs is stronger. At the same time, it can be seen that the futures price has a lag effect on the spot price, so manufacturers have time to change according to the futures price. Adjust production activities. 3.3.6. Common factor model. In order to further study the proportion of the market’s integration of new information, the vector error correction model can be used to analyze the dynamic guiding relationship between futures and spot prices. Therefore, this paper selects a public factor model based on the vector error correction model. The empirical results are shown in Table 7: The leading role in the market price discovery during the period(I) (II) is the futures market. The difference is that the futures market is absolutely dominant in both the IS model and the PT model during the period ( ), while the contribution of the spot market in the permanent transient model during the period ( ) is close to 50%, and the price of the futures market It is found that the efficiency is relatively lower than the period (I). Table 7 Price discovery contribution share Full time Period ( ) Period ( ) FP SP FP SP FP SP I-S model 0.885 0.115 0.735 0.265 0.839 0.161 P-T model 0.605 0.395 0.839 0.161 0.511 0.489 The results of the public factor model show that, in the information share model, the contribution of the futures market to the variance of the public factor is roughly the same in the two time periods, and plays an absolute leading role in price discovery. In the permanent transient model, the futures market remains unchanged during the two time periods. Dominance, but the leading role has been greatly weakened in the period after the Sino-US trade friction. This is mutually corroborated with the conclusion of variance decomposition in the previous article.
- 7. International Journal of Trend in Scientific Research and Development @ www.ijtsrd.com eISSN: 2456-6470 @ IJTSRD | Unique Paper ID – IJTSRD47601 | Volume – 5 | Issue – 6 | Sep-Oct 2021 Page 1257 4. Conclusions This article uses correlation analysis, cointegration test, causality test, variance decomposition, and common factor model analysis to qualitatively and quantitatively measure the price discovery function of China’s soybean meal futures, and compare it from October 1, 2014 to December 29, 2017. And the empirical results of the two time periods from January 2, 2018 to November 30, 2020 can be drawn: Generally speaking, the main position of the soybean meal futures market in price discovery before and after the Sino-US trade friction remains unchanged. After the friction, the impact of the soybean meal spot market has increased significantly. Regarding the difference between the strengths and weaknesses of the futures market price discovery functions in the two periods, this article believes that the following reasons are included. First, the spot price fluctuations and basis risks caused by the Sino-US trade friction have affected the original futures spot market linkage relationship. , Which weakens the price leadership of the futures market. At the same time, trade frictions and weather speculation have caused the soybean meal futures market to rapidly increase in trading volume. According to data from the Dalian Commodity Exchange, the annual trading volume of soybean meal futures from 2018 to 2020 increased by 46%, 14% and 31% year-on-year, while the same period The daily average open interest of soybean meal futures increased by 20.42%, -2.90% and - 24.85% year-on-year. The greater the volume, the greater the price volatility. There are a large number of irrational traders in the market with greater volatility, and they will ignore the market. Real information and intrinsic value, too much attention has nothing to do with real value, irrational self- recognition of real market noise, which will affect the efficiency of market prices in response to real information, and then affect the efficiency of market price discovery; the second is April 5, 2020 Due to the impact of the epidemic and other factors in the month of soybean import restrictions, the weaker trend of U.S. soybeans led to the weakening of domestic soybean meal futures. On the spot, due to the March and April epidemics, the quarantine link time increased, and the delivery speed of Brazil and other countries slowed down. The decrease in arrivals in May has led to insufficient inventory. Most oil plants have limited delivery, and feed factories have reduced or restricted production. The demand side is affected by the epidemic. The restocking time of pigs in 2020 will be delayed. Therefore, the number of pigs in the second quarter is compared with the previous quarter. An increase of 5.8%. At the same time, poultry production has continued to grow. These factors together cause the phenomenon that the soybean meal market is currently strong and weak, which in turn affects the efficiency of price discovery. 5. Suggestion 5.1. Encourage entity companies to participate in hedging In order to increase the holdings of futures contracts, the structure of participants in the futures market should be improved, and more relevant entities should be encouraged to participate in hedging to increase the holdings of the main contracts, instead of only increasing the trading volume to promote the activity of the futures market. Active hedging behavior is conducive to the stable operation of the soybean meal futures market. It is possible to further reduce the hedging margin standard for soybean meal futures and provide more preferential handling fees to increase the enthusiasm of enterprises for hedging, thereby improving the efficiencyof price discovery in the futures market. 5.2. Improve the information disclosure system of soybean meal futures market Improving the information disclosure system will help reduce market information asymmetry and reduce irrational transactions in the market. This will help improve the market’s ability to withstand risks, avoid unnecessary risks caused by excessive speculation, and make soybean meal futures market more effective. Autonomy, thereby improving the efficiency of market operations. 5.3. Expand market opening and promote the internationalization of soybean meal futures Based on the research background of Sino-US trade frictions, and on the premise that the soybean meal futures market has a better price discovery function, the market can be opened up, promote the internationalization of soybean meal futures, and introduce more QFII and RQFII investment in commodity futures, so that soybean meal futures will be in the market. A larger international scope plays the role of price discovery. Ensure that in the face of external shocks from major events such as trade frictions, the futures market can effectively hedge against the impact of abnormal fluctuations in the spot market, thereby improving the futures market's ability to serve the real economy. References: [1] Yang Junzhan. An Empirical Study on the Interactive Impact of China's Gold Futures and Spot Prices[J]. Shanghai Economic Research, 2014 (01).
- 8. International Journal of Trend in Scientific Research and Development @ www.ijtsrd.com eISSN: 2456-6470 @ IJTSRD | Unique Paper ID – IJTSRD47601 | Volume – 5 | Issue – 6 | Sep-Oct 2021 Page 1258 [2] Kawaller. I. Koch. P. the Temporal Price Relationship between S&P500 Futures Markets, 1987. [3] Xie Xiaowen, Fang Yi, Zhao Shengmin. Research on the Price Discovery Function of China’s Futures Market[J]. Journal of Systems Engineering, 2016, 31 (03). [4] Zhou Jing, Zhang Yunpeng, Liu Qun. Research on the transmission relationship between soybean futures and spot prices[J]. Price Theory and Practice, 2019 (12). [5] Dai Peng, Tang Xiaoyi, Zeng Wenjuan. The price discovery function and dynamic evolution of China's soybean meal futures market: an empirical analysis based on dynamic Granger causality test[J]. Journal of Hunan Agricultural University (Social Science Edition), 2019, 20 (4). [6] Chen Zhiyuan. Research on China's Corn Futures Price Discovery Function——A Comparison of Corn Futures on the Chicago Mercantile Exchange[J]. Price Theory and Practice, 2020 (03). [7] Wang Zhen. Research on the Price Discovery Function of Treasury Bond Futures [D]. Chengdu: Southwestern University of Finance and Economics, 2013. [8] Hasbrouck J. One security, many markets: Determining the contributions to price discovery. Journal of Finance, 1995 (4). [9] Gonzalo, J, C. Granger. Estimation of Common Long-memory Components in Co-integrated System[J]. Journal of Business & Economic Statistics, 1995, 13 (1). [10] Donald Lien, Keshab Shrestha. A New Information Share Measure[J]. Journal of Futures Markets, 2009 (4). [11] Liu Chen, Zhang Rui, Wang Baosen. Comparison of the functional efficiencyof corn futures markets in China and the United States [J]. China Circulation Economy, 2020, 34 (04). [12] Tang Zhiyuan. Research on the Impact of Social Security Expenditure Structure on Residents’ Income Gap [D]. Nanjing University of Finance and Economics, 2017.