
Recommended
Recommended
More Related Content
Similar to Factor Affecting Customer Purchasing Decision of Poultry Product in Indonesia PUBLISH.pdf
Similar to Factor Affecting Customer Purchasing Decision of Poultry Product in Indonesia PUBLISH.pdf (20)
Recently uploaded
Recently uploaded (20)
Factor Affecting Customer Purchasing Decision of Poultry Product in Indonesia PUBLISH.pdf
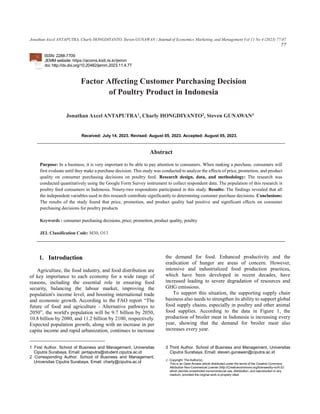
- 1. Jonathan Axcel ANTAPUTRA, Charly HONGDIYANTO, Steven GUNAWAN / Journal of Economics Marketing, and Management Vol 11 No 4 (2023) 77-87 77 ISSN: 2288-7709 JEMM website: https://acoms.kisti.re.kr/jemm doi: http://dx.doi.org/10.20482/jemm.2023.11.4.77 Factor Affecting Customer Purchasing Decision of Poultry Product in Indonesia Jonathan Axcel ANTAPUTRA1 , Charly HONGDIYANTO2 , Steven GUNAWAN3 Received: July 14, 2023. Revised: August 05, 2023. Accepted: August 05, 2023. Abstract Purpose: In a business, it is very important to be able to pay attention to consumers. When making a purchase, consumers will first evaluate until they make a purchase decision. This study was conducted to analyze the effects of price, promotion, and product quality on consumer purchasing decisions on poultry feed. Research design, data, and methodology: The research was conducted quantitatively using the Google Form Survey instrument to collect respondent data. The population of this research is poultry feed consumers in Indonesia. Ninety-two respondents participated in this study. Results: The findings revealed that all the independent variables used in this research contribute significantly to determining customer purchase decisions. Conclusions: The results of the study found that price, promotion, and product quality had positive and significant effects on consumer purchasing decisions for poultry products Keywords : consumer purchasing decisions, price, promotion, product quality, poultry JEL Classification Code: M30, O13 1. Introduction12 Agriculture, the food industry, and food distribution are of key importance to each economy for a wide range of reasons, including the essential role in ensuring food security, balancing the labour market, improving the population's income level, and boosting international trade and economic growth. According to the FAO report “The future of food and agriculture - Alternative pathways to 2050”, the world's population will be 9.7 billion by 2050, 10.8 billion by 2080, and 11.2 billion by 2100, respectively. Expected population growth, along with an increase in per capita income and rapid urbanization, continues to increase 1 First Author. School of Business and Management, Universitas Ciputra Surabaya, Email: jantaputra@student.ciputra.ac.id 2 Corresponding Author. School of Business and Management, Universitas Ciputra Surabaya, Email: charly@ciputra.ac.id the demand for food. Enhanced productivity and the eradication of hunger are areas of concern. However, intensive and industrialized food production practices, which have been developed in recent decades, have increased leading to severe degradation of resources and GHG emissions. To support this situation, the supporting supply chain business also needs to strengthen its ability to support global food supply chains, especially in poultry and other animal food supplies. According to the data in Figure 1, the production of broiler meat in Indonesia is increasing every year, showing that the demand for broiler meat also increases every year. 3 Third Author. School of Business and Management, Universitas Ciputra Surabaya, Email: steven.gunawan@ciputra.ac.id ⓒ Copyright: The Author(s) This is an Open Access article distributed under the terms of the Creative Commons Attribution Non-Commercial License (http://Creativecommons.org/licenses/by-nc/4.0/) which permits unrestricted noncommercial use, distribution, and reproduction in any medium, provided the original work is properly cited.
- 2. 78 Jonathan Axcel ANTAPUTRA, Charly HONGDIYANTO, Steven GUNAWAN /Journal of Economics Marketing, and Management Vol 11 No 4 (2023) 77-87 Figure 1: Indonesia’s Broiler Meat Production 2017 Chicken and beef are common food products used in countries dominated by Muslims. Using the results of the 2019 National Socio-Economic Survey (SUSENAS) data, Lokadata.id investigated the level of consumption of these two types of meat. This pattern has been replicated throughout the Indonesian archipelago. From Figure 2, it can be seen that the highest consumption of meat type in Indonesia is chicken. According to previous research regarding the supply chain of poultry and animal food, the increase in demand for food consumption, especially in chicken meat production will also demand a supportive food supply chain in the poultry industry to fulfill the demand for consumption. These data indicate that Indonesia has high demand for chicken meat. Figure 2: The Data of Chicken and Meat Consumption in Indonesia in 2019 The domestic animal feed industry plays a very important role in supporting the livestock industry by providing meat and its derivative products for the community as an additional source of protein. Feed accounts for 70% of the total cost of livestock production, therefore it remains a promising business. At the macro level, the livestock sector can contribute significantly to the formation of Gross Domestic Product (GDP), food security, increasing the average income of the national population, and creating job opportunities. It is not surprising that the livestock sector is expected to support economic growth, in both agriculture and the national economy. From a financial perspective, feed plays the largest role in production costs compared to other factors, ranging from 60% to 70%. In general, the national animal-feed industry provides good opportunities. Table 1 shows that the animal feed industry has experienced an average growth of 8% in the last five years, based on the level of production. Table 1: Indonesian Poultry Animal Feed Production According to data from the Association of Animal Feed Entrepreneurs (GPMT), 90% of the animal feed industry is absorbed by laying hens and broiler breeders. This high level of consumption shows that the animal feed industry still has great opportunities to develop the poultry industry in Indonesia. Thus, competition in the animal-feed industry will experience the same thing. To determine the factors that can influence buyers' decision to buy animal feed, the authors distributed a pre-survey to 30 respondents on the island of Java to represent the Indonesian population. The results of the pre-survey state that price, promotion, and product quality are the variables that determine consumer choices in their purchasing decisions when buying poultry feed. With the current conditions where competition in the animal feed industry is increasing rapidly, research related to consumer purchasing decisions for animal feed will provide benefits to producers and consumers. Knowing the factors that can influence buying interest, will provide useful insights for future providers and users of animal feed. 2. Literature Review 2.1. Customer Purchasing Decision A consumer's preference for purchasing a product or service determines the purchase decision. The term “intention” is traditionally defined as the antecedent that stimulates and drives consumers' purchases of products and services. According to (Singhal et al., 2019; Hongdiyanto et al., 2020), the purchase decision is a type of decision- making that considers the reason why consumer purchases a Year Production Growth 2015 16.720.000 - 2016 18.370.000 8,1 % 2017 18.500.000 6,6 % 2018 19.400.000 8,0 % 2019 20.300.000 7,6 % Average Growth 8 %
- 3. Jonathan Axcel ANTAPUTRA, Charly HONGDIYANTO, Steven GUNAWAN / Journal of Economics Marketing, and Management Vol 11 No 4 (2023) 77-87 79 particular brand. Purchasing decisions often lead to different factors, such as product availability, price, promotion, and product placement. Understanding customers’ purchasing decisions involves understanding their emotional, cognitive, and behavioral alignment, which results in the same outcome. The buying choice of a customer is a difficult procedure. Purchase intention is often related to customer behavior, perceptions, and attitudes. Purchase behavior is an important factor in a consumer's ability to access and assess a given product. Purchase intent is an excellent instrument for forecasting the purchasing process. Before deciding to buy a product, the customer will likely evaluate it based on certain criteria or standards. According to a recent study (Wijaya et al., 2018) regarding customers’ purchase decisions, these are the variables that can be used as indicators: 1. Repurchase: The customer is willing to repurchase from the business. Thus, customers feel satisfied with the prior transaction in the business. 2. Recommendation: The customer is willing to recommend the business to friends. This recommendation indicates that the customer has trust in the brand. 3. Preference: The customer prefers to choose the store over another similar business. The customer has a bond loyalty connection with the business. 2.2. Price Price is defined as the amount the buyer must pay to return the goods. Before considering the purchase of a product, many people will take into consideration its price. In addition, price has a significant impact on purchase intention, as changes in production have a significant impact on customers (Zhang et al., 2018). Yang and Wang (2020) suggest that customers may be influenced by a reduced price as a factor in their decision to buy. Individuals who are price sensitive make every effort to find a lower price. The stated price must be in accordance with the economic benefits that the customer gains from purchasing the product. The determination of price itself can be influenced by many different factors, such as product demand and supply, product quality, market competitors and conditions, and business target profitability. However, the price must be adjusted accordingly to balance the needs of both buyers and sellers. These are indicators of price measurements based on Puspita et al. (2021): 1. Price affordability: The price offered is affordable for customers. The customer can pay the price according to its capabilities to afford the products. 2. Price match with product quality: The price offered by a store reflects product quality. The product has a certain quality that can appeal to customers to buy, even if the price given is slightly different from the other business. 3. Price competitiveness: The price offered is competitive compared with other businesses. The price offered was slightly cheaper for customer comparison. 4. Price match product benefits: The price offered by the business is already balanced by the product benefits given to customers. Customers feel that they have already gained the advantage by paying the stated price. 2.3. Promotion Promotion is a technique used to attract customer interest and increase awareness of a product (Rietveld et al., 2019). Sales promotion is an important component of marketing campaigns that consists of short-term incentive tools aimed at encouraging consumers or trading to acquire specific items or services more quickly or more frequently. Whereas advertising provides a cause for purchase, sales promotions provide an incentive to purchase. While advertising provides a reason for purchasing, sales promotions provide an incentive to purchase. Sales promotion consists of promotional actions that drive purchases, unlike advertising, personal selling, or publicity. Customers are often enticed by direct enticement that provides additional incentives to make purchasing decisions. Sales promotion activities are conducted concurrently with advertising and publicity activities. Kotler and Keller (2017) stated that there are few indicators aligned with identifing the promotion of products: 1. Sample: The seller offers free products to help the customer gain experience in trying the products. 2. Coupons: The coupon used as the price reduction or giving the customer additional product freebies as their bonus. 3. Cross Promotion: Cross promotion can be offered by selling two or more products together to help increase product sales. 4. Price Pack: Offers to consumers as a discounted price when customers decide to buy a product more than the regular amount.
- 4. 80 Jonathan Axcel ANTAPUTRA, Charly HONGDIYANTO, Steven GUNAWAN /Journal of Economics Marketing, and Management Vol 11 No 4 (2023) 77-87 2.4. Product Quality According to Sun et al. (2018), product quality is one of the most important factors to consider when purchasing an item. Product quality is a crucial aspect in determining purchase decisions. Product quality refers to how a product can achieve its true benefit to satisfy customer demand. This aspect can be offered by the seller, which appeals to customers who are able to influence them to decide what they need to buy from the brand and business. According to Kotler and Amstrong (2018), product quality indicators are: 1. Performance: The products sold can perform their true benefits in satisfying customers’ need to buy the product. In the poultry industry, the expected product performance provides the cattle with the food and nutrition they need. 2. Features: The product offers features that distinguish it from other products. The product has personal value in offering customers benefits and worth. 3. Reliability: The products sold are trustworthy. A product is believed to provide customer benefits continuously when it is being used and consumed. 4. Conformity: The product sold is already suitable with the features initially offered to customers. The product meets customer expectations. 5. Aesthetics: A product is presented to customers in appealing ways. The products can be seen as interesting products sold based on their tangible features. 6. Perceived Quality: The product quality is in accordance with customer expectations. 2.4. Relationship between Variables Price is an important element that influences purchase decisions. Customers' inclination to acquire things is influenced by the price. High prices result in higher expenses for consumers, diminishing their willingness to acquire goods. Büyükdağ, et al. (2020) agree that a product's perceived price has a direct impact on customers' purchasing decisions. Yuan et al. (2019) discovered a link between perceived pricing and purchase decisions in the context of purchasing. Similar research conducted by Massora at al. (2022) also found that the price has a strong positive relationship toward customer purchasing decisions. Bhatti (2018) found that the price has insignificant effect toward customer purchasing decision. Zhang et al. (2018) also found that price has negatively affected customer purchasing decision. The research conducted by Vahdat et al. (2021) also supported these findings by finding that price has negatively affected customer purchasing decision. Wang et al. (2018) found that price has neutrally affect the customer purchasing decision, these finding also similar with the result research of Wong et al. (2019). The findings by El-Said (2019) also found that price has neutrally affected customer purchasing decision. Ling et al. (2019) define promotion as information is passed or either persuasion that directs individuals, persons, or groups to create a demand. The marketing strategy is used to extend and enter the market, to establish the company's image, to offer information, to raise and stabilize sales, to add value to products, and to differentiate them. Liu et al. (2020) state that the promotion has effect towards customer purchasing decision. The promotional given has the purpose to pursue the customer in buying the products. The promotional given used as the way to lead the customers on demanding a certain product. Melovic et al. (2019) also do research with the result that the promotion affects the customer’s purchasing decisions. Sokolova and Kefi (2020) conduct research and find that promotion has negatively affected customer purchasing decisions. A result by Peng et al. (2019) find that promotion has significant effect toward customer purchasing decision. Another research by Ariffin et al. (2018) found that promotion has negative effect toward customer purchasing decision. Another research from Wang et al. (2019) prove that promotion has neutrally affect customer purchasing decision. This research result is also similar and supported with the finding from another researcher by Qi et al. (2020) and Prakash et al. (2019). One of the considerations the customers make when making purchasing decision is analyzing the product quality. Product quality is taken into the consideration since the customer expects to gain the benefit features from the products they are buying. According to the recent studies by Zhang et al. (2019), product quality is able to influence the customers’ purchasing decision. The customers make consideration by paying attention regarding the products expectation they will get. Wang at al. (2020) also stated that product quality also influences the customers’ purchasing decisions. Another research conducted by Jordan et al. (2018) found that product qualities has negatively affect customer purchasing decision. Yu et al. (2018) also found that product quality has insignificant effect toward customer purchasing decision, similar with the research result of Sun et al. (2018). Another study conducted by Perez et al. (2019) found that product qualities has neutrally affect customer purchasing decision. Lin et al. (2019) also found that product quality affect neutrally on customer purchasing decision.
- 5. Jonathan Axcel ANTAPUTRA, Charly HONGDIYANTO, Steven GUNAWAN / Journal of Economics Marketing, and Management Vol 11 No 4 (2023) 77-87 81 Figure 3: Model of Analysis 3. Research Methods The population for the research is the customer of animal food customers in Indonesia in which the author is unable to have it, therefore the author decided to use the Hair et al. (2017) formula to find the number of samples for unknown population. The formula is based on the number of indicators used times the number of 5-10. The number of indicators is 17 times 6 (the author chooses it), therefore the sample size is 102. This research used five point Likert Scale as a measurement. All variables are measured by five point Likert Scale ranging from Strongly Disagree (1) to Strongly Agree (5). According to Yamashita (2022), Likert Scale is a measurement of individual or group behavior towards the object of the study. The researcher uses five point Likert Scale because it is used in previous similar study as the researcher’s topic. Table 2: Variables and Indicators Apart from that, it is also used to help respondents distinguish the answer more easily and faster. According to Mellinger et al. (2020), reliability is a test of how consistently a measuring instrument measures whatever concept it is measuring. Validity is a test of how well an instrument that is developed measures the concept it is intended to measure. The reliability of a measure is established by testing for both consistency and stability. Consistency indicates how well the items measuring a concept hang together as a set, Cronbach's alpha is a reliability coefficient that indicates how well the items in a set are positively correlated to one another. Multiple Regression Analysis the appropriate technique to use when there are several independent variables that need to be examined for their influence on a dependent variable. The formula of multiple regression models in this research: Y = α + βX1 + βX2 + βX3 + ε Whereas: Y: Purchase decision β: Beta ε: error X1: Promotion X2: Price X3: Product Quality The t-test basically shows how far the influence of one independent variable individually explains the variation of the dependent variable. Test this used to partially test the independent variables on the dependent variable by using a 5% significance level (Delacre et al., 2019). In addition, based on the value of t, then the independent variable has the most dominant influence on the dependent variable. The f VARIABLES INDICATORS Promotion (X1) Promotion is a key ingredient in marketing campaigns, consist of collection incentive tools, mostly short term, designed to stimulate quicker or greater purchase of products or services by consumers or the trade. (Kotler & Keller, 2017) 1. Sample 2. Coupons 3. Cross Promotion 4. Price Pack Price (X2) Price is the consumer's perceptual representation or subjective perception of the objective price of the product. (Puspita et al., 2021) 1. Price Affordability 2. Price match with product quality 3. Price competitiveness 4. Price match with product benefits VARIABLES INDICATORS Product Quality (X3) Product quality is one of the most important factors to consider when purchasing items. Product quality is a crucial aspect that determines purchase decision (Sun et al., 2018). 1. Performance 2. Features 3. Reliability 4. Conformity 5. Aesthetics 6. Perceived Quality Purchase Decision (Y) Purchase decision is the preference of consumer to buy the product or service. Traditionally, the term intention is defined as the antecedents that stimulate and drive consumers' purchases of products and services. (Wijaya et al., 2018) 1. Willingness to go back in the future. 2. Recommended the place to other people. 3. Preference Price (X1) H1 Promotion (X2) H2 Customer Purchasing Decision (Y) H3 Product Quality (X3)
- 6. 82 Jonathan Axcel ANTAPUTRA, Charly HONGDIYANTO, Steven GUNAWAN /Journal of Economics Marketing, and Management Vol 11 No 4 (2023) 77-87 test basically shows whether all the independent variables (free) have a joint effect on the dependent (bound) variable (Delacre et al., 2019). The test is used to find out how all the independent variables (price, product quality and promotion) together have a significant effect on the dependent variable (purchase decision) using the significant level (a=5%). The coefficient of determination essentially measures how far the model's ability to explain variations in the dependent variable is. The value of the coefficient of determination is between zero and one. A small R value means the ability of the variables independent in explaining the variation of the dependent variable is very limited. For the classical assumption test, the writer uses multicollinearity test, normality test, heteroskedasticity test and linearity test. The normality test is to see whether the residual value is normally distributed or not. Normality test is not carried out on each variable but on the residual value (Delacre et al., 2019). The multicollinearity test is to see whether there is a high correlation between the independent variables in a multiple linear regression model. If there is a high correlation between the independent variables, then the relationship between the independent variables on the dependent variable will be disturbed. The statistical tool that is often used to test multicollinearity disorders is the variance inflation factor (VIP), it is said that multicollinearity does not occur, if VIF <10 and tolerance value> 0.10 (Delacre et al., 2019). The heteroscedasticity test is to see whether there is an inequality of variance from one residual to another observation. Heteroscedasticity occurs when in the scatterplot the points have a regular pattern, either narrowing, widening or wavy (Delacre et al., 2019). The linearity test is one of the classical assumption tests that is carried out to determine the linear nature of the data distribution between the variables X and Y. It is necessary to know whether the linear nature of the X and Y relationship affects the level of validity of the resulting regression model (Delacre et al., 2019). 4. Results and Discussion Table 3: Descriptive Statistics From the targeted sample respondent, the author was only able to get 97 respondents due to the elimination of several data. The first analysis of the respondent characteristic is the respondent age. The researchers divided the age of respondents into five groups. As it can be seen from the result of Table 3 the main respondent of this research are people with the age of 21-40 years old. The researchers have found that 15 respondents participated are people with group age of 21-30, and 16 respondents participated are people with the group age of 31-40 year old. The customers are mostly adults which already have their own income and have other business related to animal and poultry business. Table 4: Reliability Test Result In this research, the data is considered reliable if the result of Cronbach Alpha is greater than 0.6. As can be seen from Table 4. all items are reliable because the value of Cronbach Alpha for each variable is greater than 0.6. Moreover, the data considered as valid if the result of the significance value test is less than 0.05. As can be seen from Table 5. All items are valid because the significance value test is less than 0.05. Table 5: Validity Test result Variables Indicators Sig. Value (2 tailed) Information Customer Purchasing decision (Y) Y1 0.000 VALID Y2 0.000 VALID Y3 0.000 VALID Price (X1) X1.1 0.000 VALID X1.2 0.000 VALID X1.3 0.000 VALID X1.4 0.000 VALID Promotion (X2) X2.1 0.000 VALID X2.2 0.000 VALID X2.3 0.000 VALID X2.4 0.000 VALID Age Frequency Percentage < 20 Years Old 9 9.3% 21 – 30 Years Old 52 80.4% 31 – 40 Years Old 12 7.2% 41 – 50 Years Old 7 12.4% >50 Years Old 17 17.5% Total 97 100% Variables Cronbach Alpha Information Customer Purchasing decision (Y) 0.900 RELIABLE Price (X1) 0.912 RELIABLE Promotion (X2) 0.899 RELIABLE Product Quality (X3) 0.910 RELIABLE
- 7. Jonathan Axcel ANTAPUTRA, Charly HONGDIYANTO, Steven GUNAWAN / Journal of Economics Marketing, and Management Vol 11 No 4 (2023) 77-87 83 Product Quality (X3) X3.1 0.000 VALID X3.2 0.000 VALID X3.3 0.000 VALID X3.4 0.000 VALID X3.5 0.000 VALID X3.6 0.000 VALID The F-test is conducted to analyze the significance influence between independent variables to the dependent variables. Based on the test result on Table 6, F value of 70.390 where this value is greater than F table = 2.703 and also a significance value of 0.000 which is much smaller than 0.05, it can be said that the variables Price, Promotion, and Product Quality together or simultaneously have a significant effect on variable Customer Purchasing decision. Table 6: F Test Table The t-test was conducted to analyze the partial influence of independent variables toward dependent variables. According to the data on Table 7 the independent variables partially influence the dependent variables. The influence result happens where the significance value if each variable is less than 0.05. The result of the multiple regression analysis formula is as follows: Customer Purchasing decision = 0.811 + 0.105(Price) + 0.264(Promotion) + 0.225(Product Quality). Table 7: t-Test Table In Indonesia, like in many other countries, customer purchase decisions for poultry feed are influenced by various factors. Three important factors that play a significant role in influencing these decisions are product quality, promotion, and price. Product quality is a crucial factor that influences customer purchase decisions. Poultry farmers and animal husbandry businesses in Indonesia are keen on providing the best care and nutrition to their livestock to ensure optimal growth and productivity. High- quality poultry feed is essential to meet the nutritional needs of the birds and promote their health and well-being. Promotion plays a vital role in shaping customer perceptions and preferences for poultry feed products. Effective marketing and promotional strategies can significantly impact purchase decisions. In Indonesia, various promotional methods are used to create awareness and ANOVAa Model Sum of Squares df Mean Square F Sig. 1 Regression 267.981 3 89.327 70.390 .000b Residual 118.019 93 1.269 Total 386.000 96 a. Dependent Variable: Customer Purchasing decision b. Predictors: (Constant), Product Quality, Price, Promotion Coefficientsa Model Unstandardized Coefficients Standardized Coefficients t Sig. B Std. Error Beta 1 (Constant) .811 .852 .951 .344 Price .105 .042 .181 2.515 .014 Promotion .264 .085 .327 3.109 .002 Product Quality .225 .062 .418 3.650 .000 a. Dependent Variable: Customer Purchasing decision
- 8. 84 Jonathan Axcel ANTAPUTRA, Charly HONGDIYANTO, Steven GUNAWAN /Journal of Economics Marketing, and Management Vol 11 No 4 (2023) 77-87 encourage the adoption of specific feed brands. Price is a critical factor in the purchase decision-making process for poultry feed in Indonesia. Poultry farmers and businesses must balance the cost of feed with the benefits they expect to gain from using the product. Price has a positive and significant effect on Customer Purchasing decision because the value of t count = 2.515 which is greater than t table = 1.986 and also the significance value is 0.014 or less than 0.05. Promotion has a positive and significant effect on Customer Purchasing decision because the value of t count = 3.109 which is greater than t table = 1.986 and also the significance value is 0.002 or less than 0.05. Product Quality has a positive and significant effect on Customer Purchasing decision because the value of t count = 3.650 which is greater than t table = 1.986 and also the significance value is 0.000 or less than 0.05. Table 8: Coefficient of Correlation (R) and Coefficient ofDetermination (R 2 ) Test The value of R Square is 0.694, this means that the ability of Price, Promotion, and Product Quality variables in explaining Customer Purchasing decision is 69.4% while the rest (100% - 69.4% = 30.6%) is explained by other variables that do not in this research. For the classical assumption test, researchers use multicollinearity test, normality test, heteroscedastic test and linearity test and this research passed all the test used. According to the data from the t-test result, the significant value of promotion is 0.002. The influence result happens where the significance value if each variable is less than 0.05. Promotion is considered to have a positive and significance effect toward customer purchasing decision since the significance test is less than 0.05. On the multiple regression analysis result, the coefficient of promotion is 0.264, which indicates that the variable has a positive relationship with the customer purchasing decision. The positive relationship shows that, where the promotion increased, the customer purchasing decision will also increase. According to the result, when the promotion is increased to 0.264, there will be an increase toward the customer purchase decision too. The example in poultry industry, the promotion given through discount and samples able to increase the customer purchase decision. This analysis concluded that the first hypothesis, H1: The promotion affects the customer purchasing decision is accepted. Ling et al. (2019) define promotion as information is passed or either persuasion that directs individuals, persons, or groups to create a demand. The marketing strategy is used to extend and enter the market, to establish the company's image, to offer information, to raise and stabilize sales, to add value to products, and to differentiate them. Liu et al. (2020) state that the promotion has effect towards customer purchasing decision. The promotional given has the purpose to pursue the customer in buying the products. The promotional given used as the way to lead the customers on demanding a certain product. Melovic et al. (2019) also do research with the result that the promotion affects the customer’s purchasing decisions. A similar result by Aji et al. (2020) also finds that promotion has significant effect toward customer purchasing decision. According to the data from the t-test result, the significant value of price is 0.002. The influence result happens where the significance value if each variable is less than 0.05. Price is considered to have a positive and significant effect toward customer purchasing decision since the significance test is less than 0.05. On the multiple regression analysis result, the coefficient of price is 0.105, which indicates that the variable has a positive relationship with the customer purchasing decision. The positive relationship shows that, where price satisfaction increases, the customer purchasing decision will also increase. According to the result, when the price satisfaction is increased for 0105, there will be an increase toward the customer purchase decision too. The example in poultry industry, the suitableness of price can be analyzed through the differentiation of product price according to the products benefit and quality. In the poultry industry, products with higher quality and able to give more benefits will be sold at a relatively higher price. This analysis concluded that the second hypothesis, H2: The price affects the customer purchasing decision is accepted. Price is considered as the important elements influencing purchase decision. Customers' inclination to acquire things is influenced by price. High prices result in higher expenses for consumers, which diminishes their willingness to acquire the goods. Model Summaryb Model R R Square Adjusted RSquare Std. Error of the Estimate 1 .833a .694 .684 1.127 a. Predictors: (Constant), Product Quality, Price, Promotion b. Dependent Variable: Customer Purchasing decision
- 9. Jonathan Axcel ANTAPUTRA, Charly HONGDIYANTO, Steven GUNAWAN / Journal of Economics Marketing, and Management Vol 11 No 4 (2023) 77-87 85 Yuan et al. (2019) discovered a link between perceived pricing and purchase decisions in the context of purchasing. Bhatti (2018) found that the price has insignificant effect toward customer purchasing decision. According to the data from the t-test result, the significant value of product quality is 0.000. The influence result happens where the significance value of each variable is less than 0.05. Product quality is considered to have a positive and significant effect toward customer purchasing decision since the significance test is less than 0.05. On the multiple regression analysis result, the coefficient of product quality is 0.225, which indicates that the variable has a positive relationship with the customer purchasing decision. The positive relationship shows that, where the product quality increases, the customer purchasing decision will also increase. According to the result, when the product quality is increased to 0.225, there will be an increase toward the customer purchase decision too. The example in the poultry industry, the product quality analysis conducted by setting each of the products with the benefits given clearly to the customers. This analysis concluded that the third hypothesis, H3: The product quality affects the customer purchasing decision is accepted. One of the considerations the customers make when making purchasing decision is analyzing the product quality. Product quality is taken into consideration since the customer expects to gain the benefit features from the products they are buying. According to the recent studies by Zhang et al (2019) product quality is able to influence the customers’ purchasing decision. The customers make consideration by paying attention regarding the products expectation they will get. Yu et al. (2018) also found that product quality has insignificant effect toward customer purchasing decision, similar with the research result of Sun et al. (2018) 5. Conclusions Based on the results of the analysis and findings in this study, it can be concluded that the results of the study are as follows: promotion has significant effect on customer purchasing decision in the poultry feed industry, price has significant effect on customer purchasing decision in the poultry feed industry, product quality has significant effect on customer purchasing decision in the poultry feed industry. It means that all the hypotheses are accepted. Considering the factors of product quality, promotion, and price that influence customer purchase decisions of poultry feed in Indonesia, there are several suggestions for the future of the poultry industry in Indonesia: 1. To enhance product quality, poultry feed manufacturers should invest in research and development. By conducting studies to understand the specific nutritional needs of different poultry breeds and life stages, they can create specialized feed formulations. High-quality feed that promotes better growth, health, and performance of poultry will attract more customers and build brand loyalty. 2. Implementing stringent quality assurance measures and obtaining relevant certifications can boost customer confidence in the feed products. Certifications from recognized organizations and compliance with industry standards demonstrate a commitment to delivering safe and reliable feed. Transparently sharing information about sourcing and production processes can further enhance trust. 3. Promotional efforts should go beyond traditional advertising and focus on educating customers about the benefits of using high-quality poultry feed. Content marketing, workshops, and seminars can be utilized to educate poultry farmers and businesses about the impact of feed quality on poultry health and productivity. Engaging customers through social media platforms can also foster a sense of community and facilitate two-way communication. 4. While competitive pricing is essential, the focus should not solely be on offering the lowest prices. Instead, emphasize the value proposition of the feed products, emphasizing the benefits of higher quality feeds and the long-term savings they can bring through improved poultry performance. Consider offering tiered pricing options to cater to customers with different budgets and needs. 5. Collaborating with veterinarians, animal nutritionists, and other experts in the poultry industry can help build credibility for the feed products. Such collaborations can provide valuable endorsements and recommendations to customers, who often rely on expert opinions when making purchasing decisions. This research limitation is that it is difficult to encourage the respondents to fill up the questionnaires form and it takes more than 6 weeks to collect the data from the respondents. Difficulties in getting appropriate respondents to fill out the given questionnaire because related to the topic of poultry feed which is not a common subject such as consumer goods. It is advised that future research do analysis and research by including other variables that may affect customer purchasing decision in more depth in addition to the aspects covered in this study, which are price, promotion, and product qualities. In addition, future research the analysis should also be done through qualitative method to gain in-depth perspective of the customers. Other than that, the number of samples could be larger to represent consumers in Indonesia by using simple random sampling.
- 10. 86 Jonathan Axcel ANTAPUTRA, Charly HONGDIYANTO, Steven GUNAWAN /Journal of Economics Marketing, and Management Vol 11 No 4 (2023) 77-87 References Aliaga, M. and Gunderson, B. (2002) Interactive Statistics. [Thousand Oaks]: Sage Publications Apuke, O. D. (2017). Quantitative research methods: A synopsis approach. Kuwait Chapter of Arabian Journal of Business and Management Review, 6 (11), 40- 47. https://doi.org/10.12816/0040336 Ariffin, S. K., Mohan, T., & Goh, Y. N. (2018). Influence of consumers’ perceived risk on consumers’ online purchase intention. Journal of Research in Interactive Marketing, 12(3), 309-327. Bhatti, A. (2018). Sales promotion and price discount effect on consumer purchase decision with the moderating role of social media in Pakistan. International Journal of Business Management, 3(4), 50-58. Bloomfield, J., & Fisher, M. J. (2019). Quantitative research design. Journal of the Australasian Rehabilitation Nurses Association, 22(2), 27-30. Borden, N. H. (1964). The concept of the marketing mix. Journal of advertising research, 4(2), 2-7. Büyükdağ, N., Soysal, A. N., & Kitapci, O. (2020). The effect of specific discount pattern in terms of price promotions on perceived price attractiveness and purchase intention: Experimental research. Journal of Retailing and Consumer Services, 55, 102112. Delacre, M., Leys, C., Mora, Y. L., & Lakens, D. (2019). Taking parametric assumptions seriously: Arguments for the use of Welch's F-test instead of the classical F-test in one-way ANOVA. International Review of Social Psychology, 32(1) 13, 1-13 El-Said, O.A. (2020). Impact of online reviews on hotel booking intention: The moderating role of brand image, star category, and price. Tourism Management Perspectives, 33, 100604. Hair Jr, J. F., Sarstedt, M., Ringle, C. M., & Gudergan, S. P. (2017). Advanced issues in partial least squares structural equation modeling. SaGe publications. Hongdiyanto, C., Hartono, W., Ongkowijoyo, G., & Saputra, V. W. (2020). The Effect of Discount and Promotion towards Customer Purchase Intention in Online Shop. Journal of Wellbeing Management and Applied Psychology, 3(3), 21-30 Jordan, G., Leskovar, R., & Marič, M. (2018). Impact of fear of identity theft and perceived risk on online purchase intention. Organizacija, 51(2), 146-155. Leedy P.D. & Ormrod J.E. (2010) Practical Research: Planning and Design. (9th Ed). Pearson Educational International, Boston Lin, X., Featherman, M., Brooks, S. L., & Hajli, N. (2019). Exploring gender differences in online consumer purchase decision making: An online product presentation perspective. Information Systems Frontiers, 21(5), 1187-1201. Ling, C., Zhang, T., & Chen, Y. (2019). Customer purchase intent prediction under online multi-channel promotion: A feature combined deep learning framework. IEEE Access, 7, 112963112976. Liu, Q., Zhang, X., Huang, S., Zhang, L., & Zhao, Y. (2020). Exploring consumers' buying behavior in a large online promotion activity: The role of psychological distance and involvement. Journal of theoretical and applied electronic commerce research, 15(1), 66-80. Majid, U. (2018). Research fundamentals: Study design, population, and sample size. Undergraduate research in natural and clinical science and technology journal, 2, 1-7. Massora, M. G., Amos, V., & Papalangi, N. (2022). The Effect of Price Discount Promotion on the Grab Application on Impulsive Purchase Decisions. JManagER, 2(1), 19-28. Mellinger, C. D., & Hanson, T. A. (2020). Methodological considerations for survey research: Validity, reliability, and quantitative analysis. Linguistica Antverpiensia, New Series– Themes in Translation Studies, 19. Melovic, B., Rogic, S., Cerovic Smolovic, J., Dudic, B., & Gregus, M. (2019). The impact of sport sponsorship perceptions and attitudes on purchasing decisions of fans as consumers— Relevance for promotion of corporate social responsibility and sustainable practices. Sustainability, 11(22), 6389. Peng, L., Zhang, W., Wang, X., & Liang, S. (2019). Moderating effects of time pressure on the relationship between perceived value and purchase intention in social E-commerce sales promotion: Considering the impact of product involvement. Information & Management, 56(2), 317-328. Pérez-Villarreal, H. H., Martínez-Ruiz, M. P., & Izquierdo-Yusta, A. (2019). Testing the model of purchase decision for fast food in Mexico: how do consumers react to food values, positive anticipated emotions, attitude toward the brand, and attitude toward eating hamburgers?. Foods, 8(9), 369. Permatasari, T., & Rubiyanti, N. (2021). The Linking of Product Quality, Brand Image, Price and Promotion On Purchasing Decision Of Uniqlo Products In Bandung. eProceedings of Management, 8(5). Prakash, G., Choudhary, S., Kumar, A., Garza-Reyes, J. A., Khan, S. A. R., & Panda, T. K. (2019). Do altruistic and egoistic values influence consumers' attitudes and purchase decisions towards eco-friendly packaged products? An empirical investigation. Journal of Retailing and Consumer Services, 50, 163- 169. Puspita, P., Sihab, M., & Barata, F. A. (2022). The Effects of Service Quality, Price Internet, Facility Internet, HR Customer Care on Purchasing Decision with Brand Image as a Mediation Variable in Choosing Internet Products at PT Supra Primatama Nusantara (Biznet Networks) in Banyuwangi. International Journal of Scientific Engineering and Science, 5(12), 91-99. Qi, X., Yu, H., & Ploeger, A. (2020). Exploring influential factors including COVID-19 on green food purchase decisions and the intention–behavior gap: A qualitative study among consumers in a Chinese context. International Journal of Environmental Research and Public Health, 17(19), 7106. Rietveld, J., Schilling, M. A., & Bellavitis, C. (2019). Platform strategy: Managing ecosystem value through selective promotion of complements. Organization Science, 30(6), 1232-1251. Schober, P., & Boer, C. (2018). Correlation Coefficients: Appropriate Use and Interpretation. Amsterdam University Medical Center. https://doi.org/10.1213/ANE.0000000000002864 Snyder, H. (2019). Literature review as a research methodology: An overview and guidelines. Journal of business research, 104, 333-339. Sokolova, K., & Kefi, H. (2020). Instagram and YouTube bloggers
- 11. Jonathan Axcel ANTAPUTRA, Charly HONGDIYANTO, Steven GUNAWAN / Journal of Economics Marketing, and Management Vol 11 No 4 (2023) 77-87 87 promote it, why should I buy it? How credibility and parasocial interaction influence purchase decisions. Journal of retailing and consumer services, 53, 101742. Sukamolson, S. (2007). Fundamentals of quantitative research. Language Institute Chulalongkorn University, 1(3), 1-20. Sun, H., Teh, P. L., & Linton, J. D. (2018). Impact of environmental knowledge and product quality on student attitude toward products with recycled/remanufactured content: Implications for environmental education and green manufacturing. Business Strategy and the Environment, 27(7), 935- 945. Taherdoost, H. (2016). Sampling methods in research methodology; How to choose a sampling technique for research. SSRN Electronic Journal. https://doi.org/10.2139/ssrn.3205035 Vahdat, A., Alizadeh, A., Quach, S., & Hamelin, N. (2021). Would you like to shop via mobile app technology? The technology acceptance model, social factors, and purchase decision. Australasian Marketing Journal, 29(2), 187-197. Wang, H., Ma, B., & Bai, R. (2019). How does green product knowledge effectively promote green purchase decision?. Sustainability, 11(4), 1193. Wang, J., Tao, J., & Chu, M. (2020). Behind the label: Chinese consumers’ trust in food certification and the effect of perceived quality on purchase intention. Food Control, 108, 106825. Wang, J., Pham, T. L., & Dang, V. T. (2020). Environmental consciousness and organic food purchase decision: a moderated mediation model of perceived food quality and price sensitivity. International journal of environmental research and public health, 17(3), 850. Wong, S. L., Hsu, C. C., & Chen, H. S. (2018). To buy or not to buy? Consumer attitudes and purchase decisions for suboptimal food. International journal of environmental research and public health, 15(7), 1431. Yamashita, T. (2022). Analyzing Likert scale surveys with Rasch models. Research methods in applied linguistics, 1(3), 100022. Yu, M., Liu, F., Lee, J., & Soutar, G. (2018). The influence of negative publicity on brand equity: attribution, image, attitude and purchase intention. Journal of Product & Brand Management, 27(4), 440-451. Yuan, L. W., Iqbal, S., Hussain, R. Y., & Ali, S. (2019). Impact of Price on Customer Satisfaction: Mediating Role of Consumer Buying Behavior in Telecom Sector. International Journal of Research, 6(04), 150-165 Zhang, L., Chen, L., Wu, Z., Zhang, S., & Song, H. (2018). Investigating young consumers' purchasing decisions of green housing in China. Sustainability, 10(4), 1044. Zhang, Y., Jing, N., & Song, M. (2019). Food quality information cognition and public purchase decisions: Research from China. Quality Assurance and Safety of Crops & Foods, 11(7), 647- 657.