MODELING AND OPTIMIZATION OF A MOBILE CROP RESIDUE DISINTEGRATOR
•
1 like•131 views

n the present work, experiments and analyses have been made to investigate the influence of parameter on performance of a mobile crop residue disintegrator . The experiments have been conducted as per Box - Behnken design matrix with input parameters as impact load, blade angle and cuttingpeed. Mathematical modeling has been done by response surface methodol ogy (RSM) to develop relationships between pro cess parameters and output response(s). The adequacy of the developed models has been tested with analysis of variance. The contour and surface plots for a mobile crop residue disintegrator have been made to reveal how output responses vary with change in the parameters.

Recommended
Recommended
More Related Content
What's hot
What's hot (16)
Similar to MODELING AND OPTIMIZATION OF A MOBILE CROP RESIDUE DISINTEGRATOR
Similar to MODELING AND OPTIMIZATION OF A MOBILE CROP RESIDUE DISINTEGRATOR (20)
More from IAEME Publication
More from IAEME Publication (20)
Recently uploaded
Recently uploaded (20)
MODELING AND OPTIMIZATION OF A MOBILE CROP RESIDUE DISINTEGRATOR
- 1. http://www.iaeme.com/IJMET/index.asp 320 editor@iaeme.com International Journal of Mechanical Engineering and Technology (IJMET) Volume 7, Issue 3, May–June 2016, pp.320–328, Article ID: IJMET_07_03_029 Available online at http://www.iaeme.com/IJMET/issues.asp?JType=IJMET&VType=7&IType=3 Journal Impact Factor (2016): 9.2286 (Calculated by GISI) www.jifactor.com ISSN Print: 0976-6340 and ISSN Online: 0976-6359 © IAEME Publication MODELING AND OPTIMIZATION OF A MOBILE CROP RESIDUE DISINTEGRATOR Nilesh Awate Research Scholar, Department of Mechanical Engineering, G. H .Raisoni College of Engineering, Nagpur, India. Dr. D. J. Tidke Ex. Professor, Department of Mechanical Engineering, V.N.I.T, Nagpur, India. ABSTRACT In the present work, experiments and analyses have been made to investigate the influence of parameter on performance of a mobile crop residue disintegrator .The experiments have been conducted as per Box- Behnken design matrix with input parameters as impact load, blade angle and cuttingpeed. Mathematical modeling has been done by response surface methodology (RSM) to develop relationships between process parameters and output response(s). The adequacy of the developed models has been tested with analysis of variance. The contour and surface plots for a mobile crop residue disintegrator have been made to reveal how output responses vary with change in the parameters. The proposed optimization methodology (RSM) seems to be useful for analyzing and optimizing any process where two or more input parameters influence more than one important output responses. Key words: cutting speed, impact load, Vibration, Box-Behnken, design Response surface, methodology Cite this Article: Nilesh Awate and Dr. D .J. Tidke, Modeling and Optimization of a Mobile Crop Residue Disintegrator. International Journal of Mechanical Engineering and Technology, 7(3), 2016, pp. 320–328. http://www.iaeme.com/currentissue.asp?JType=IJMET&VType=7&IType=3 1. INTRODUCTION The present study of design and development of a crop residue mobile disintegrator machine.The main objective of the research work were to develop a suitable size tractor operated crop residue disintegrator and to study the performance of the machine in actual field conditions with utilizing the optimized blade angle. The present machine was designed and developed by considering the different parameters. On the basis of theoretical considerations and assumptions made on different parameter for selection and development of components of mobile disintegrator
- 2. Modeling and Optimization of a Mobile Crop Residue Disintegrator http://www.iaeme.com/IJMET/index.asp 321 editor@iaeme.com machine various reviews taken in account of in the development procedure. As accordingly the various parts are developed and selected from the market during the development procedure. For optimization of design the cutting blade angle with different speed and load plays a vital role. For this the analysis was made on the combinations of blade angels, impact load and cutting speed and observed the responses on actual force, cutting efficiency and collection efficiency by utilizing the trial version of Design Expert 10.0.2 software for experimental design. The factorial Box-Behnken design matrices method was selected for optimized solution of the blade angle with 17 runs with three variables. By using this software the optimized solution of the blade angle with an impact load at a speed was detrain. Due to this an optimized blade was used for the final prototype development and to observe the field performance on large field. 1.1. Literature Survey The present work is to optimize the mobile disintegrator machine design by considering various parameter to get optimize design of the machine by considering BBD method. Several attempts had been made by different researchers to find out the parametric influence on the desired quality characteristics of ground parts. Also, several works were done to develop mathematical models of various machines etc. In the following paragraphs, a literature survey is reported in the context of above mentioned matters. This concerns research application of BBD method to optimize their design, optimization techniques applied in grinding, and relevant matters. Sergio Luis Costa Ferreira et. al (2007) the study describes fundamentals and applications of multivariate statistical techniques for the optimization of chromatographic systems. An optimization example involving a real separation process is exhaustively described In most real applications these differences are probably not decisive in determining which design to use, at least for this number of factors. However, since Box–Behnken designs do not contain combinations where all the factors are at their higher or lower levels, they may be useful in avoiding experiments under extreme conditions, for which unsatisfactory results might occur. Conversely, they are not indicated for situations in which we would like to know the responses at the extremes, that is, at the vertices of the cube. Box–Behnken designs for four and five factors can be arranged in orthogonal blocks, as shown in Table 4. In this table, each (±1, ±1) combination within a row represents a full 22 design. Dashed lines separate the different blocks. Because of the block orthogonality, the second-order model can be augmented to include block effects without affecting the parameter estimates, that is, the effects themselves are orthogonal to the block effects M Manohar et. al (2013) in this study it was reported that the use of Box Behnken design approach to plan the experiments for turning Inconel 718 alloy with an overall objective of optimizing the process to yield higher metal removal, better surface quality and lower cutting forces. Response Surface methodology (RSM) has been adopted to express the output parameters (responses) that are decided by the input process parameters. It is said that the RSM also quantifies the relationship between the variable input parameters and the corresponding output parameters. RSM designs allow us to estimate interaction and even the quadratic effects, and hence, give us an idea of the shape of the response surface we are investigating. Box-Behnken design is having the maximum efficiency for an experiment involving three factors and three levels; further, the number of experiments conducted for this is much lesser compared to a central composite design. The proposed Box-Behnken design requires 15 runs of
- 3. Nilesh Awate and Dr. D. J. Tidke http://www.iaeme.com/IJMET/index.asp 322 editor@iaeme.com experiment for data acquisition and modeling the response surface. Design expert software was used to design the experiment and randomize the runs. Box Behnken design was successfully adopted and the experiments were designed choosing the input variables for the levels selected. With minimum number of experiments, data was collected and the models were developed. Response Surface Models evolved for responses show the effect of each input parameter and its interaction with other parameters, depicting the trend of response... Guowei Shu et al (2013), the most common designs, that is central composite design (CCD) and Box-Behnken experimental design (BBD), of the principal response surface methodology have been widely used in various experiments. Box- Behnken design, a spherical and revolving design, has been applied in optimization of media; the extraction of polysaccharides from Jili was optimized using Design Expert version7.1 software. In this study the three variables involved in the optimization were liquid: solid ratio (x1), cellulase concentration (x2) and reaction time (x3). The F and p value indicated that the variable with the largest effect was the liquid: solid ratio (x1). This was followed by the quadratic effect of liquid: solid ratio (x12), the cellulase concentration (x2) and interaction effect of liquid: solid ratio and cellulase concentration (x1x2). Perincek Oguz and Colak Metin (2013) Reported that use of Box–Behnken a full range of response surface methodology using Box–Behnken experimental design to express the net harmonic current (3rd and 5th ) as an empirical model. It was reported that the model provided an excellent explanation of the relationship among the number of loads and the net harmonic currents. The results of experiments confirmed that the Box-Behnken experimental design can be used for the determination of loads responsibility and interactions of loads (A×B, A×C, B×C, etc.) for the 3rd and 5th harmonic currents. Myalowenkosi I. Sabela (2014), the study present describes an optimized Box- Behnken design using a catalytic-differential pulse polarograhic technique for the simultaneous determination of chromium (III) and (VI) in wastewater samples using ammonium piperidine dithiocarbamate as a complexing agent. The optimization strategy was carried out using a two level full factorial design. In this study a Box- Behnken design with fifteen runs, three independent variables (pH, concentration of NH4Cl-NH4OH and APDC) and three replicates at a centre point was used in this study. The experiment was randomized to reduce confounding variables by equalizing the three independent variables that have not been accounted for in the experimental design Rudrapati Ramesh et. al (2015) reported that the experiments and analyses have been made to investigate the influence of machining parameter. The experiments have been conducted as per Box- Behnken design matrix with input parameter .In this work mathematical modeling has been done by response surface method (RSM). In this study BBD with three factors, three level, and 15 runs are selected. In the BBD matrix the experiment consist of a set of point lying at the midpoint of each edge and replicated center point of multidimensional cube.
- 4. Modeling and Optimization of a Mobile Crop Residue Disintegrator http://www.iaeme.com/IJMET/index.asp 323 editor@iaeme.com 2. EXPERIMENTAL PLAN, SETUP AND PROCEDURE This section describes the experimental design used for development of mobile disintegrator .The effect of various parameters for development of mobile disintegrator fail type of blade, rotating speed of cutting drum , diameter of cotton stalk , force acting on blade , collection efficiency, and collecting efficiency. For the disintegrator as the cutting efficiency, collection efficiency and actual force required at variable speed are described under the experimental design along with the level and combination of treatment. The experimental design was applied after selection of the ranges. Seventeen experiments were required to completely randomized design (CRD) with three variable of two level of each variable and three replications. Actually in the present study around 27trails was carried out on different plot size this work has been done at varied levels of input parameters as per Box-Behnken design matrix, which is discussed subsequently. 2.1. Design of Experiments Design of experiments is widely used for controlling the effects of input parameters in any machining process and other processes as well. Its usage decreases the number of experiments, time, and material resources. Furthermore, the analysis performed on the results of such experiments is easily realized and the experimental errors are minimized. Statistical methods measure the effects of change in operating variables and their mutual interactions on the process. RSM is one of the important methods in design of experiments. It is a collection of mathematical and statistical techniques that are useful for modeling and analysis of problems in which output or response is influenced by several variables and the goal is to find the correlation between the response and the variables. It can be used for optimizing the re- sponse. It is an empirical model-developing technique devoted to the evaluation of relations existing between a group of controlled experimental factors and the observed results of one or more selected criteria. A prior knowledge of the process is thus necessary to achieve a realistic model [29]. In the present study, RSM's Box-Behnken experimental design with three factors, three levels, and 17runs arc selected. The machine parameters used and their levels arc given in Table 1, and the Box-Behnken design matrix are shown in Table 2. The experimental design consists of a set of points lying at the midpoint of each edge and replicated center point of a multidimensional cube. The mathematical model is then developed that illustrates the relationship between the process variables and response by using the application of RSM. In the RSM, the quantitative form of relationship between the output response and input variables can be represented as follows. Y=f (A, B, C) (1) Where A, B, and C are input parameters and Y is the output response which is required to be optimized. Here, it is assumed that the independent variables (input parameters) are continuous and controllable by experiments with negligible errors. RSM creates second order quadratic model of the form: Y = 6o+ b, A +hB + b} C + b, A2 + bnB2 (2) + b»C2 + baAB + buAC + bnBC
- 5. Nilesh Awate and Dr. D. J. Tidke http://www.iaeme.com/IJMET/index.asp 324 editor@iaeme.com Table 1 Input parameters and their levels Name of the variables Range Code (Xi) Levels Intervals Xi1 Xi2 Xi3 -1 0 +1 Blade angle Degree 100-110 X1 100 105 110 05 Impact load (N) 10-30 X2 10 20 30 10 Rotating Speed in RPM 1600- 2000 X3 1600 1800 2000 200 Where Y is the dependent variable; A, B, and C are the independent variables; and b are the coefficients of linear, quadratic, and interaction of input parameters A, B, and C. The term b0 is the intercept term; b, b2, and b3 are the liner terms; b, &22> ar >d ^33 are the squared terms; and bi, bit and 623 are the interaction terms between the independent/input variables. All the b values have been determined, on the basis of least squares method [30, 31]. The actual values of variables at given coded levels are calculated as below, Yaij=Xij x Vi Ya3 . (4.1) Where, I - 1 to 4 numbers of variables J - 1 to 3 numbers of levels - actual value of ith variable at given jth coded level - coded value of ith variable at given jth coded level - interval of variation for ith var Table 1: Treatments combinations required for design of experiment of straw cutting mechanisms in CRD design for response surface modeling BBD Matrix Expt. No run X1 X2 X3 Blade angel, (Degree) impact Load, N Speed, (RPM) 1 14 -1 -1 0 100 10 1800 2 13 1 -1 0 110 10 1800 3 3 -1 1 0 100 30 1800 4 2 1 1 0 110 30 1800 5 12 -1 0 -1 100 20 1600 6 8 1 0 -1 110 20 1600 7 6 -1 0 1 100 20 2000 8 16 1 0 1 110 20 2000 9 11 0 -1 -1 105 10 1600 10 4 0 1 -1 105 30 1600 11 17 0 -1 1 105 10 2000 12 5 0 1 1 105 30 2000 13 10 0 0 0 105 20 1800 14 1 0 0 0 105 20 1800 15 9 0 0 0 105 20 1800 16 15 0 0 0 105 20 1800 17 7 0 0 0 105 20 1800
- 6. Modeling and Optimization of a Mobile Crop Residue Disintegrator http://www.iaeme.com/IJMET/index.asp 325 editor@iaeme.com The experiments of cutting blade were conducted according to CRD design (Table 4.6) and Response surface modeling (RSM) was applied to the experimental data using commercial statistical package, Design expert-version 10.0.2 (Statease Inc., Minneapolis, USA). The relative effect of the variables (Blade angle, Impact Load, drum speed) on the responses was studied and the mobile disintegrator parameters were optimized in order to get best straw cutting mechanism. The responses studied were actual impact load, cutting efficiency, collection efficiency. The following second order polynomial response surface model (Eq. 4.2) was fitted to each of the response variable (Yk) with the independent variables (Xi). = + Σ 4 =1+Σ 24 =1+ Σ 4 ≠1=1 (4.2) Where bk0, bki, bkiiand bkijare the constant, linear, quadratic and cross product regression coefficients, respectively and Xi are the coded independent variables of X1, X2, X3. 3. PROCEDURE Testing of a Crop Residue Mobile di Integrator Machine in Select Filed The procedure adopted for testing of a crop residue Mobile disintegrator Machine is given below. The experiment test plot was 25*25m. Each observation was replicated taken as five time .Operation of Testing of A crop residue mobile disintegrator machine selected cotton plot was prepared for testing the A crop residue mobile disintegrator machine as per the procedure given above and details of testing is discussed in the section above section According to BBD firstly select different plot of different cotton variety with different moisture content. To measure Height of plant by the help of measuring tape, Also measure the plot by 25m x25mm In the selected plot take a sample of cotton stalk for the measurement of moisture content in the specific plot. To prepared various size of blade with different angel like 1000 , 1050 , 1100. .In the completion of first trial the time was recorded, live cutting speed was recorded, level of fuel after trail check it. No of plant cut is also noted to determination of cutting efficiency. The collected crop residue in the bag was collected and mark it Trial one sample. The plot no one testing is completed and collects all data for all different blade angle and speed according toBBD The collected sample was mark and check it weight and size after sampling. Table 2 ANOVAs for cutting force SL no Cutting force Cutting efficiency Collection efficacy Model( S) 0.001# 0.003# 0.004# Std. Dev. 0.53 .49 1.23 Mean 10.09 96.37 77.12 R-Squared 0.94 .96 .92 Adj R-Squared 0.86 .92 .82 Lack of Fit( NS) 0.12 @ 0.0158@ 0065@ #Significant @: Non Significant
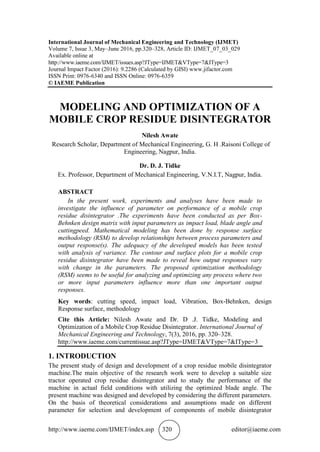
- 7. Nilesh Awate and Dr. D. J. Tidke http://www.iaeme.com/IJMET/index.asp 326 editor@iaeme.com Design-Expert® Software Factor Coding: Actual Actual force (N) Design points above predicted value Design points below predicted value 12.95 7.92 X1 = A: blade angle X2 = B: Impact Load Actual Factor C: Speed = 1800 10 15 20 25 30 100 102 104 106 108 110 7 8 9 10 11 12 13 14 Actualforce(N) A: blade angle (Degree) B: Impact Load (N) Design-Expert® Software Factor Coding: Actual Cutting Efficiency (%) Design points above predicted value Design points below predicted value 98.38 93.12 X1 = A: blade angle X2 = B: Impact Load Actual Factor C: Speed = 1800 10 15 20 25 30 100 102 104 106 108 110 93 94 95 96 97 98 99 CuttingEfficiency(%) A: blade angle (Degree)B: Impact Load (N) Design-Expert® Software Factor Coding: Actual Collection Efficiency (%) Design points above predicted value Design points below predicted value 82.08 73.18 X1 = A: blade angle X2 = B: Impact Load Actual Factor C: Speed = 1800 10 15 20 25 30 100 102 104 106 108 110 72 74 76 78 80 82 84 CollectionEfficiency(%) A: blade angle (Degree)B: Impact Load (N) Figure 1 Effect of Impact load and Blade angle on Cutting force Figure 2 Effect of Impact load and Blade angle on Cutting efficiency Figure 3 Effect of Impact load and Blade angle on Cutting efficiency
- 8. Modeling and Optimization of a Mobile Crop Residue Disintegrator http://www.iaeme.com/IJMET/index.asp 327 editor@iaeme.com 4. RESULTS AND ANALYSIS 4.1. Analysis of Variance Regression analysis and analysis of variance (ANOVA) were conducted for fitting the models represented examines the statistical significance of the model terms. The adequacy of the models were determined using model analysis, lack of fit test and R2 (coefficient of determination) analysis. The lack of fit is a measure of failure of a model to represent data in the experiment domain at which at which points were not included in the regression or variations in the models cannot be accounted for by random error. If there is a significant lack of fit, as indicated by a low probability value, the response predictor is discarded. The R2 is defined as the ratio of the explained variation to the total variation and is a measure of the degree of fit. Coefficient of variation (CV) indicates the relative dispersion of the experimental points from the prediction of the model. Response surfaces were generated with the help of commercial statistical package, Design Expert-version 10.0.2. The results of this analysis are shown in Table 5 and in Table 6 It is known that if the P value (significance probability value) is less than 0.05, the corresponding parameter or variable is considered to be "significant" in influencing the output response, at 95 % confidence level [29].From Table 5, it is evident that blade angle (A) and its square combination (A2 ) are "most significant" in the context of the response: cutting speed , as corresponding P values are zero. The square combination of work speed (C2 ) is also very significant as its P value is very close to zero. And, individual effect of impact load (B) and its square combination (B2 ) are found to be significant as relevant P values are less than 0,05. The cutting speed (C) and interactions like infeed-longitudinal feed (A x B), infeed-work speed (A x C), and longitudinal feed-work speed (B x C) do not have significant effect on vibration as their P values are more than 0.05. 4.2. Response Surface Plots Response surface plots arc drawn based on the developed model equations for cutting force , cutting efficiency, and collection efficiency .These plots (and also the earlier contour plots) arc generated for various combinations of the input parameters and different hold values of the third parameter(s). Few of the response surface plots are given in Figs. 8, 9, and 10 for vibration and in Figs. 11, 12, and 13 for surface roughness. Since each model has three variables, one 5. CONCLUSIONS The following conclusions are made from the present study The use of Design Expert 10.0.2 software for experimental design with the factorial Box-Behnken design matrices method was suitable for optimized solution of the blade angle. This provides the optimized solution of the blade angle of 1050 with an impact load of 20 N at a speed of 1800 rpm. This reduces the efforts required in vast testing procedures with utilizing the all type of blade on the large field. The software generated optimum conditions of independent variables with the predicted values of responses. Solution number one, having the maximum desirability value (0.92) with minimum blade angle of 9.2kg/ha and 98.207% cutting efficiency and maximum collection efficiency was selected as the optimum conditions for mobile disintegrator Contour and surface plots for cutting force, cutting efficiency and collection efficiency of mobile disintegrator machine show that the interactions of input parameters arc prominent for both the responses. These plots may help to predict response(s) at some selected parametric combination(s).
- 9. Nilesh Awate and Dr. D. J. Tidke http://www.iaeme.com/IJMET/index.asp 328 editor@iaeme.com The above optimum parametric combination has been validated by confirmatory tests. REFERENCE [1] Oguz Perincek, Metin Colak (2013) Use of Experimental Box-Behnken Design for the Estimation of Interactions Between Harmonic Currents Produced by Single Phase Loads International Journal of Engineering Research and Applications (IJERA) ISSN: 2248-9622 www.ijera.com Vol. 3, Issue 2, March - April 2013, pp.158-165 158 | P a g e [2] Guowei Shu*, Chunji Dai, He Chen and Xu Wang (2013)Application of Box- Behnken design in optimization for crude polysaccharides from fruits of Tribulus terristris L. Journal of Chemical and Pharmaceutical Research, 2013, 5(10):342- 350Research Article ISSN : 0975-7384 [3] Sergio Luis Costa Ferreira a, Roy Edward Bruns b, Erik Galv˜ao Paranhos da Silva a,Walter Nei Lopes dos Santos c, Cristina Maria Quintella a, Jorge Mauricio David a, Jailson Bittencourt de Andrade a, Marcia Cristina Breitkreitz b,Isabel Cristina Sales Fontes Jardim b, Benicio Barros Neto d(2007) Statistical designs and response surface techniques for the optimization of chromatographic systems, Journal of Chromatography A, 1158 (2007) 2–14 [4] Rodrapati ramesh, pal pradip kumar, Bandyopadyay Ashis, (2015) Modeling and optimization of machining parameters in cylindrical grinding process. , International journal of manufacturing technology DOI 10.2007/S00170-015- 7500 [5] Myalowenkosi Sabela I., Kanchi Suvardhan *, Ayyappa Bathinapatla, Bisetty Krishna(2014) [6] A Box-Behnken Design and Response Surface Approach for the Simultaneous Determination of Chromium (III) and (VI) Using Catalytic Differential Pulse Polarography international journal of electrochemical science, Int. J. Electrochem. Sci., 9 (2014) 6751 - 6764 [7] Received: 5 August 2014 / Accepted: 12 September 2014 / Published: 29 September 2014 [8] Montgomery DC (2001) Design and analysis of experiments. Wiley, New York Khayet M, Seman MNA, I lilal N (2010) Response surface modeling and optimization of composite nano-filtration modified membranes. J Memb Sci 349(1-2):! 13-122 [9] Cclep O, Asian N. Alp I, Tasdemir G (2011) Optimization of some parameters of stirred mill for ultra-fine grinding of refractory Au/Ag ores. Powder Technol 208(1):121-127.