Create Eye-Catching Infographics With These Top Tools
•
0 likes•49 views

Looking for an efficient tool to design infographics for your website? Then this blog is a must-read for you as it provides you the most user-friendly tools to design you infographics as well as social media posts for your business.

Recommended
More Related Content
What's hot
What's hot (20)
Similar to Create Eye-Catching Infographics With These Top Tools
Similar to Create Eye-Catching Infographics With These Top Tools (20)
More from HTS Hosting
More from HTS Hosting (20)
Recently uploaded
Recently uploaded (20)
Create Eye-Catching Infographics With These Top Tools
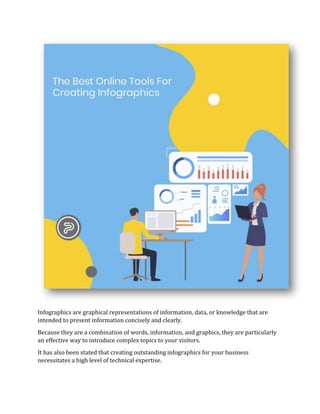
- 1. Infographics are graphical representations of information, data, or knowledge that are intended to present information concisely and clearly. Because they are a combination of words, information, and graphics, they are particularly an effective way to introduce complex topics to your visitors. It has also been stated that creating outstanding infographics for your business necessitates a high level of technical expertise.
- 2. However, these issues have now been addressed by a plethora of tools, many of which offer free subscriptions in addition to the paid ones. In this article, we will discuss infographics and some of the key elements that contribute to an outstanding design. Also, we will cover some tools for creating beautiful infographics. Let’s get started one by one. Why Do Infographics Work? Infographics are graphical representations of data that usually address a single topic and divide it into multiple sections. Many blogs and websites use graphics to emphasize specific points, whereas infographics can be understood with little or no accompanying text. In addition, they also have the potential to generate leads and conversions. Moreover, they offer few distinct advantages such as: Infographics allow you to tackle complex topics in an engaging and easy to understand manner. They can be used to provide a lot of information. Also, users prefer to read infographics more, instead of text. Although there are numerous tools for creating infographics, it is essential to have a clear idea of the topics you want to cover to tell a compelling story in a visual format. Furthermore, a good sense of design is required to know, how to divide sections and what visual aids to include. It is best to keep the visuals simple so that every user understands what you are trying to convey using infographics. Now, let’s move on to the tools that can assist you in creating eye-catching infographics for your website. Tools to Create Infographics for Your Website As you don’t have to be a developer to get your website up and running. Similarly, you don’t have to be a graphic designer to create a compelling infographic. All you have to do is choose the right tool to assist you to achieve your design goals. Here are our top picks for creating infographics for your website: 1. Canva:
- 3. A simple and easy to use interface which offers various tools for designing your infographic It is a tool that allows you to create a variety of professional designs using an easy-to-use interface. It’s ideal for creating business cards, presentations, social media posts, and infographics. As a result, it is one of the favorite designing tools among bloggers and website owners. To help you get started, Canva offers a variety of infographic templates to choose from. You can then use a library of icons, text, effects, and other elements to customize these templates as per your requirement and place them wherever you want. This tool is perfect to start if you have no experience with web design. It’s easy to use and gives you a lot of flexibility when it comes to experimenting with custom graphics. 2. Visme:
- 4. Visme is a versatile platform that allows users of all skill levels to create a wide range of engaging visuals, such as presentations, banners, animation videos, interactive charts, and so on. You can begin creating your infographic with a template, but in Visme, a pre-built content block feature allows you to make the process even easier. Moreover, when it comes to data visualization, Visme delivers high professional results. So, if you need to create a professional-looking infographic quickly, Visme’s block system feature can help. 3. DesignBold:
- 5. DesignBold, like Canva, allows you to create a variety of web-based graphics, such as social media posts, e-cards, and infographics. However, its interface is more akin to an app, making it an excellent choice if you enjoy using your tablet or other mobile devices for design work. Moreover, it offers hundreds of elements that you can add to your infographic. So, if you want to choose between Canva and DesignBold, we recommend you to try both the tools before deciding on one. 4. Venngage:
- 6. Venngage is very similar to other tools and provides training in simple steps, which typically involves selecting a template, adding visuals, and customizing. Venngage allows you to create a wide range of visuals, such as posters, charts, and other eye-catching graphics. 5. Infogram
- 7. Infogram has an extremely appealing and inviting interface that incorporates a wide range of contemporary modern graphics, so if that fits your style and brand guidelines, you should give it a try. Conclusion Infographics are one of the most effective tools for presenting complex subjects in a way that readers find interesting. They are especially useful for conveying numerical data. So, with the amazing tools listed above, creating professional-looking infographics is much easier.