SlideShare a Scribd company logo
1 of 44
Performance and duration differences between online
and paper–pencil tests
Alper Bayazit • Petek Aşkar
Received: 10 September 2009 / Revised: 2 August 2011 /
Accepted: 16 September 2011 / Published online: 9 October
2011
� Education Research Institute, Seoul National University,
Seoul, Korea 2011
Abstract Digital technologies have been used for mea-
surement purposes and whether the test medium influences
the user is an important issue. The aim of this study is to
investigate students’ performances and duration differences
between online and paper–pencil tests. An online testing tool
was developed and administered in order to determine the
differences between the traditional paper–pencil tests and
online tests concerning students’ performances and the
duration on tests. This tool enables to add questions that
utilize an online database and which are in the form of
multiple choice (with 5 or 4 options), true–false, matching,
filling in the blanks, with multiple answers, with short
answers, with long answers, and it also enables to prepare
tests and to turn them into paper–pencil test mode. Perfor-
mance test was applied with both online and paper–pencil
modes on junior students at one of the universities in Turkey.
Besides, the online testing tool developed within the context
of the study was evaluated by instructors with respect to
usability, relevance to the purpose and design. Instructor and
student questionnaires are developed to determine the
opinions on the online testing tool and online tests. Results
showed that there was no significant differences between the
performances on online and paper–pencil tests. On the other
hand, the time they spent on the online test has been longer
than the time they spent on paper–pencil test. Students found
the online testing tool easy to use and stated that online test
medium is more comfortable than paper–pencil tests.
However, they complained about external noises, tiredness,
and focusing problems regarding the online examination
mediums. Generally, instructors have also appreciated the
online testing tool’s design and they agree on the fact that it
serves for its purposes.
Keywords Paper–pencil tests � Online tests �
Performance and duration differences
Introduction
It is crucial that evaluation reflect a student’s performance.
However, there might be mistakes with the measurement
within the process of evaluation. These mistakes may
source from the measurement tool. Thus, the media in
which the measurement tool is applied is also important.
Digital technologies have been used not only for learning
but also for measurement purposes. However, it has been a
matter of question to what extend this digital environment
will affect a student’s performance.
In the literature of the online tests, it is possible to see
examples of various studies making comparisons between
different types of tests (paper–pencil tests and online tests),
duration, and the decisive performance. However, incoher-
ent results have been obtained from these studies. This may
result from more than one reason. First of all, students may
have different levels of computer literacy. Secondly, the
computerized tests may be less free of random mistakes than
paper–pencil tests. Computerized tests could especially
decrease the possibility of mistakenly selecting another
option than the desired one among multiple choice items
A. Bayazit (&) � P. Aşkar
Department of Computers and Instructional Technology
Education, Hacettepe University, Beytepe 06530,
Ankara, Turkey
e-mail: [email protected]
P. Aşkar
Faculty of Education, TED University, Kocatepe 06420,
Ankara, Turkey
e-mail: [email protected]
123
Asia Pacific Educ. Rev. (2012) 13:219–226
DOI 10.1007/s12564-011-9190-9
(Bernt and Bugbee 1990). In addition, some items may look
simpler or more complex in computerized tests than how
they appear on the paper–pencil tests (Bernt and Bugbee
1990). Moreover, CPU and Internet connection speeds at the
time these studies were made, user interface of the online test
tools, and students’ degree of readiness might have affected
the results. Researches have shown that testing tool designs
affect the duration and the student’s scores.
The aims of this study are to determine whether there is
a significant difference in student performance and dura-
tion between online tests and paper–pencil tests and to
collect students’ opinions about the online test. A different
testing tool will be developed in the study, grades obtained
and times spent by students in different testing environ-
ments will be measured and instructors’ and students’
opinions about the online testing tool will be asked. The
results to be obtained may give clues about the nature of
the evaluation tools to be utilized in the future and yield
ideas for the future studies on how the best evaluation
environment for the students could be achieved.
Review of the literature
Whiting and Kline’s study (2009) examined the equiva-
lency of computer and conventional versions of the Test of
Workplace Essential Skills (TOWES), a test of adult lit-
eracy skills in Reading Text, Document Use, and Numer-
acy. Seventy-three college students completed the
computer version, and their scores were compared with
those who had taken the test in the conventional paper-and-
pencil mode. Scores for the two groups for all three sub-
scales were equivalent based on their means and variances.
Rank order equivalency was demonstrated for two of the
three TOWES subscales (Reading Text and Document
Use). Additionally, participants rated the computer version
of the test as easy to use.
Puhan et al. (2007) evaluated the comparability of two
versions of a certification test: a paper-and-pencil test
(PPT) and computer-based test (CBT). Results indicated
that the effect sizes were small (d  0.20) and not statis-
tically significant (p [ 0.05), suggesting no substantial
difference between the two test versions. Moreover, DIF
analysis revealed that reading and mathematics items were
comparable for both versions. However, three writing items
were flagged for DIF. Substantive reviews failed to identify
format differences that could explain the performance
differences, so the causes of DIF could not be identified.
Bodmann and Robinson (2004) studied effects of dif-
ferent test types on the speed and scores. This study is
composed of two experimental researches. The first
experimental research aims to specify differences in scores
and duration obtained from paper–pencil tests and
computerized tests. Fifty-five students having taken the
education psychology class were randomly divided into
two experimental groups. A question is shown on the
system screen. After selecting the correct option, a student
saves the answer and cannot alter his/her selection or return
to the question afterward. The same questions were asked
in the paper–pencil test with the same sequence. On the
contrary, 6 questions were printed on each page. Twenty-
eight students took the computerized test, whereas 27 of
them took it in the classical paper–pencil fashion. A
dependant t test was applied on the test times and the test
scores. The paper–pencil test lasted 4 min longer than the
computerized test, whereas no difference was recorded
between the test scores. The first experiment proved that
the type of test does not affect the grade. On the other hand,
it was observed that the type of test does have an effect on
the speed. The reason why this time is longer at the paper–
pencil test may result from its flexibility. Being unable to
return to previous questions or altering the answers in the
computerized test can be shown as the reason why it was
completed at a shorter time.
Wang et al. (2004) developed a web-based evaluation
and test analysis system in their study and they evaluated
this tool. The tool they developed consists the triple-A
(Assembling, Administering, Appraising) model. Question
banks and tests are developed in the assembling stage. In
the administration stage, test items and their options ran-
domly disperse the test into fields, personal ID numbers
and passwords are produced for the application of the test
via web, and test data and test scores are collected and
recorded. The collected test data are analyzed and turned
into statistical reports in the appraising stage. The tool is
able to perform item, test, and concept error analyses. The
statistical calculations of the test can also be made in this
extent.
Two studies have been made in order to evaluate the
possible benefits of the WATA system on the teacher
training. These studies enclose examining in-service
teachers’ level of satisfaction from the WATA system and
researching the attitudes of teachers toward the appraising
before the service. Forty-seven teachers from 39 different
schools attended the first study in order to determine the
user satisfaction of the system. As a result of the applied
questionnaire, it was found that users were highly satisfied
from the functions of the WATA tool. The second study
aimed to determine the benefits of the WATA system. As a
result, the attitudes of teachers toward the evaluation before
the service have been positive and they got acquainted with
the appraising process thanks to WATA system.
Cole and MacIsaac (2001) compared pencil–paper tests
and web-based tests in their study. FCI (Force Concept
Inventory), one of the standardized tools measuring a stu-
dent’s knowledge on conceptualized physics, was applied.
220 A. Bayazit, P. Aşkar
123
A total of 1,173 pre-test and 825 final-test were collected
from 1,313 students involved in the application. FCI scores
obtained by students were recorded as 15.25 in the pre-test
and 19.17 in the final-test over 30. 2 9 2 ANOVA (2 sex
and 2 types of test) was applied on the findings in order to
determine the effect of sex and test type on the scores
obtained. As a result, no significant difference was found
with respect to FCI type.
A study performed by Bernt and Bugbee (1988) showed
that students complete computerized tests at significantly
longer periods compared to paper–pencil tests. However,
no sign of any relation between the speed and student
performance was observed. Two hours was allocated for
100 items that would enable most students to complete
their tests before the time was over. On the other contrary,
only 2 among 161 paper–pencil test attendees failed to
complete the test due to time limitations. At the comput-
erized test, however, 47 of 70 attendees failed to complete
the test on time, whereas only 23 of them used the time
properly. The fact that tests could not be completed on time
may have sourced from reasons like being unfamiliar to
computers or being lack of any past experience in online
testing other than the inadequate time allocated for the test.
Russell (1999) examined students’ success in comput-
erized tests in one of his studies. The results proved that
students having keyboard skills below the average level
recorded lower success in computerized tests as well.
In one of their studies, Clariana and Wallace (2002)
found that sex and the degree of being familiar with com-
puters do not have any relation to the type of test but to the
acquaintance of the content. In some cases, the main reason
for the test-type effect could be the flexibility of the test
type. Some computerized tests are not as flexible as paper–
pencil tests. Some interfaces do not permit users to revise or
change their answers. This may affect a student’s success.
Until now, relevant studies in this field have made
comparisons between students’ success in different testing
environments and duration with respect to test types
(paper–pencil, online). However, incoherent results have
been obtained from these studies. This may result from
more than one reason. First of all, students may have dif-
ferent levels of knowledge as a computer operator. Sec-
ondly, the computerized tests may be less free of random
mistakes than paper–pencil tests. Computerized test could
especially decrease the possibility of mistakenly selecting
another option than the desired one among multiple choice
items (Bernt and Bugbee 1990). In addition, some items
may look simpler or more complex in computerized tests
than how they appear on the paper–pencil tests (Bernt and
Bugbee 1990).
This study’s aim is to investigate students’ performances
and duration differences between online and paper–pencil
tests.
Method
Participants
The research group consists of junior students studying at
the one of the biggest universities in Turkey. The aim of
the study was declared to the students, and 46 junior stu-
dents were volunteer for the research. The students ran-
domly assigned into two groups for the purpose of making
comparisons between student performances and duration at
online tests and paper–pencil tests. Twenty-three students
would take the test online via Internet, and 23 students
would take the test with the same questions in the form of
paper–pencil test. On the day of administration, however,
40 students attended the test and 17 of whom took the
online test and 23 took the paper–pencil test.
Attendees were applied a test containing questions on
the Autumn Term CEIT class. The test contained 30
questions in total with 6 multiple choice, 6 matching, 6
multiple answer, 6 short-answer, and 6 long-answer items.
Video and image containing questions were asked in the
test. Video-based questions in the online test were asked as
text version of the same question at the paper–pencil test.
Materials
Performance test
Reliability study of the performance test utilized in the
study was applied on the juniors who took the CEIT
Instructional Design Course within the academic years
2005–2006. The students were studying at the one of the
biggest universities in Turkey. Forty students attended the
reliability study in total. Sixty questions on the educational
design were asked to the attendees at the paper–pencil test,
and it was reduced to 30 as a result of the item analysis.
The calculated Cronbach a value of the 30 items to be
asked in the test was designated as 0.78.
A 30-item performance test was applied on the students at
the online and paper–pencil tests. The test contained 30 ques-
tions in total with 6 multiple choice, 6 matching, 6 multiple
answer, 6 short-answer, and 6 long-answer items. Paper–pencil
test has the same content with the online test, and questions in
the online test were printed out for the paper–pencil test with
the
same sequence without any alterations. Two video-containing
questions are included in the online test. Video-based questions
in the online test were asked as texts at the paper–pencil test
remaining loyal to the content of question.
Evaluation questionnaire for students
An evaluation questionnaire for students with 11 items was
prepared in order to collect students’ comments on online
Performance and duration differences 221
123
tests and the online testing tool. Seven items of the ques-
tionnaire were arranged in the form of 5 scales, and 4 items
were arranged as open-ended questions. ‘‘I agree’’ and ‘‘I
don’t agree’’ options were graded from 1 to 5 for each
question in the scale.
The scale was applied via Internet on the 17 students
taking the online test just after the finalization of the test. It
was rendered compulsory not to omit the items in the
questionnaire. Questions in the questionnaire consisted 5
different categories. These categories concerned, the
usability of the online measurement tool, advantages and
disadvantages of the online tests over paper–pencil tests,
negative and positive sides of the online test tool.
Evaluation questionnaire for instructors
An ‘‘evaluation questionnaire for instructors’’ with 14
items was prepared in order to determine the usability of
the testing test tool developed by the researcher. ‘‘I abso-
lutely agree’’ and ‘‘I never agree’’ options for the entire
items in the questionnaire were graded from 1 to 10 for
each question in the scale. The questionnaire was applied
on 5 instructors and 2 research assistants. It was rendered
compulsory not to omit the items in the questionnaire.
Questions in the questionnaire consisted 3 different
categories. These categories concerned the usability of the
online measurement tool, its appropriateness for the pur-
pose, and its interface design.
Online testing tool
An online testing tool was designed and developed within
the scope of research. Students’ questions and examination
tables are used in MySQL database, and PHP is used for
accessing to dataset. The features of this tool were deter-
mined regarding the aim of the study. The tool offers time
limitation, and it can store scores achieved by students.
Test results and the relevant duration can be listed, and
tests on the database can be printed out in the form of
paper–pencil test. It is possible to add multiple choice
questions (with 5 or options), matching questions, fill in the
blanks questions, true–false questions, questions with
multiple answers, questions with short or long answers, and
to make amendments on the available questions. Images,
videos, and audio files can be embedded into all questions,
and image files can be attached to the options of multiple
choice questions. It enables to add, erase, or alter students
and relevant information in the database. Thus, it is pos-
sible to produce tests using the available students and
questions in the database (Fig. 1, 2).
In the tool devised, students have to enter the test code,
number, and password when they need to display a test
formed by the educators or appraisers beforehand. Test
questions are displayed on students’ screen after the
required controls, and students’ answers are recorded to the
database. Test scores and performance data are displayed
when the test is completed. A feedback is provided by
displaying their own answers for each item in the test.
Fig. 1 List of multiple
questions screenshot
Fig. 2 Online test window
screenshot
222 A. Bayazit, P. Aşkar
123
Data analyses
Scores obtained by students in the test at multiple choices,
matching, and multiple answer questions were calculated by
the system. By making an evaluation via Internet as a feature
offered by the tool, the researcher graded short- and long-
answer questions. The starting and finishing times of the tests
were recorded in the database by the system. In this way,
scores achieved by students in the test and duration were
obtained from the test results option at the teacher’s opera-
tions interface of the testing tool. Grading the answers of
students taking the paper–pencil test was made by the
researcher by means of an answer key. Starting and finishing
times of the entire students were recorded by the test
supervisor for the purpose of calculating their duration.
Each question was esteemed to add 1 point in the grading
process. The evaluation was made over 30 points in total by
giving 1 point for each correct answer and 0 point for wrong or
omitted answers. Answers close to the correct answer in the
answer key were regarded as correct ignoring any spelling
errors while grading short- and long-answer questions.
Results of the evaluation questionnaire for students were
obtained from all 17 students who took the online test via
Internet. After the questionnaire results were acquired, it
was accepted that the ones selecting 3 were esteemed to be
hesitant; the ones selecting 1 and 2 signified a negative
opinion, whereas the ones selecting 4 and 5 represented a
positive opinion.
Results of the evaluation questionnaire for instructors were
obtained from 5 instructors and 2 research assistants who filled
the questionnaire via Internet. After the questionnaire results
were acquired, it was accepted that the ones selecting 5 and 6
were esteemed to be hesitant; the ones selecting 1, 2, 3, and 4
signified a negative opinion, whereas the ones selecting 7, 8, 9,
and 10 represented a positive opinion.
Results
Comparisons between online tests and paper–pencil
tests
A comparison between online tests and paper–pencil tests
with respect to student performance
Kolmogorov–Smirnov test was applied in order to deter-
mine the distribution of students’ scores achieved in the
paper–pencil tests. Consequently, the p value was found to
be 0.999 proving that the distribution of scores achieved in
the paper–pencil tests exhibited a normal distribution.
Kolmogorov–Smirnov test was also applied in order to
determine whether the distribution of scores achieved in
the online test was normal. Consequently, the p value was
found to be 0.934 proving that the distribution of scores
achieved in the online tests also exhibited a normal
distribution.
Statistics on the test scores achieved by students who
took the online test or the paper–pencil test are as follows
(Table 1):
The average of the scores achieved by the 17 students
taking the online test is 9.53. On the other hand, the
average of the scores achieved by the 23 students taking the
paper–pencil test is 10.74. The t value between the inde-
pendent groups is 0.99, and the p value is 0.324. According
to this, there is not a significant difference in terms of
students’ average scores between the online test and the
paper–pencil test.
A comparison between online tests and paper–pencil tests
with respect to duration
After examining the duration of the paper–pencil test by
Kolmogorov–Smirnov test, the p value was found to be
0.318. When the duration of the online test was examined,
the p value was found to be 0.741. According to these
results, duration for the students at both the online test and
the paper–pencil test is distributed normally.
Statistics on the duration spent by students who took the
online test or the paper–pencil test are as follows (Table 2):
The average time spent by 17 students taking the online
test was found to be 40.53 min. On the other hand, the
average time spent by the 23 students taking the paper–
pencil test was found to be 34.26 min. The t value between
the independent groups is 2.61, and the p value is 0.013.
According to this, there is a significant difference in terms
of duration between the online test and the paper–pencil
tests. The online test was completed at a longer time
compared to the paper–pencil test.
Students’ opinions about the online testing tool and online
tests
Majority of the 17 students attending the study noted that
they did not have difficulty in using the tool and that the
Table 1 Statistics on the scores achieved at the online test and
the paper–pencil test
Performance Medium Number of students Average SD SD of the
measurement p t
Online test 17 9.53 3.710 0.900 0.324 0.99
Paper–pencil test 23 10.74 3.840 0.801
Performance and duration differences 223
123
tool had a user friendly interface, ergonomic design, and
enabled them to answer the questions with ease by clicking
with mouse or typing in keyboard. The students who
enjoyed the tool’s design mentioned that it was easy to
understand and anyone could use it. The positive features
found by the online test attendees in online tests are as
follows (Table 3):
• Being more relaxed at the online testing environment
without feeling they are attending a test,
• Having no such problems like consuming pencil tips or
the need for a new paper which ensures preventing
paper consumption as well,
• Altering or erasing the answers with ease,
• Learning the test results just after the test thereby
ensuring a feedback,
• Offering a funnier medium in terms of visuality
compared to paper–pencil tests.
Students also noted some disadvantages of the online
tests along with its advantages. In students’ opinions, some
disadvantages of the online tests are as follows:
• Having difficulty in reading the questions on the screen
and having tired eyes,
• The fact that typing long answers on the keyboard is
difficult,
• Disturbing noises coming from computer’s keyboard,
mouse, and fan,
• Losing motivation and time due to disturbance caused
by the screen and noises coming from computer,
Occasional distractions from questions compared to
paper–pencil tests owing to the relaxed atmosphere at the
online tests and lowered stress levels.
They also emphasized another advantage of the system
as learning the test results just after the test thereby
ensuring a feedback. Some students think that the system is
not boring and offers a funny environment whereby sim-
plifying to answer the questions.
A disadvantage of the system was noted by students as
being unable to see which questions they omitted and
remaining lack of feedback upon saving the answers on
whether they were actually saved. Students also stated that
they did not like the feature of rendering an entire question
wrong due to a single mistake in multiple answers and
matching questions. They thought that the grading should
be made based on the true items in these questions.
Instructors’ opinions about the online testing tool
and online tests
Instructors participating in the study remained hesitant
about whether too many clicking is required in the testing
tool to perform a single operation. They remained hesitant,
nevertheless, they stated a positive opinion on whether the
help section contained examples and showed how to do the
operations step by step simply but clearly. All of the
Instructors agreed on the fact that the tool was easy to use
and they disagreed the idea that a constant technical
assistant was required using the tool. Besides, they never
agreed the idea that they had difficulty in completing a
desired operation while using it. The Instructors did not
have a consensus on the idea that they were able to elim-
inate any mistakes quickly and easily while using the tool.
Four Instructors stated a positive opinion on this matter,
whereas two of them stated a negative opinion.
In general, Instructors participating in the study main-
tained that the tool was functioning without any errors;
however, one of the Instructors stated a negative opinion on
that. The majority thinks that the testing tool serves for the
purpose satisfactorily. Besides, they noted that they were
Table 2 Statistics on the duration at the online test and the
paper–pencil test
Medium Number of students Average SD SD of the
measurement p t
Time Online test 17 40.53 7.559 1.833 0.013 2.61
Paper–pencil test 23 34.26 7.479 1.559
Table 3 Distribution of the answers in the questionnaire for
students
Items 1 2 3 4 5 Average
I feel more relaxed at online tests compared to paper–pencil
tests 2 6 5 2 2 2.76
I prefer online tests to paper–pencil tests 2 4 6 2 3 3.00
I think the testing tool was easy to use 0 1 0 3 13 4.65
Questions at the online test were more distracting compared to
the paper–pencil test 3 4 2 4 4 3.12
I think online testing environments have more advantages
compared to paper–pencil testing environments 2 2 6 6 1 3.12
The online testing tool made me spend more time on questions 6
0 3 4 4 3.00
I would advise the online testing tool to my friends 3 2 2 5 5
3.41
224 A. Bayazit, P. Aşkar
123
willing to use the devised online testing tool in their
classes.
It is not generally agreed that the testing tool does not
offer a coherent design on its different pages. Similarly, the
majority does not agree that colors used in the design are
not coherent. Except the two who remained hesitant, all of
the Instructors did not agree on the idea that texts on the
testing tool’s pages were unreadable. The idea that a clear
language was used on the testing tool’s interface was
supported by all of the Instructors, whereas two of them
declared a negative opinion on that. None of the Instructors
agreed on the idea that error messages could not express
what is to be done clearly.
Discussion
This study aimed to compare online tests and paper–pencil
tests with respect to student performance and duration. An
online testing tool was developed by the researcher for this
purpose. The tool enables to add students and eight dif-
ferent types of questions to the database and make listing,
editing, and erasing operations on this data. It is possible to
create tests with customizable duration and dates using the
questions and students added to the database. These tests
can be printed out as paper–pencil tests. The testing tool
used in the study is different from the WATA system
developed by Wang et al. (2004) in enabling different types
of questions. Whereas the WATA system only permits
multiple choice questions with five options, the tool
devised in the study enables fill in the blanks, matching,
multiple answer, short- and long-answer questions. It is
also possible to grade interpretative questions on teacher’s
operations interface of the tool. Teachers can make a list of
the open-ended questions and students’ answers through
their administration panel. So they can evaluate the
answers without seeing the names of the students. This is
one of the key features distinguishing the tool from the
other testing tools. Similarly, web-based ActiveInk course
management system developed by Bodmann and Robinson
(2004) to compare students’ scores and duration contains
only multiple choice questions. Another feature of the
devised testing tool is its ability to enable questions with
multimedia content (video, audio, and image).
In general, student performance at the computerized test
is as good as their performance at the paper–pencil test
(Bernt and Bugbee 1990). At the end of the study, no
significant difference has been found between scores
obtained by students at the online test and the paper–pencil
test. Thus, the study has been parallel to Bodmann and
Robinson (2004) study and Cole and MacIsaac’s (2001)
study in terms of student’s scores to remain at the same
levels in different testing environments. Nevertheless, a
different result was obtained considering the speed. It was
found that the computerized test was completed 4 min
earlier in Bodmann and Robinson (2004) study, whereas it
was completed 6 min later in this study. This result is in
line with Bernt and Bugbee’s (1988) result proving that
computerized tests are completed at longer periods. The
reason why students completed the online test at a longer
time may be a result of being unfamiliar to the testing tool,
because the students were introduced to the online testing
tool’s interface for the first time on the day of application.
They did not have a chance to make practice with the tool
before the day of application. Although having noted on
the questionnaire that they found the online testing tool
easy to use, the time required by students for getting
accustomed to the tool may be the reason why students
completed the test with delay. According to Clariana and
Wallace (2002), if students were accustomed to comput-
erized tests as much as they are to the paper–pencil tests,
the effect of the applied test type would be less or it would
diminish. In such studies, applying devised tools on stu-
dents beforehand, thereby increasing the level of acquain-
tance is an element that can affect the results.
Arranging the items could also affect a student’s per-
formance on a relevant item (Clariana and Wallace 2002).
In order to eliminate this effect, questions at the online and
paper–pencil tests were asked in the same sequence using
the same items. However, some items are easy or hard to
distinguish at computerized tests compared to paper–pencil
tests (Bernt and Bugbee 1990). Another opinion supporting
it is that computerized tests and paper–pencil tests will not
be identical even if they have the same items. Thus, stu-
dents may have different results at computerized tests and
paper–pencil tests (Bernt and Bugbee 1990). In this study,
no significant difference was found between students’
scores at different environments; however, the idea that
tests are not identical even if they have the same items may
be the reason to the significant difference in duration.
Flexibility is another element affecting the speed. At
inflexible computerized tests, it is not possible to return to,
revise, or alter an answered question (Bodmann and Rob-
inson 2004). According to this definition, the online testing
tool utilized in the study is flexible. It is possible for stu-
dents to return to any question or change their answers. In
Bodmann and Robinson’s study (2004), the inflexible
computerized test was completed at a shorter time com-
pared to the flexible computerized test and the paper–pencil
test. If an inflexible online testing tool was used in this
study too, the speed could be different as it would be
impossible to return to previous questions, and the online
test could be completed at a shorter time. Nevertheless, it
should be noted that an inflexible computerized test being
unable to revise the answers or change any wrong answers
could affect student performance. In this study, the online
Performance and duration differences 225
123
test was completed at approximately 40.53 min, whereas
the paper–pencil test was completed at about 34.26 min.
Totally, 81.06 s was spent for per question at the online
test, while this period was 68.52 s for the paper–pencil test.
It is seen that reading on a computer’s screen takes
longer compared to reading printed texts (Kruk and Muter
1984). Similarly in this study, the reason why the online
test lasted longer compared to the paper test may be the
fact that questions were read on a computer screen at the
online test. Furthermore, it requires more effort to complete
a computerized test compared to paper–pencil tests (Noyes
et al. 2004). While designing such studies, video-contain-
ing questions should be carefully arranged considering the
image and sound quality. File capacity is another issue.
Loading times can be longer especially at computers with
low connection speeds in case such files have higher file
capacities. This could eventually increase the duration.
Another physical distinction between the paper–pencil
tests and web-based tests is the difference in the physical
dimensions of the presentation area. The amount of infor-
mation which could be fitted easily on a computer’s screen
is only one-third of the information that could be printed on
an ordinary sheet of paper. A student can easily scan the
entire questions on the paper and reach following questions
quickly just by turning pages. That would not be possible at
computerized tests using screens on which just a single
item can be displayed (Clariana and Wallace 2002). Cor-
respondingly, only one item can be displayed on the screen
of the testing tool used in the study. Students can view
questions using the navigation buttons or question buttons.
This could be shown as a reason to the delay in the duration
at the online test compared to the paper–pencil test.
Students noted some disadvantages of the online tests
along with its advantages. These are reading the questions
on the screen and having tired eyes, the fact that typing
long answers on the keyboard is difficult, disturbing noises
coming from computer’s keyboard, mouse and fan, and
losing motivation and time due to disturbance caused by
the screen. It is very critical to eliminate the problems of
online testing processes. The most important issue to
handle the disadvantages is the experience. Because stu-
dents use paper–pencil tests through their school life. Less
noisy computers as laptops should be used, and there
should be enough space between computers to confront
noise problem.
References
Bernt, F. M., & Bugbee, A. C. (1988). Your time is up! An
assessment
of time limits for American College students. Examination
Research Report No. 88–1. Bryn Mawr, PA: The American
College.
Bernt, F. M., & Bugbee, A. C., Jr. (1990). Factors influencing
student
resistance to computer administered testing. Journal of Research
on Computing in Education, 22(3), 265–275.
Bodmann, S. M., & Robinson, D. H. (2004). Speed and
performance
differences among computer-based and paper–pencil tests.
Journal of Educational Computing Research, 31(1), 51–60.
Clariana, R., & Wallace, P. (2002). Paper-based versus
computer-
based assessment: Key factors associated with the test mode
effect. Br J Educ Technol, 33(5), 593–602.
Cole, R. P., MacIsaac, D. (2001). A comparison of paper-based
and
web-based testing. (ERIC Document Reproduction Service No.
ED453224).
Kruk, R. S., & Muter, P. (1984). Reading continuous text on
video
screens. Human Factors, 26, 339–345.
Noyes, J., Garland, K., & Norris, L. (2004). Paper-based versus
computer-based: Is workload another test mode effect? British
Journal of Educational Technology, 35(1), 111–113.
Puhan. G., Boughton, K., Kim, S. (2007). Examining
differences in
examinee performance in paper and pencil and computerized
testing. Journal of Technology Learning, and Assessment, 6(3),
4–20. (ERIC Document Reproduction Service No: EJ838613).
Russell, M. (1999). Testing on computers: A follow up study
comparing performance on computer and on paper. Education
Policy Analysis Archives, 7, 20.
Wang, T. H., Wang, H., Wang, W. L., Huang, S. C., & Chen, S.
Y.
(2004). Web based assessment and test analyses (WATA)
system
development and evaluation. Journal of Computer Assisted
Learning, 20, 59–71.
Whiting, H., & Kline, T. J. B. (2009). Assessment of the
equivalence
of conventional versus computer administration of the test of
workplace essential skills. International Journal of Training and
Development, 10(4), 285–290. (ERIC Document Reproduction
Service No: EJ839769).
226 A. Bayazit, P. Aşkar
123
Performance and duration differences between online and paper-
-pencil testsAbstractIntroductionReview of the
literatureMethodParticipantsMaterialsPerformance
testEvaluation questionnaire for studentsEvaluation
questionnaire for instructorsOnline testing toolData
analysesResultsComparisons between online tests and paper--
pencil testsA comparison between online tests and paper--pencil
tests with respect to student performanceA comparison between
online tests and paper--pencil tests with respect to
durationStudents’ opinions about the online testing tool and
online testsInstructors’ opinions about the online testing tool
and online testsDiscussionReferences
Assignment 1
USE THE HARVARD REFERENCING SYSTEM
THROUGHOUT THE
REPORT
Problem 1 (25 pts)
The cost of 14 models of digitals cameras at a camera specialty
store during 2014 was as
follows:
340 450 450 280 220 340 290 370 400 310 340 430 270 380
1. Compute mean, median, mode, first and third quartile.
2. Compute the variance, standard deviation, range, interquartile
range, coefficient of
variation, standard error of the mean and Z scores.
3. Determine whether or not there are outliers? Explain.
4. Determine whether or not the data are skewed? If so, how?
5. Based on the previous results what conclusions can you reach
concerning the price of
digital cameras at a camera specialty store during 2014.
6. Construct a 90%, 95%, 99% confidence interval for the
population mean cost of digitals
cameras.
7. Interpret the meaning of each interval.
8. What assumption do you need to make about the population
of interest to construct the
confidence intervals?
Problem 2 (15 pts)
Consider the sample data for plants A, B, C & D of the above
company, which are
tabulated in table 1. Test whether the four means are equal at
the 5% level of significance.
Perform a test that will compare all 4 means at once. We are not
interested in pair-wise
comparisons at this stage. Please show all the steps in your
calculations.
Table 1:
A B C D
333 328 320 333
332 329 321 321
320 323 322 329
326 327 325 330
328 330 326 328
325 331 328 325
323 332 329 333
321 320 330 331
334 324 331 327
322 323 332
320 334
329
330
328
331
330
Problem 3 (30 pts)
Read the article (p. 221 – 225)
«Performance and duration differences between online and
paper–pencil tests» and
answer the questions below.
Part A.
1. Develop a 95% confidence interval using data from this
study.
2. Perform a hypothesis testing using data from this study.
(show all the the appropriate steps).
3. Suggest another statistical technique(s) for the purpose of
this study. Explain.
Part B.
For this study briefly describe how the researcher draw
conclusions from a sample about a
population. Try to be as analytic as possible and use the
comments bellow.
1. Determine (or define) the independent variable(s).
2. Determine (or define) the dependent variable(s).
3. Determine (or define) qualitative and quantitative variable(s).
4. Determine (or define) the sample and the population.
5. Describe the statistical method(s) being used and define
inferential statistics. Interpret the
meaning of p-value.

More Related Content

Similar to Performance and duration differences between onlineand paper.docx

Pre-service and In-service Teachers? Rubric Assessments of Mathem
Pre-service and In-service Teachers? Rubric Assessments of MathemPre-service and In-service Teachers? Rubric Assessments of Mathem
Pre-service and In-service Teachers? Rubric Assessments of MathemGrant Kuehl
 
Is It the Same? G Yamazaki
Is It the Same? G YamazakiIs It the Same? G Yamazaki
Is It the Same? G Yamazakiclickers2012
 
A COMPARATIVE ANALYSIS OF SELECTED STUDIES IN STUDENT PERFORMANCE PREDICTION
A COMPARATIVE ANALYSIS OF SELECTED STUDIES IN STUDENT PERFORMANCE PREDICTIONA COMPARATIVE ANALYSIS OF SELECTED STUDIES IN STUDENT PERFORMANCE PREDICTION
A COMPARATIVE ANALYSIS OF SELECTED STUDIES IN STUDENT PERFORMANCE PREDICTIONIJDKP
 
Analysis of pair Programming Effectiveness in Academic Environment
Analysis of pair Programming Effectiveness in Academic EnvironmentAnalysis of pair Programming Effectiveness in Academic Environment
Analysis of pair Programming Effectiveness in Academic Environmentijcnes
 
An Adaptive Approach for Subjective Answer Evaluation
An Adaptive Approach for Subjective Answer EvaluationAn Adaptive Approach for Subjective Answer Evaluation
An Adaptive Approach for Subjective Answer Evaluationvivatechijri
 
Convincing Faculty to Deliver Faculty Evaluations Online
Convincing Faculty to Deliver Faculty Evaluations OnlineConvincing Faculty to Deliver Faculty Evaluations Online
Convincing Faculty to Deliver Faculty Evaluations Onlinetcc07
 
Developing an authentic assessment model in elementary school science teaching
Developing an authentic assessment model in elementary school science teachingDeveloping an authentic assessment model in elementary school science teaching
Developing an authentic assessment model in elementary school science teachingAlexander Decker
 
E Assessment Presentation Ver2 June 2008
E Assessment Presentation Ver2 June 2008E Assessment Presentation Ver2 June 2008
E Assessment Presentation Ver2 June 2008Jo Richler
 
Module 6 Powerpoint
Module 6 PowerpointModule 6 Powerpoint
Module 6 Powerpointguest5a2e6f
 
Module 6 Powerpoint Presentation
Module 6 Powerpoint PresentationModule 6 Powerpoint Presentation
Module 6 Powerpoint Presentationguest5a2e6f
 
JOURNAL/ARTICLE CRITIC
JOURNAL/ARTICLE CRITICJOURNAL/ARTICLE CRITIC
JOURNAL/ARTICLE CRITICRohaida Muslim
 
Applying Peer-Review For Programming Assignments
Applying Peer-Review For Programming AssignmentsApplying Peer-Review For Programming Assignments
Applying Peer-Review For Programming AssignmentsStephen Faucher
 
Exploring Semantic Question Generation Methodology and a Case Study for Algor...
Exploring Semantic Question Generation Methodology and a Case Study for Algor...Exploring Semantic Question Generation Methodology and a Case Study for Algor...
Exploring Semantic Question Generation Methodology and a Case Study for Algor...IJCI JOURNAL
 
Journal article critique
Journal article critiqueJournal article critique
Journal article critiqueRohaida Muslim
 
A comparison between evaluation of
A comparison between evaluation ofA comparison between evaluation of
A comparison between evaluation ofijseajournal
 
A survey of_student_satisfaction_with_dl_at_fos_porto
A survey of_student_satisfaction_with_dl_at_fos_portoA survey of_student_satisfaction_with_dl_at_fos_porto
A survey of_student_satisfaction_with_dl_at_fos_portoMaja Krsmanović
 
Automated Thai Online Assignment Scoring
Automated Thai Online Assignment ScoringAutomated Thai Online Assignment Scoring
Automated Thai Online Assignment ScoringMary Montoya
 
Clustering Students of Computer in Terms of Level of Programming
Clustering Students of Computer in Terms of Level of ProgrammingClustering Students of Computer in Terms of Level of Programming
Clustering Students of Computer in Terms of Level of ProgrammingEditor IJCATR
 

Similar to Performance and duration differences between onlineand paper.docx (20)

Pre-service and In-service Teachers? Rubric Assessments of Mathem
Pre-service and In-service Teachers? Rubric Assessments of MathemPre-service and In-service Teachers? Rubric Assessments of Mathem
Pre-service and In-service Teachers? Rubric Assessments of Mathem
 
Is It the Same? G Yamazaki
Is It the Same? G YamazakiIs It the Same? G Yamazaki
Is It the Same? G Yamazaki
 
A COMPARATIVE ANALYSIS OF SELECTED STUDIES IN STUDENT PERFORMANCE PREDICTION
A COMPARATIVE ANALYSIS OF SELECTED STUDIES IN STUDENT PERFORMANCE PREDICTIONA COMPARATIVE ANALYSIS OF SELECTED STUDIES IN STUDENT PERFORMANCE PREDICTION
A COMPARATIVE ANALYSIS OF SELECTED STUDIES IN STUDENT PERFORMANCE PREDICTION
 
Analysis of pair Programming Effectiveness in Academic Environment
Analysis of pair Programming Effectiveness in Academic EnvironmentAnalysis of pair Programming Effectiveness in Academic Environment
Analysis of pair Programming Effectiveness in Academic Environment
 
An Adaptive Approach for Subjective Answer Evaluation
An Adaptive Approach for Subjective Answer EvaluationAn Adaptive Approach for Subjective Answer Evaluation
An Adaptive Approach for Subjective Answer Evaluation
 
Convincing Faculty to Deliver Faculty Evaluations Online
Convincing Faculty to Deliver Faculty Evaluations OnlineConvincing Faculty to Deliver Faculty Evaluations Online
Convincing Faculty to Deliver Faculty Evaluations Online
 
Developing an authentic assessment model in elementary school science teaching
Developing an authentic assessment model in elementary school science teachingDeveloping an authentic assessment model in elementary school science teaching
Developing an authentic assessment model in elementary school science teaching
 
E Assessment Presentation Ver2 June 2008
E Assessment Presentation Ver2 June 2008E Assessment Presentation Ver2 June 2008
E Assessment Presentation Ver2 June 2008
 
Module 6 Powerpoint
Module 6 PowerpointModule 6 Powerpoint
Module 6 Powerpoint
 
Module 6 Powerpoint Presentation
Module 6 Powerpoint PresentationModule 6 Powerpoint Presentation
Module 6 Powerpoint Presentation
 
DESIGN AND DEVELOPMENT OF AN ONLINE EXAM MAKER AND CHECKER
DESIGN AND DEVELOPMENT OF AN  ONLINE EXAM MAKER AND CHECKERDESIGN AND DEVELOPMENT OF AN  ONLINE EXAM MAKER AND CHECKER
DESIGN AND DEVELOPMENT OF AN ONLINE EXAM MAKER AND CHECKER
 
JOURNAL/ARTICLE CRITIC
JOURNAL/ARTICLE CRITICJOURNAL/ARTICLE CRITIC
JOURNAL/ARTICLE CRITIC
 
Applying Peer-Review For Programming Assignments
Applying Peer-Review For Programming AssignmentsApplying Peer-Review For Programming Assignments
Applying Peer-Review For Programming Assignments
 
Exploring Semantic Question Generation Methodology and a Case Study for Algor...
Exploring Semantic Question Generation Methodology and a Case Study for Algor...Exploring Semantic Question Generation Methodology and a Case Study for Algor...
Exploring Semantic Question Generation Methodology and a Case Study for Algor...
 
Journal article critique
Journal article critiqueJournal article critique
Journal article critique
 
A comparison between evaluation of
A comparison between evaluation ofA comparison between evaluation of
A comparison between evaluation of
 
A survey of_student_satisfaction_with_dl_at_fos_porto
A survey of_student_satisfaction_with_dl_at_fos_portoA survey of_student_satisfaction_with_dl_at_fos_porto
A survey of_student_satisfaction_with_dl_at_fos_porto
 
PowerPoint-based quizzes in wave motion: Performance and experiences of students
PowerPoint-based quizzes in wave motion: Performance and experiences of studentsPowerPoint-based quizzes in wave motion: Performance and experiences of students
PowerPoint-based quizzes in wave motion: Performance and experiences of students
 
Automated Thai Online Assignment Scoring
Automated Thai Online Assignment ScoringAutomated Thai Online Assignment Scoring
Automated Thai Online Assignment Scoring
 
Clustering Students of Computer in Terms of Level of Programming
Clustering Students of Computer in Terms of Level of ProgrammingClustering Students of Computer in Terms of Level of Programming
Clustering Students of Computer in Terms of Level of Programming
 

More from herbertwilson5999

Write a 5-7 page paper describing the historical development of info.docx
Write a 5-7 page paper describing the historical development of info.docxWrite a 5-7 page paper describing the historical development of info.docx
Write a 5-7 page paper describing the historical development of info.docxherbertwilson5999
 
Write a  5 paragraph essay related to the healthcare fieldthree.docx
Write a  5 paragraph essay related to the healthcare fieldthree.docxWrite a  5 paragraph essay related to the healthcare fieldthree.docx
Write a  5 paragraph essay related to the healthcare fieldthree.docxherbertwilson5999
 
Write at least a six-page paper, in which youIdentify the.docx
Write at least a six-page paper, in which youIdentify the.docxWrite at least a six-page paper, in which youIdentify the.docx
Write at least a six-page paper, in which youIdentify the.docxherbertwilson5999
 
Write a 2 page paper analyzing the fact pattern scenario below. Plea.docx
Write a 2 page paper analyzing the fact pattern scenario below. Plea.docxWrite a 2 page paper analyzing the fact pattern scenario below. Plea.docx
Write a 2 page paper analyzing the fact pattern scenario below. Plea.docxherbertwilson5999
 
Write a 2 page paper analyzing the fact pattern scenario below. .docx
Write a 2 page paper analyzing the fact pattern scenario below. .docxWrite a 2 page paper analyzing the fact pattern scenario below. .docx
Write a 2 page paper analyzing the fact pattern scenario below. .docxherbertwilson5999
 
Write a 100-word response in Spanish that addresses both of .docx
Write a 100-word response in Spanish that addresses both of .docxWrite a 100-word response in Spanish that addresses both of .docx
Write a 100-word response in Spanish that addresses both of .docxherbertwilson5999
 
Write a  Request for Proposal (approx. 3 - 4 pages in a word doc.docx
Write a  Request for Proposal (approx. 3 - 4 pages in a word doc.docxWrite a  Request for Proposal (approx. 3 - 4 pages in a word doc.docx
Write a  Request for Proposal (approx. 3 - 4 pages in a word doc.docxherbertwilson5999
 
Write a  5 paragraph essay related to Physical Therapy Assistant th.docx
Write a  5 paragraph essay related to Physical Therapy Assistant th.docxWrite a  5 paragraph essay related to Physical Therapy Assistant th.docx
Write a  5 paragraph essay related to Physical Therapy Assistant th.docxherbertwilson5999
 
Write a  5 page paper with  at-least three images that represent.docx
Write a  5 page paper with  at-least three images that represent.docxWrite a  5 page paper with  at-least three images that represent.docx
Write a  5 page paper with  at-least three images that represent.docxherbertwilson5999
 
Write a  5 paragraph essay related to the healthcare fieldthree maj.docx
Write a  5 paragraph essay related to the healthcare fieldthree maj.docxWrite a  5 paragraph essay related to the healthcare fieldthree maj.docx
Write a  5 paragraph essay related to the healthcare fieldthree maj.docxherbertwilson5999
 
Write at least Ten sentences on your discussion. Compare and con.docx
Write at least Ten sentences on your discussion. Compare and con.docxWrite at least Ten sentences on your discussion. Compare and con.docx
Write at least Ten sentences on your discussion. Compare and con.docxherbertwilson5999
 
Write at least a three-page analysis using the case study on pages.docx
Write at least a three-page analysis using the case study on pages.docxWrite at least a three-page analysis using the case study on pages.docx
Write at least a three-page analysis using the case study on pages.docxherbertwilson5999
 
Write at least a six-page paper, in which you Identify th.docx
Write at least a six-page paper, in which you Identify th.docxWrite at least a six-page paper, in which you Identify th.docx
Write at least a six-page paper, in which you Identify th.docxherbertwilson5999
 
Write at least a paragraph for each.1) What is your understand.docx
Write at least a paragraph for each.1) What is your understand.docxWrite at least a paragraph for each.1) What is your understand.docx
Write at least a paragraph for each.1) What is your understand.docxherbertwilson5999
 
Write at least 500 words analyzing a subject you find in this .docx
Write at least 500 words analyzing a subject you find in this .docxWrite at least 500 words analyzing a subject you find in this .docx
Write at least 500 words analyzing a subject you find in this .docxherbertwilson5999
 
Write at least 750 words paper on Why is vulnerability assessme.docx
Write at least 750 words paper on Why is vulnerability assessme.docxWrite at least 750 words paper on Why is vulnerability assessme.docx
Write at least 750 words paper on Why is vulnerability assessme.docxherbertwilson5999
 
Write As if You Are Writing in Your Journal (1st Person)Your T.docx
Write As if You Are Writing in Your Journal (1st Person)Your T.docxWrite As if You Are Writing in Your Journal (1st Person)Your T.docx
Write As if You Are Writing in Your Journal (1st Person)Your T.docxherbertwilson5999
 
Write an original, Scholarly Paper, addressing a topic relevant to t.docx
Write an original, Scholarly Paper, addressing a topic relevant to t.docxWrite an original, Scholarly Paper, addressing a topic relevant to t.docx
Write an original, Scholarly Paper, addressing a topic relevant to t.docxherbertwilson5999
 
Write an observation essay that explains the unique significance.docx
Write an observation essay that explains the unique significance.docxWrite an observation essay that explains the unique significance.docx
Write an observation essay that explains the unique significance.docxherbertwilson5999
 
Write an introduction in APA format in about 2 pages to describe.docx
Write an introduction in APA format in about 2 pages to describe.docxWrite an introduction in APA format in about 2 pages to describe.docx
Write an introduction in APA format in about 2 pages to describe.docxherbertwilson5999
 

More from herbertwilson5999 (20)

Write a 5-7 page paper describing the historical development of info.docx
Write a 5-7 page paper describing the historical development of info.docxWrite a 5-7 page paper describing the historical development of info.docx
Write a 5-7 page paper describing the historical development of info.docx
 
Write a  5 paragraph essay related to the healthcare fieldthree.docx
Write a  5 paragraph essay related to the healthcare fieldthree.docxWrite a  5 paragraph essay related to the healthcare fieldthree.docx
Write a  5 paragraph essay related to the healthcare fieldthree.docx
 
Write at least a six-page paper, in which youIdentify the.docx
Write at least a six-page paper, in which youIdentify the.docxWrite at least a six-page paper, in which youIdentify the.docx
Write at least a six-page paper, in which youIdentify the.docx
 
Write a 2 page paper analyzing the fact pattern scenario below. Plea.docx
Write a 2 page paper analyzing the fact pattern scenario below. Plea.docxWrite a 2 page paper analyzing the fact pattern scenario below. Plea.docx
Write a 2 page paper analyzing the fact pattern scenario below. Plea.docx
 
Write a 2 page paper analyzing the fact pattern scenario below. .docx
Write a 2 page paper analyzing the fact pattern scenario below. .docxWrite a 2 page paper analyzing the fact pattern scenario below. .docx
Write a 2 page paper analyzing the fact pattern scenario below. .docx
 
Write a 100-word response in Spanish that addresses both of .docx
Write a 100-word response in Spanish that addresses both of .docxWrite a 100-word response in Spanish that addresses both of .docx
Write a 100-word response in Spanish that addresses both of .docx
 
Write a  Request for Proposal (approx. 3 - 4 pages in a word doc.docx
Write a  Request for Proposal (approx. 3 - 4 pages in a word doc.docxWrite a  Request for Proposal (approx. 3 - 4 pages in a word doc.docx
Write a  Request for Proposal (approx. 3 - 4 pages in a word doc.docx
 
Write a  5 paragraph essay related to Physical Therapy Assistant th.docx
Write a  5 paragraph essay related to Physical Therapy Assistant th.docxWrite a  5 paragraph essay related to Physical Therapy Assistant th.docx
Write a  5 paragraph essay related to Physical Therapy Assistant th.docx
 
Write a  5 page paper with  at-least three images that represent.docx
Write a  5 page paper with  at-least three images that represent.docxWrite a  5 page paper with  at-least three images that represent.docx
Write a  5 page paper with  at-least three images that represent.docx
 
Write a  5 paragraph essay related to the healthcare fieldthree maj.docx
Write a  5 paragraph essay related to the healthcare fieldthree maj.docxWrite a  5 paragraph essay related to the healthcare fieldthree maj.docx
Write a  5 paragraph essay related to the healthcare fieldthree maj.docx
 
Write at least Ten sentences on your discussion. Compare and con.docx
Write at least Ten sentences on your discussion. Compare and con.docxWrite at least Ten sentences on your discussion. Compare and con.docx
Write at least Ten sentences on your discussion. Compare and con.docx
 
Write at least a three-page analysis using the case study on pages.docx
Write at least a three-page analysis using the case study on pages.docxWrite at least a three-page analysis using the case study on pages.docx
Write at least a three-page analysis using the case study on pages.docx
 
Write at least a six-page paper, in which you Identify th.docx
Write at least a six-page paper, in which you Identify th.docxWrite at least a six-page paper, in which you Identify th.docx
Write at least a six-page paper, in which you Identify th.docx
 
Write at least a paragraph for each.1) What is your understand.docx
Write at least a paragraph for each.1) What is your understand.docxWrite at least a paragraph for each.1) What is your understand.docx
Write at least a paragraph for each.1) What is your understand.docx
 
Write at least 500 words analyzing a subject you find in this .docx
Write at least 500 words analyzing a subject you find in this .docxWrite at least 500 words analyzing a subject you find in this .docx
Write at least 500 words analyzing a subject you find in this .docx
 
Write at least 750 words paper on Why is vulnerability assessme.docx
Write at least 750 words paper on Why is vulnerability assessme.docxWrite at least 750 words paper on Why is vulnerability assessme.docx
Write at least 750 words paper on Why is vulnerability assessme.docx
 
Write As if You Are Writing in Your Journal (1st Person)Your T.docx
Write As if You Are Writing in Your Journal (1st Person)Your T.docxWrite As if You Are Writing in Your Journal (1st Person)Your T.docx
Write As if You Are Writing in Your Journal (1st Person)Your T.docx
 
Write an original, Scholarly Paper, addressing a topic relevant to t.docx
Write an original, Scholarly Paper, addressing a topic relevant to t.docxWrite an original, Scholarly Paper, addressing a topic relevant to t.docx
Write an original, Scholarly Paper, addressing a topic relevant to t.docx
 
Write an observation essay that explains the unique significance.docx
Write an observation essay that explains the unique significance.docxWrite an observation essay that explains the unique significance.docx
Write an observation essay that explains the unique significance.docx
 
Write an introduction in APA format in about 2 pages to describe.docx
Write an introduction in APA format in about 2 pages to describe.docxWrite an introduction in APA format in about 2 pages to describe.docx
Write an introduction in APA format in about 2 pages to describe.docx
 

Recently uploaded

Sanyam Choudhary Chemistry practical.pdf
Sanyam Choudhary Chemistry practical.pdfSanyam Choudhary Chemistry practical.pdf
Sanyam Choudhary Chemistry practical.pdfsanyamsingh5019
 
Class 11 Legal Studies Ch-1 Concept of State .pdf
Class 11 Legal Studies Ch-1 Concept of State .pdfClass 11 Legal Studies Ch-1 Concept of State .pdf
Class 11 Legal Studies Ch-1 Concept of State .pdfakmcokerachita
 
Organic Name Reactions for the students and aspirants of Chemistry12th.pptx
Organic Name Reactions  for the students and aspirants of Chemistry12th.pptxOrganic Name Reactions  for the students and aspirants of Chemistry12th.pptx
Organic Name Reactions for the students and aspirants of Chemistry12th.pptxVS Mahajan Coaching Centre
 
A Critique of the Proposed National Education Policy Reform
A Critique of the Proposed National Education Policy ReformA Critique of the Proposed National Education Policy Reform
A Critique of the Proposed National Education Policy ReformChameera Dedduwage
 
ENGLISH5 QUARTER4 MODULE1 WEEK1-3 How Visual and Multimedia Elements.pptx
ENGLISH5 QUARTER4 MODULE1 WEEK1-3 How Visual and Multimedia Elements.pptxENGLISH5 QUARTER4 MODULE1 WEEK1-3 How Visual and Multimedia Elements.pptx
ENGLISH5 QUARTER4 MODULE1 WEEK1-3 How Visual and Multimedia Elements.pptxAnaBeatriceAblay2
 
Introduction to AI in Higher Education_draft.pptx
Introduction to AI in Higher Education_draft.pptxIntroduction to AI in Higher Education_draft.pptx
Introduction to AI in Higher Education_draft.pptxpboyjonauth
 
SOCIAL AND HISTORICAL CONTEXT - LFTVD.pptx
SOCIAL AND HISTORICAL CONTEXT - LFTVD.pptxSOCIAL AND HISTORICAL CONTEXT - LFTVD.pptx
SOCIAL AND HISTORICAL CONTEXT - LFTVD.pptxiammrhaywood
 
BASLIQ CURRENT LOOKBOOK LOOKBOOK(1) (1).pdf
BASLIQ CURRENT LOOKBOOK  LOOKBOOK(1) (1).pdfBASLIQ CURRENT LOOKBOOK  LOOKBOOK(1) (1).pdf
BASLIQ CURRENT LOOKBOOK LOOKBOOK(1) (1).pdfSoniaTolstoy
 
Presiding Officer Training module 2024 lok sabha elections
Presiding Officer Training module 2024 lok sabha electionsPresiding Officer Training module 2024 lok sabha elections
Presiding Officer Training module 2024 lok sabha electionsanshu789521
 
History Class XII Ch. 3 Kinship, Caste and Class (1).pptx
History Class XII Ch. 3 Kinship, Caste and Class (1).pptxHistory Class XII Ch. 3 Kinship, Caste and Class (1).pptx
History Class XII Ch. 3 Kinship, Caste and Class (1).pptxsocialsciencegdgrohi
 
Alper Gobel In Media Res Media Component
Alper Gobel In Media Res Media ComponentAlper Gobel In Media Res Media Component
Alper Gobel In Media Res Media ComponentInMediaRes1
 
Mastering the Unannounced Regulatory Inspection
Mastering the Unannounced Regulatory InspectionMastering the Unannounced Regulatory Inspection
Mastering the Unannounced Regulatory InspectionSafetyChain Software
 
ECONOMIC CONTEXT - LONG FORM TV DRAMA - PPT
ECONOMIC CONTEXT - LONG FORM TV DRAMA - PPTECONOMIC CONTEXT - LONG FORM TV DRAMA - PPT
ECONOMIC CONTEXT - LONG FORM TV DRAMA - PPTiammrhaywood
 
Science lesson Moon for 4th quarter lesson
Science lesson Moon for 4th quarter lessonScience lesson Moon for 4th quarter lesson
Science lesson Moon for 4th quarter lessonJericReyAuditor
 
Employee wellbeing at the workplace.pptx
Employee wellbeing at the workplace.pptxEmployee wellbeing at the workplace.pptx
Employee wellbeing at the workplace.pptxNirmalaLoungPoorunde1
 
EPANDING THE CONTENT OF AN OUTLINE using notes.pptx
EPANDING THE CONTENT OF AN OUTLINE using notes.pptxEPANDING THE CONTENT OF AN OUTLINE using notes.pptx
EPANDING THE CONTENT OF AN OUTLINE using notes.pptxRaymartEstabillo3
 
Kisan Call Centre - To harness potential of ICT in Agriculture by answer farm...
Kisan Call Centre - To harness potential of ICT in Agriculture by answer farm...Kisan Call Centre - To harness potential of ICT in Agriculture by answer farm...
Kisan Call Centre - To harness potential of ICT in Agriculture by answer farm...Krashi Coaching
 
Science 7 - LAND and SEA BREEZE and its Characteristics
Science 7 - LAND and SEA BREEZE and its CharacteristicsScience 7 - LAND and SEA BREEZE and its Characteristics
Science 7 - LAND and SEA BREEZE and its CharacteristicsKarinaGenton
 

Recently uploaded (20)

Staff of Color (SOC) Retention Efforts DDSD
Staff of Color (SOC) Retention Efforts DDSDStaff of Color (SOC) Retention Efforts DDSD
Staff of Color (SOC) Retention Efforts DDSD
 
Sanyam Choudhary Chemistry practical.pdf
Sanyam Choudhary Chemistry practical.pdfSanyam Choudhary Chemistry practical.pdf
Sanyam Choudhary Chemistry practical.pdf
 
Class 11 Legal Studies Ch-1 Concept of State .pdf
Class 11 Legal Studies Ch-1 Concept of State .pdfClass 11 Legal Studies Ch-1 Concept of State .pdf
Class 11 Legal Studies Ch-1 Concept of State .pdf
 
Organic Name Reactions for the students and aspirants of Chemistry12th.pptx
Organic Name Reactions  for the students and aspirants of Chemistry12th.pptxOrganic Name Reactions  for the students and aspirants of Chemistry12th.pptx
Organic Name Reactions for the students and aspirants of Chemistry12th.pptx
 
A Critique of the Proposed National Education Policy Reform
A Critique of the Proposed National Education Policy ReformA Critique of the Proposed National Education Policy Reform
A Critique of the Proposed National Education Policy Reform
 
ENGLISH5 QUARTER4 MODULE1 WEEK1-3 How Visual and Multimedia Elements.pptx
ENGLISH5 QUARTER4 MODULE1 WEEK1-3 How Visual and Multimedia Elements.pptxENGLISH5 QUARTER4 MODULE1 WEEK1-3 How Visual and Multimedia Elements.pptx
ENGLISH5 QUARTER4 MODULE1 WEEK1-3 How Visual and Multimedia Elements.pptx
 
Introduction to AI in Higher Education_draft.pptx
Introduction to AI in Higher Education_draft.pptxIntroduction to AI in Higher Education_draft.pptx
Introduction to AI in Higher Education_draft.pptx
 
SOCIAL AND HISTORICAL CONTEXT - LFTVD.pptx
SOCIAL AND HISTORICAL CONTEXT - LFTVD.pptxSOCIAL AND HISTORICAL CONTEXT - LFTVD.pptx
SOCIAL AND HISTORICAL CONTEXT - LFTVD.pptx
 
BASLIQ CURRENT LOOKBOOK LOOKBOOK(1) (1).pdf
BASLIQ CURRENT LOOKBOOK  LOOKBOOK(1) (1).pdfBASLIQ CURRENT LOOKBOOK  LOOKBOOK(1) (1).pdf
BASLIQ CURRENT LOOKBOOK LOOKBOOK(1) (1).pdf
 
Presiding Officer Training module 2024 lok sabha elections
Presiding Officer Training module 2024 lok sabha electionsPresiding Officer Training module 2024 lok sabha elections
Presiding Officer Training module 2024 lok sabha elections
 
History Class XII Ch. 3 Kinship, Caste and Class (1).pptx
History Class XII Ch. 3 Kinship, Caste and Class (1).pptxHistory Class XII Ch. 3 Kinship, Caste and Class (1).pptx
History Class XII Ch. 3 Kinship, Caste and Class (1).pptx
 
Alper Gobel In Media Res Media Component
Alper Gobel In Media Res Media ComponentAlper Gobel In Media Res Media Component
Alper Gobel In Media Res Media Component
 
Mastering the Unannounced Regulatory Inspection
Mastering the Unannounced Regulatory InspectionMastering the Unannounced Regulatory Inspection
Mastering the Unannounced Regulatory Inspection
 
ECONOMIC CONTEXT - LONG FORM TV DRAMA - PPT
ECONOMIC CONTEXT - LONG FORM TV DRAMA - PPTECONOMIC CONTEXT - LONG FORM TV DRAMA - PPT
ECONOMIC CONTEXT - LONG FORM TV DRAMA - PPT
 
Model Call Girl in Bikash Puri Delhi reach out to us at 🔝9953056974🔝
Model Call Girl in Bikash Puri  Delhi reach out to us at 🔝9953056974🔝Model Call Girl in Bikash Puri  Delhi reach out to us at 🔝9953056974🔝
Model Call Girl in Bikash Puri Delhi reach out to us at 🔝9953056974🔝
 
Science lesson Moon for 4th quarter lesson
Science lesson Moon for 4th quarter lessonScience lesson Moon for 4th quarter lesson
Science lesson Moon for 4th quarter lesson
 
Employee wellbeing at the workplace.pptx
Employee wellbeing at the workplace.pptxEmployee wellbeing at the workplace.pptx
Employee wellbeing at the workplace.pptx
 
EPANDING THE CONTENT OF AN OUTLINE using notes.pptx
EPANDING THE CONTENT OF AN OUTLINE using notes.pptxEPANDING THE CONTENT OF AN OUTLINE using notes.pptx
EPANDING THE CONTENT OF AN OUTLINE using notes.pptx
 
Kisan Call Centre - To harness potential of ICT in Agriculture by answer farm...
Kisan Call Centre - To harness potential of ICT in Agriculture by answer farm...Kisan Call Centre - To harness potential of ICT in Agriculture by answer farm...
Kisan Call Centre - To harness potential of ICT in Agriculture by answer farm...
 
Science 7 - LAND and SEA BREEZE and its Characteristics
Science 7 - LAND and SEA BREEZE and its CharacteristicsScience 7 - LAND and SEA BREEZE and its Characteristics
Science 7 - LAND and SEA BREEZE and its Characteristics
 

Performance and duration differences between onlineand paper.docx

  • 1. Performance and duration differences between online and paper–pencil tests Alper Bayazit • Petek Aşkar Received: 10 September 2009 / Revised: 2 August 2011 / Accepted: 16 September 2011 / Published online: 9 October 2011 � Education Research Institute, Seoul National University, Seoul, Korea 2011 Abstract Digital technologies have been used for mea- surement purposes and whether the test medium influences the user is an important issue. The aim of this study is to investigate students’ performances and duration differences between online and paper–pencil tests. An online testing tool was developed and administered in order to determine the differences between the traditional paper–pencil tests and online tests concerning students’ performances and the duration on tests. This tool enables to add questions that utilize an online database and which are in the form of
  • 2. multiple choice (with 5 or 4 options), true–false, matching, filling in the blanks, with multiple answers, with short answers, with long answers, and it also enables to prepare tests and to turn them into paper–pencil test mode. Perfor- mance test was applied with both online and paper–pencil modes on junior students at one of the universities in Turkey. Besides, the online testing tool developed within the context of the study was evaluated by instructors with respect to usability, relevance to the purpose and design. Instructor and student questionnaires are developed to determine the opinions on the online testing tool and online tests. Results showed that there was no significant differences between the performances on online and paper–pencil tests. On the other hand, the time they spent on the online test has been longer than the time they spent on paper–pencil test. Students found the online testing tool easy to use and stated that online test medium is more comfortable than paper–pencil tests. However, they complained about external noises, tiredness,
  • 3. and focusing problems regarding the online examination mediums. Generally, instructors have also appreciated the online testing tool’s design and they agree on the fact that it serves for its purposes. Keywords Paper–pencil tests � Online tests � Performance and duration differences Introduction It is crucial that evaluation reflect a student’s performance. However, there might be mistakes with the measurement within the process of evaluation. These mistakes may source from the measurement tool. Thus, the media in which the measurement tool is applied is also important. Digital technologies have been used not only for learning but also for measurement purposes. However, it has been a matter of question to what extend this digital environment will affect a student’s performance. In the literature of the online tests, it is possible to see examples of various studies making comparisons between different types of tests (paper–pencil tests and online tests),
  • 4. duration, and the decisive performance. However, incoher- ent results have been obtained from these studies. This may result from more than one reason. First of all, students may have different levels of computer literacy. Secondly, the computerized tests may be less free of random mistakes than paper–pencil tests. Computerized tests could especially decrease the possibility of mistakenly selecting another option than the desired one among multiple choice items A. Bayazit (&) � P. Aşkar Department of Computers and Instructional Technology Education, Hacettepe University, Beytepe 06530, Ankara, Turkey e-mail: [email protected] P. Aşkar Faculty of Education, TED University, Kocatepe 06420, Ankara, Turkey e-mail: [email protected] 123 Asia Pacific Educ. Rev. (2012) 13:219–226
  • 5. DOI 10.1007/s12564-011-9190-9 (Bernt and Bugbee 1990). In addition, some items may look simpler or more complex in computerized tests than how they appear on the paper–pencil tests (Bernt and Bugbee 1990). Moreover, CPU and Internet connection speeds at the time these studies were made, user interface of the online test tools, and students’ degree of readiness might have affected the results. Researches have shown that testing tool designs affect the duration and the student’s scores. The aims of this study are to determine whether there is a significant difference in student performance and dura- tion between online tests and paper–pencil tests and to collect students’ opinions about the online test. A different testing tool will be developed in the study, grades obtained and times spent by students in different testing environ- ments will be measured and instructors’ and students’ opinions about the online testing tool will be asked. The
  • 6. results to be obtained may give clues about the nature of the evaluation tools to be utilized in the future and yield ideas for the future studies on how the best evaluation environment for the students could be achieved. Review of the literature Whiting and Kline’s study (2009) examined the equiva- lency of computer and conventional versions of the Test of Workplace Essential Skills (TOWES), a test of adult lit- eracy skills in Reading Text, Document Use, and Numer- acy. Seventy-three college students completed the computer version, and their scores were compared with those who had taken the test in the conventional paper-and- pencil mode. Scores for the two groups for all three sub- scales were equivalent based on their means and variances. Rank order equivalency was demonstrated for two of the three TOWES subscales (Reading Text and Document Use). Additionally, participants rated the computer version of the test as easy to use.
  • 7. Puhan et al. (2007) evaluated the comparability of two versions of a certification test: a paper-and-pencil test (PPT) and computer-based test (CBT). Results indicated that the effect sizes were small (d 0.20) and not statis- tically significant (p [ 0.05), suggesting no substantial difference between the two test versions. Moreover, DIF analysis revealed that reading and mathematics items were comparable for both versions. However, three writing items were flagged for DIF. Substantive reviews failed to identify format differences that could explain the performance differences, so the causes of DIF could not be identified. Bodmann and Robinson (2004) studied effects of dif- ferent test types on the speed and scores. This study is composed of two experimental researches. The first experimental research aims to specify differences in scores and duration obtained from paper–pencil tests and computerized tests. Fifty-five students having taken the education psychology class were randomly divided into two experimental groups. A question is shown on the
  • 8. system screen. After selecting the correct option, a student saves the answer and cannot alter his/her selection or return to the question afterward. The same questions were asked in the paper–pencil test with the same sequence. On the contrary, 6 questions were printed on each page. Twenty- eight students took the computerized test, whereas 27 of them took it in the classical paper–pencil fashion. A dependant t test was applied on the test times and the test scores. The paper–pencil test lasted 4 min longer than the computerized test, whereas no difference was recorded between the test scores. The first experiment proved that the type of test does not affect the grade. On the other hand, it was observed that the type of test does have an effect on the speed. The reason why this time is longer at the paper– pencil test may result from its flexibility. Being unable to return to previous questions or altering the answers in the computerized test can be shown as the reason why it was completed at a shorter time.
  • 9. Wang et al. (2004) developed a web-based evaluation and test analysis system in their study and they evaluated this tool. The tool they developed consists the triple-A (Assembling, Administering, Appraising) model. Question banks and tests are developed in the assembling stage. In the administration stage, test items and their options ran- domly disperse the test into fields, personal ID numbers and passwords are produced for the application of the test via web, and test data and test scores are collected and recorded. The collected test data are analyzed and turned into statistical reports in the appraising stage. The tool is able to perform item, test, and concept error analyses. The statistical calculations of the test can also be made in this extent. Two studies have been made in order to evaluate the possible benefits of the WATA system on the teacher training. These studies enclose examining in-service teachers’ level of satisfaction from the WATA system and
  • 10. researching the attitudes of teachers toward the appraising before the service. Forty-seven teachers from 39 different schools attended the first study in order to determine the user satisfaction of the system. As a result of the applied questionnaire, it was found that users were highly satisfied from the functions of the WATA tool. The second study aimed to determine the benefits of the WATA system. As a result, the attitudes of teachers toward the evaluation before the service have been positive and they got acquainted with the appraising process thanks to WATA system. Cole and MacIsaac (2001) compared pencil–paper tests and web-based tests in their study. FCI (Force Concept Inventory), one of the standardized tools measuring a stu- dent’s knowledge on conceptualized physics, was applied. 220 A. Bayazit, P. Aşkar 123 A total of 1,173 pre-test and 825 final-test were collected
  • 11. from 1,313 students involved in the application. FCI scores obtained by students were recorded as 15.25 in the pre-test and 19.17 in the final-test over 30. 2 9 2 ANOVA (2 sex and 2 types of test) was applied on the findings in order to determine the effect of sex and test type on the scores obtained. As a result, no significant difference was found with respect to FCI type. A study performed by Bernt and Bugbee (1988) showed that students complete computerized tests at significantly longer periods compared to paper–pencil tests. However, no sign of any relation between the speed and student performance was observed. Two hours was allocated for 100 items that would enable most students to complete their tests before the time was over. On the other contrary, only 2 among 161 paper–pencil test attendees failed to complete the test due to time limitations. At the comput- erized test, however, 47 of 70 attendees failed to complete the test on time, whereas only 23 of them used the time
  • 12. properly. The fact that tests could not be completed on time may have sourced from reasons like being unfamiliar to computers or being lack of any past experience in online testing other than the inadequate time allocated for the test. Russell (1999) examined students’ success in comput- erized tests in one of his studies. The results proved that students having keyboard skills below the average level recorded lower success in computerized tests as well. In one of their studies, Clariana and Wallace (2002) found that sex and the degree of being familiar with com- puters do not have any relation to the type of test but to the acquaintance of the content. In some cases, the main reason for the test-type effect could be the flexibility of the test type. Some computerized tests are not as flexible as paper– pencil tests. Some interfaces do not permit users to revise or change their answers. This may affect a student’s success. Until now, relevant studies in this field have made comparisons between students’ success in different testing
  • 13. environments and duration with respect to test types (paper–pencil, online). However, incoherent results have been obtained from these studies. This may result from more than one reason. First of all, students may have dif- ferent levels of knowledge as a computer operator. Sec- ondly, the computerized tests may be less free of random mistakes than paper–pencil tests. Computerized test could especially decrease the possibility of mistakenly selecting another option than the desired one among multiple choice items (Bernt and Bugbee 1990). In addition, some items may look simpler or more complex in computerized tests than how they appear on the paper–pencil tests (Bernt and Bugbee 1990). This study’s aim is to investigate students’ performances and duration differences between online and paper–pencil tests. Method Participants
  • 14. The research group consists of junior students studying at the one of the biggest universities in Turkey. The aim of the study was declared to the students, and 46 junior stu- dents were volunteer for the research. The students ran- domly assigned into two groups for the purpose of making comparisons between student performances and duration at online tests and paper–pencil tests. Twenty-three students would take the test online via Internet, and 23 students would take the test with the same questions in the form of paper–pencil test. On the day of administration, however, 40 students attended the test and 17 of whom took the online test and 23 took the paper–pencil test. Attendees were applied a test containing questions on the Autumn Term CEIT class. The test contained 30 questions in total with 6 multiple choice, 6 matching, 6 multiple answer, 6 short-answer, and 6 long-answer items. Video and image containing questions were asked in the test. Video-based questions in the online test were asked as
  • 15. text version of the same question at the paper–pencil test. Materials Performance test Reliability study of the performance test utilized in the study was applied on the juniors who took the CEIT Instructional Design Course within the academic years 2005–2006. The students were studying at the one of the biggest universities in Turkey. Forty students attended the reliability study in total. Sixty questions on the educational design were asked to the attendees at the paper–pencil test, and it was reduced to 30 as a result of the item analysis. The calculated Cronbach a value of the 30 items to be asked in the test was designated as 0.78. A 30-item performance test was applied on the students at the online and paper–pencil tests. The test contained 30 ques- tions in total with 6 multiple choice, 6 matching, 6 multiple answer, 6 short-answer, and 6 long-answer items. Paper–pencil test has the same content with the online test, and questions in the online test were printed out for the paper–pencil test with
  • 16. the same sequence without any alterations. Two video-containing questions are included in the online test. Video-based questions in the online test were asked as texts at the paper–pencil test remaining loyal to the content of question. Evaluation questionnaire for students An evaluation questionnaire for students with 11 items was prepared in order to collect students’ comments on online Performance and duration differences 221 123 tests and the online testing tool. Seven items of the ques- tionnaire were arranged in the form of 5 scales, and 4 items were arranged as open-ended questions. ‘‘I agree’’ and ‘‘I don’t agree’’ options were graded from 1 to 5 for each question in the scale. The scale was applied via Internet on the 17 students taking the online test just after the finalization of the test. It
  • 17. was rendered compulsory not to omit the items in the questionnaire. Questions in the questionnaire consisted 5 different categories. These categories concerned, the usability of the online measurement tool, advantages and disadvantages of the online tests over paper–pencil tests, negative and positive sides of the online test tool. Evaluation questionnaire for instructors An ‘‘evaluation questionnaire for instructors’’ with 14 items was prepared in order to determine the usability of the testing test tool developed by the researcher. ‘‘I abso- lutely agree’’ and ‘‘I never agree’’ options for the entire items in the questionnaire were graded from 1 to 10 for each question in the scale. The questionnaire was applied on 5 instructors and 2 research assistants. It was rendered compulsory not to omit the items in the questionnaire. Questions in the questionnaire consisted 3 different categories. These categories concerned the usability of the online measurement tool, its appropriateness for the pur-
  • 18. pose, and its interface design. Online testing tool An online testing tool was designed and developed within the scope of research. Students’ questions and examination tables are used in MySQL database, and PHP is used for accessing to dataset. The features of this tool were deter- mined regarding the aim of the study. The tool offers time limitation, and it can store scores achieved by students. Test results and the relevant duration can be listed, and tests on the database can be printed out in the form of paper–pencil test. It is possible to add multiple choice questions (with 5 or options), matching questions, fill in the blanks questions, true–false questions, questions with multiple answers, questions with short or long answers, and to make amendments on the available questions. Images, videos, and audio files can be embedded into all questions, and image files can be attached to the options of multiple choice questions. It enables to add, erase, or alter students
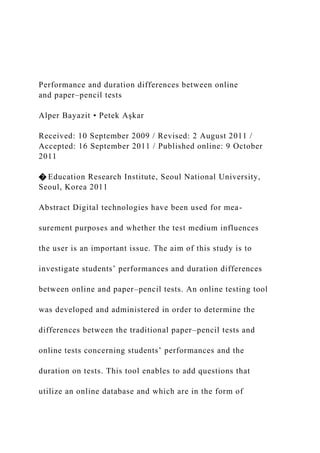
  • 19. and relevant information in the database. Thus, it is pos- sible to produce tests using the available students and questions in the database (Fig. 1, 2). In the tool devised, students have to enter the test code, number, and password when they need to display a test formed by the educators or appraisers beforehand. Test questions are displayed on students’ screen after the required controls, and students’ answers are recorded to the database. Test scores and performance data are displayed when the test is completed. A feedback is provided by displaying their own answers for each item in the test. Fig. 1 List of multiple questions screenshot Fig. 2 Online test window screenshot 222 A. Bayazit, P. Aşkar 123 Data analyses
  • 20. Scores obtained by students in the test at multiple choices, matching, and multiple answer questions were calculated by the system. By making an evaluation via Internet as a feature offered by the tool, the researcher graded short- and long- answer questions. The starting and finishing times of the tests were recorded in the database by the system. In this way, scores achieved by students in the test and duration were obtained from the test results option at the teacher’s opera- tions interface of the testing tool. Grading the answers of students taking the paper–pencil test was made by the researcher by means of an answer key. Starting and finishing times of the entire students were recorded by the test supervisor for the purpose of calculating their duration. Each question was esteemed to add 1 point in the grading process. The evaluation was made over 30 points in total by giving 1 point for each correct answer and 0 point for wrong or omitted answers. Answers close to the correct answer in the answer key were regarded as correct ignoring any spelling
  • 21. errors while grading short- and long-answer questions. Results of the evaluation questionnaire for students were obtained from all 17 students who took the online test via Internet. After the questionnaire results were acquired, it was accepted that the ones selecting 3 were esteemed to be hesitant; the ones selecting 1 and 2 signified a negative opinion, whereas the ones selecting 4 and 5 represented a positive opinion. Results of the evaluation questionnaire for instructors were obtained from 5 instructors and 2 research assistants who filled the questionnaire via Internet. After the questionnaire results were acquired, it was accepted that the ones selecting 5 and 6 were esteemed to be hesitant; the ones selecting 1, 2, 3, and 4 signified a negative opinion, whereas the ones selecting 7, 8, 9, and 10 represented a positive opinion. Results Comparisons between online tests and paper–pencil tests
  • 22. A comparison between online tests and paper–pencil tests with respect to student performance Kolmogorov–Smirnov test was applied in order to deter- mine the distribution of students’ scores achieved in the paper–pencil tests. Consequently, the p value was found to be 0.999 proving that the distribution of scores achieved in the paper–pencil tests exhibited a normal distribution. Kolmogorov–Smirnov test was also applied in order to determine whether the distribution of scores achieved in the online test was normal. Consequently, the p value was found to be 0.934 proving that the distribution of scores achieved in the online tests also exhibited a normal distribution. Statistics on the test scores achieved by students who took the online test or the paper–pencil test are as follows (Table 1): The average of the scores achieved by the 17 students taking the online test is 9.53. On the other hand, the
  • 23. average of the scores achieved by the 23 students taking the paper–pencil test is 10.74. The t value between the inde- pendent groups is 0.99, and the p value is 0.324. According to this, there is not a significant difference in terms of students’ average scores between the online test and the paper–pencil test. A comparison between online tests and paper–pencil tests with respect to duration After examining the duration of the paper–pencil test by Kolmogorov–Smirnov test, the p value was found to be 0.318. When the duration of the online test was examined, the p value was found to be 0.741. According to these results, duration for the students at both the online test and the paper–pencil test is distributed normally. Statistics on the duration spent by students who took the online test or the paper–pencil test are as follows (Table 2): The average time spent by 17 students taking the online test was found to be 40.53 min. On the other hand, the
  • 24. average time spent by the 23 students taking the paper– pencil test was found to be 34.26 min. The t value between the independent groups is 2.61, and the p value is 0.013. According to this, there is a significant difference in terms of duration between the online test and the paper–pencil tests. The online test was completed at a longer time compared to the paper–pencil test. Students’ opinions about the online testing tool and online tests Majority of the 17 students attending the study noted that they did not have difficulty in using the tool and that the Table 1 Statistics on the scores achieved at the online test and the paper–pencil test Performance Medium Number of students Average SD SD of the measurement p t Online test 17 9.53 3.710 0.900 0.324 0.99 Paper–pencil test 23 10.74 3.840 0.801 Performance and duration differences 223 123
  • 25. tool had a user friendly interface, ergonomic design, and enabled them to answer the questions with ease by clicking with mouse or typing in keyboard. The students who enjoyed the tool’s design mentioned that it was easy to understand and anyone could use it. The positive features found by the online test attendees in online tests are as follows (Table 3): • Being more relaxed at the online testing environment without feeling they are attending a test, • Having no such problems like consuming pencil tips or the need for a new paper which ensures preventing paper consumption as well, • Altering or erasing the answers with ease, • Learning the test results just after the test thereby ensuring a feedback, • Offering a funnier medium in terms of visuality compared to paper–pencil tests. Students also noted some disadvantages of the online tests along with its advantages. In students’ opinions, some
  • 26. disadvantages of the online tests are as follows: • Having difficulty in reading the questions on the screen and having tired eyes, • The fact that typing long answers on the keyboard is difficult, • Disturbing noises coming from computer’s keyboard, mouse, and fan, • Losing motivation and time due to disturbance caused by the screen and noises coming from computer, Occasional distractions from questions compared to paper–pencil tests owing to the relaxed atmosphere at the online tests and lowered stress levels. They also emphasized another advantage of the system as learning the test results just after the test thereby ensuring a feedback. Some students think that the system is not boring and offers a funny environment whereby sim- plifying to answer the questions. A disadvantage of the system was noted by students as being unable to see which questions they omitted and remaining lack of feedback upon saving the answers on
  • 27. whether they were actually saved. Students also stated that they did not like the feature of rendering an entire question wrong due to a single mistake in multiple answers and matching questions. They thought that the grading should be made based on the true items in these questions. Instructors’ opinions about the online testing tool and online tests Instructors participating in the study remained hesitant about whether too many clicking is required in the testing tool to perform a single operation. They remained hesitant, nevertheless, they stated a positive opinion on whether the help section contained examples and showed how to do the operations step by step simply but clearly. All of the Instructors agreed on the fact that the tool was easy to use and they disagreed the idea that a constant technical assistant was required using the tool. Besides, they never agreed the idea that they had difficulty in completing a desired operation while using it. The Instructors did not
  • 28. have a consensus on the idea that they were able to elim- inate any mistakes quickly and easily while using the tool. Four Instructors stated a positive opinion on this matter, whereas two of them stated a negative opinion. In general, Instructors participating in the study main- tained that the tool was functioning without any errors; however, one of the Instructors stated a negative opinion on that. The majority thinks that the testing tool serves for the purpose satisfactorily. Besides, they noted that they were Table 2 Statistics on the duration at the online test and the paper–pencil test Medium Number of students Average SD SD of the measurement p t Time Online test 17 40.53 7.559 1.833 0.013 2.61 Paper–pencil test 23 34.26 7.479 1.559 Table 3 Distribution of the answers in the questionnaire for students Items 1 2 3 4 5 Average I feel more relaxed at online tests compared to paper–pencil tests 2 6 5 2 2 2.76
  • 29. I prefer online tests to paper–pencil tests 2 4 6 2 3 3.00 I think the testing tool was easy to use 0 1 0 3 13 4.65 Questions at the online test were more distracting compared to the paper–pencil test 3 4 2 4 4 3.12 I think online testing environments have more advantages compared to paper–pencil testing environments 2 2 6 6 1 3.12 The online testing tool made me spend more time on questions 6 0 3 4 4 3.00 I would advise the online testing tool to my friends 3 2 2 5 5 3.41 224 A. Bayazit, P. Aşkar 123 willing to use the devised online testing tool in their classes. It is not generally agreed that the testing tool does not offer a coherent design on its different pages. Similarly, the majority does not agree that colors used in the design are not coherent. Except the two who remained hesitant, all of the Instructors did not agree on the idea that texts on the
  • 30. testing tool’s pages were unreadable. The idea that a clear language was used on the testing tool’s interface was supported by all of the Instructors, whereas two of them declared a negative opinion on that. None of the Instructors agreed on the idea that error messages could not express what is to be done clearly. Discussion This study aimed to compare online tests and paper–pencil tests with respect to student performance and duration. An online testing tool was developed by the researcher for this purpose. The tool enables to add students and eight dif- ferent types of questions to the database and make listing, editing, and erasing operations on this data. It is possible to create tests with customizable duration and dates using the questions and students added to the database. These tests can be printed out as paper–pencil tests. The testing tool used in the study is different from the WATA system developed by Wang et al. (2004) in enabling different types
  • 31. of questions. Whereas the WATA system only permits multiple choice questions with five options, the tool devised in the study enables fill in the blanks, matching, multiple answer, short- and long-answer questions. It is also possible to grade interpretative questions on teacher’s operations interface of the tool. Teachers can make a list of the open-ended questions and students’ answers through their administration panel. So they can evaluate the answers without seeing the names of the students. This is one of the key features distinguishing the tool from the other testing tools. Similarly, web-based ActiveInk course management system developed by Bodmann and Robinson (2004) to compare students’ scores and duration contains only multiple choice questions. Another feature of the devised testing tool is its ability to enable questions with multimedia content (video, audio, and image). In general, student performance at the computerized test is as good as their performance at the paper–pencil test
  • 32. (Bernt and Bugbee 1990). At the end of the study, no significant difference has been found between scores obtained by students at the online test and the paper–pencil test. Thus, the study has been parallel to Bodmann and Robinson (2004) study and Cole and MacIsaac’s (2001) study in terms of student’s scores to remain at the same levels in different testing environments. Nevertheless, a different result was obtained considering the speed. It was found that the computerized test was completed 4 min earlier in Bodmann and Robinson (2004) study, whereas it was completed 6 min later in this study. This result is in line with Bernt and Bugbee’s (1988) result proving that computerized tests are completed at longer periods. The reason why students completed the online test at a longer time may be a result of being unfamiliar to the testing tool, because the students were introduced to the online testing tool’s interface for the first time on the day of application. They did not have a chance to make practice with the tool
  • 33. before the day of application. Although having noted on the questionnaire that they found the online testing tool easy to use, the time required by students for getting accustomed to the tool may be the reason why students completed the test with delay. According to Clariana and Wallace (2002), if students were accustomed to comput- erized tests as much as they are to the paper–pencil tests, the effect of the applied test type would be less or it would diminish. In such studies, applying devised tools on stu- dents beforehand, thereby increasing the level of acquain- tance is an element that can affect the results. Arranging the items could also affect a student’s per- formance on a relevant item (Clariana and Wallace 2002). In order to eliminate this effect, questions at the online and paper–pencil tests were asked in the same sequence using the same items. However, some items are easy or hard to distinguish at computerized tests compared to paper–pencil tests (Bernt and Bugbee 1990). Another opinion supporting
  • 34. it is that computerized tests and paper–pencil tests will not be identical even if they have the same items. Thus, stu- dents may have different results at computerized tests and paper–pencil tests (Bernt and Bugbee 1990). In this study, no significant difference was found between students’ scores at different environments; however, the idea that tests are not identical even if they have the same items may be the reason to the significant difference in duration. Flexibility is another element affecting the speed. At inflexible computerized tests, it is not possible to return to, revise, or alter an answered question (Bodmann and Rob- inson 2004). According to this definition, the online testing tool utilized in the study is flexible. It is possible for stu- dents to return to any question or change their answers. In Bodmann and Robinson’s study (2004), the inflexible computerized test was completed at a shorter time com- pared to the flexible computerized test and the paper–pencil test. If an inflexible online testing tool was used in this
  • 35. study too, the speed could be different as it would be impossible to return to previous questions, and the online test could be completed at a shorter time. Nevertheless, it should be noted that an inflexible computerized test being unable to revise the answers or change any wrong answers could affect student performance. In this study, the online Performance and duration differences 225 123 test was completed at approximately 40.53 min, whereas the paper–pencil test was completed at about 34.26 min. Totally, 81.06 s was spent for per question at the online test, while this period was 68.52 s for the paper–pencil test. It is seen that reading on a computer’s screen takes longer compared to reading printed texts (Kruk and Muter 1984). Similarly in this study, the reason why the online test lasted longer compared to the paper test may be the fact that questions were read on a computer screen at the
  • 36. online test. Furthermore, it requires more effort to complete a computerized test compared to paper–pencil tests (Noyes et al. 2004). While designing such studies, video-contain- ing questions should be carefully arranged considering the image and sound quality. File capacity is another issue. Loading times can be longer especially at computers with low connection speeds in case such files have higher file capacities. This could eventually increase the duration. Another physical distinction between the paper–pencil tests and web-based tests is the difference in the physical dimensions of the presentation area. The amount of infor- mation which could be fitted easily on a computer’s screen is only one-third of the information that could be printed on an ordinary sheet of paper. A student can easily scan the entire questions on the paper and reach following questions quickly just by turning pages. That would not be possible at computerized tests using screens on which just a single item can be displayed (Clariana and Wallace 2002). Cor-
  • 37. respondingly, only one item can be displayed on the screen of the testing tool used in the study. Students can view questions using the navigation buttons or question buttons. This could be shown as a reason to the delay in the duration at the online test compared to the paper–pencil test. Students noted some disadvantages of the online tests along with its advantages. These are reading the questions on the screen and having tired eyes, the fact that typing long answers on the keyboard is difficult, disturbing noises coming from computer’s keyboard, mouse and fan, and losing motivation and time due to disturbance caused by the screen. It is very critical to eliminate the problems of online testing processes. The most important issue to handle the disadvantages is the experience. Because stu- dents use paper–pencil tests through their school life. Less noisy computers as laptops should be used, and there should be enough space between computers to confront noise problem.
  • 38. References Bernt, F. M., & Bugbee, A. C. (1988). Your time is up! An assessment of time limits for American College students. Examination Research Report No. 88–1. Bryn Mawr, PA: The American College. Bernt, F. M., & Bugbee, A. C., Jr. (1990). Factors influencing student resistance to computer administered testing. Journal of Research on Computing in Education, 22(3), 265–275. Bodmann, S. M., & Robinson, D. H. (2004). Speed and performance differences among computer-based and paper–pencil tests. Journal of Educational Computing Research, 31(1), 51–60. Clariana, R., & Wallace, P. (2002). Paper-based versus computer- based assessment: Key factors associated with the test mode effect. Br J Educ Technol, 33(5), 593–602. Cole, R. P., MacIsaac, D. (2001). A comparison of paper-based and web-based testing. (ERIC Document Reproduction Service No. ED453224). Kruk, R. S., & Muter, P. (1984). Reading continuous text on video screens. Human Factors, 26, 339–345.
  • 39. Noyes, J., Garland, K., & Norris, L. (2004). Paper-based versus computer-based: Is workload another test mode effect? British Journal of Educational Technology, 35(1), 111–113. Puhan. G., Boughton, K., Kim, S. (2007). Examining differences in examinee performance in paper and pencil and computerized testing. Journal of Technology Learning, and Assessment, 6(3), 4–20. (ERIC Document Reproduction Service No: EJ838613). Russell, M. (1999). Testing on computers: A follow up study comparing performance on computer and on paper. Education Policy Analysis Archives, 7, 20. Wang, T. H., Wang, H., Wang, W. L., Huang, S. C., & Chen, S. Y. (2004). Web based assessment and test analyses (WATA) system development and evaluation. Journal of Computer Assisted Learning, 20, 59–71. Whiting, H., & Kline, T. J. B. (2009). Assessment of the equivalence of conventional versus computer administration of the test of workplace essential skills. International Journal of Training and Development, 10(4), 285–290. (ERIC Document Reproduction Service No: EJ839769).
  • 40. 226 A. Bayazit, P. Aşkar 123 Performance and duration differences between online and paper- -pencil testsAbstractIntroductionReview of the literatureMethodParticipantsMaterialsPerformance testEvaluation questionnaire for studentsEvaluation questionnaire for instructorsOnline testing toolData analysesResultsComparisons between online tests and paper-- pencil testsA comparison between online tests and paper--pencil tests with respect to student performanceA comparison between online tests and paper--pencil tests with respect to durationStudents’ opinions about the online testing tool and online testsInstructors’ opinions about the online testing tool and online testsDiscussionReferences Assignment 1 USE THE HARVARD REFERENCING SYSTEM THROUGHOUT THE REPORT Problem 1 (25 pts) The cost of 14 models of digitals cameras at a camera specialty store during 2014 was as follows:
  • 41. 340 450 450 280 220 340 290 370 400 310 340 430 270 380 1. Compute mean, median, mode, first and third quartile. 2. Compute the variance, standard deviation, range, interquartile range, coefficient of variation, standard error of the mean and Z scores. 3. Determine whether or not there are outliers? Explain. 4. Determine whether or not the data are skewed? If so, how? 5. Based on the previous results what conclusions can you reach concerning the price of digital cameras at a camera specialty store during 2014. 6. Construct a 90%, 95%, 99% confidence interval for the population mean cost of digitals cameras. 7. Interpret the meaning of each interval. 8. What assumption do you need to make about the population of interest to construct the confidence intervals? Problem 2 (15 pts) Consider the sample data for plants A, B, C & D of the above company, which are tabulated in table 1. Test whether the four means are equal at the 5% level of significance.
  • 42. Perform a test that will compare all 4 means at once. We are not interested in pair-wise comparisons at this stage. Please show all the steps in your calculations. Table 1: A B C D 333 328 320 333 332 329 321 321 320 323 322 329 326 327 325 330 328 330 326 328 325 331 328 325 323 332 329 333 321 320 330 331 334 324 331 327 322 323 332 320 334 329 330 328 331
  • 43. 330 Problem 3 (30 pts) Read the article (p. 221 – 225) «Performance and duration differences between online and paper–pencil tests» and answer the questions below. Part A. 1. Develop a 95% confidence interval using data from this study. 2. Perform a hypothesis testing using data from this study. (show all the the appropriate steps). 3. Suggest another statistical technique(s) for the purpose of this study. Explain. Part B. For this study briefly describe how the researcher draw conclusions from a sample about a
  • 44. population. Try to be as analytic as possible and use the comments bellow. 1. Determine (or define) the independent variable(s). 2. Determine (or define) the dependent variable(s). 3. Determine (or define) qualitative and quantitative variable(s). 4. Determine (or define) the sample and the population. 5. Describe the statistical method(s) being used and define inferential statistics. Interpret the meaning of p-value.