Dashboard Reporting System (DRS)

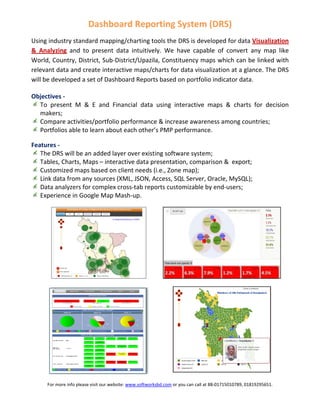
The DRS (Dashboard Reporting System) is a data visualization and analysis tool that presents data intuitively using standard mapping and charting tools. It has the capability to convert maps of various geographical areas like world, country, district, and constituency, which can then be linked to relevant data to create interactive maps and charts for visualization. The DRS will develop a set of dashboard reports based on portfolio indicator data to present M&E and financial data using interactive maps and charts for decision makers, compare activities and portfolio performance, and allow portfolios to learn about each other’s PMP performance. The DRS will be an added layer over existing software systems and feature tables, charts, interactive data presentation, comparison and export, customized maps

Recommended
More Related Content
What's hot
What's hot (16)
Viewers also liked
Similar to Dashboard Reporting System (DRS)
Similar to Dashboard Reporting System (DRS) (20)
More from SoftWorks
Recently uploaded
Recently uploaded (20)
Dashboard Reporting System (DRS)
- 1. Da ashboar rd Repo orting Sy ystem ( (DRS) Usin ng industry y standard mapping/ /charting to ools the DRS is developed for d data Visua alization & Analyzing and to present data intuitive We ha capabl of conv A a ely. ave le vert any m like map Wor rld, Countr ry, District t, Sub‐District/Upazil la, Constitu uency map ps which c can be link ked with rele evant data and create e interactiv ve maps/c charts for d data visualization at a glance. T The DRS will be developed a set o of Dashboa ard Report ts based on n portfolio o indicator data. Obje ectives ‐ To present M & E and Finan T t ncial data using inte eractive m maps & ch harts for d decision makers; m Compare a C activities/portfolio pe erformance e & increase awareness among g countries s; Portfolios a P able to learn about e each other’ ’s PMP per rformance. Feat tures ‐ The DRS will be an ad T dded layer over exist ting softwa are system; Tables, Cha T arts, Maps – interact tive data presentation, compar rison & export; Customized C d maps based on clie ent needs ( (i.e., Zone map); Link data fr L rom any so ources (XM ML, JSON, A Access, SQL L Server, O Oracle, MyS SQL); Data analyzers for co D omplex cross‐tab reports customizable by y end‐users s; Experience E e in Google e Map Mas sh‐up. For more in nfo please visit our website: w www.softwork ksbd.com or yo ou can call at 88 8‐0171501078 89, 0181929565 51.