4. mahenderson
Highlight
mahenderson
Highlight
mahenderson
Sticky Note
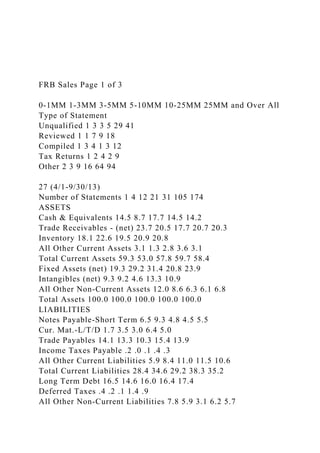
Net Worth is another name for Total Equity. In this case, the
industry average Equity Ratio is 38%, rounded. The industry
average Debt Ratio is the complement of the Equity Ratio. The
industry average Debt Ratio is therefore 62% (100% - 38%).
mahenderson
Sticky Note
This is the industry average for the Gross Profit Margin, already
expressed as a percent.
mahenderson
Sticky Note
This is the Pre-Tax Net Profit Margin, already expressed as a
percent.
FRB Sales Page 2 of 3
0-1MM 1-3MM 3-5MM 5-10MM 10-25MM 25MM and Over All
325412 - Pharmaceutical Preparation Manufacturing
2014-15 Annual Statement Studies
National - All Regions
Current - median 2.0 1.6 1.9 1.9 1.9
Current - lower 1.5 1.2 1.0 1.2 1.2
10. mahenderson
Highlight
mahenderson
Sticky Note
This is the industry average for the Inventory Turnover Ratio.
mahenderson
Sticky Note
This is the industry average for the Fixed Asset Turnover Ratio.
mahenderson
Sticky Note
This is the industry average for the Times Interest Earned Ratio.
mahenderson
Sticky Note
This is the industry average for the Pre-Tax Return on Equity.
mahenderson
Sticky Note
This is the industry average for the Pre-Tax Return on Assets.
FRB Sales Page 3 of 3
0-1MM 1-3MM 3-5MM 5-10MM 10-25MM 25MM and Over All
325412 - Pharmaceutical Preparation Manufacturing
2014-15 Annual Statement Studies
National - All Regions
Sales / Total Assets - median 2.3 2.0 1.5 1.5 1.7
Sales / Total Assets - lower 1.4 1.3 1.1 .9 1.0
% Depr, Depl, Amort / Sales - upper 1.0 1.2 1.0 1.0
11. % Depr, Depl, Amort / Sales - median (18) 1.4 (26) 2.3 (87)
2.1 (143) 2.0
% Depr, Depl, Amort / Sales - lower 6.0 4.2 3.5 3.7
% Officers', Directors', Owners' Comp / Sales - upper 1.9 .9 1.4
% Officers', Directors', Owners' Comp / Sales - median (10) 2.7
(12) 1.6 (36) 2.4
% Officers', Directors', Owners' Comp / Sales - lower 3.7 4.0
3.6
Net Sales ($) 22M 7389M 51781M 142960M 505328M
8891011M 9598491M
Total Assets ($) 43M 4820M 48662M 84858M 394722M
6781121M 7314226M
Week 6
mahenderson
Highlight
mahenderson
Highlight
mahenderson
Highlight
mahenderson
Highlight
mahenderson
Sticky Note
This is the industry average for the Total Asset Turnover
RatioFRB Sales
Financial Ratio Analysis Guidelines.html
12. Discussion Assignments 5-8
[removed]
[removed]
Financial Ratio Analysis Guidelines
For use in Discussion Assignments 5-8
The discussion assignments for Weeks 5-8 will be devoted to
financial ratio analysis. Ratios are used to evaluate a firm’s
financial health and are used by stockholders, lenders, and the
firm’s management to evaluate the firm’s financial performance
and status.
You will be evaluating the financial strength of the company
using both trend and comparative analysis. Trend analysis
involves assessing a company’s performance over time.
Comparative analysis involves comparing a company’s financial
ratios to the industry norm or average.
Because many firms are conglomerates, owning more-or-less
unrelated lines of business, comparative analysis presents its
own unique challenges. In addition, major competitors in an
industry may be scattered around the world and the existence of
different standards and procedures sometimes makes it difficult
to compare financial statements across national borders. In
some cases, industry norms may not be a good fit.
Recommended Resources for the remaining discussion
assignments: 10-K ReportsThe RMA database: located on the
Stafford Library website
Calculating Financial Ratios
The best practice is to calculate all ratios using the company’s
balance sheets and income statements contained in the 10-K
report. Although it can be a time-consuming and, at times,
frustrating approach, it is the most accurate one. In spite of
13. GAAP, companies have a fair amount of discretion when it
comes to constructing their financial statements. As a result, the
line items on the balance sheet and income statement may be
labeled differently than the balance sheets and income
statements found in the text.
From the company’s 10-K reports, you will need to locate the
company’s balance sheet and income statement for the last 3
years. You will likely need to access the company’s previous
10-K report, the one filed two years ago, in order to find
balance sheets for all 3 years. If your company has subsidiaries,
take care to use the consolidated statements.
I recommend you use the Motley Fool’s document titled "Roses
by Other Names" which is posted in the module for this week. It
will help in understanding how to calculate the ratios when
company financial statements do not match-up with the
financial statements presented in the textbook.
Although many financial research websites contain financial
ratio data, the ratios provided on these sites tends to be far less
reliable than calculating the ratios yourself and is therefore
strongly discouraged as a source.
Locating and Using Industry Averages
To locate a company’s industry norms, you must first determine
the company’s NAICS codes. The NAICS code is a U.S.
government code used to classify firms by their type of
business. The eStatement Studies database of RMA (Robert
Morris & Associates) industry norms located on the Stafford
Library website will be your source for industry average data.
Although you may find industry norms on other financial
research websites, the industry analysis data provided on these
sites tends to be far less reliable than the ones included in the
eStatement Studies database. Please use only the eStatement
Studies database to report industry norms.
To find the NAICS Codes:Using the Stafford Library website,
select the Databases option from the tabbed menu.Select
Business, Management and Finance Databases from the category
14. options.Select the Business Source Complete database.Click on
the Company Information link in the blue banner near the top of
the page.Enter the company ticker symbol in the search box and
set the box to the left as “ticker symbol.”Open the company
record and click on the Industry link. Take note of the NAICS
codes on the screen that follows. The first code listed reflects
the company’s primary industry. Companies with operations in
different industries will have multiple NAICS codes.
A sample document showing the NAICS codes from the
Business Source Complete database is posted in this week's
module.
To find Industry Averages:Return to the Business, Management
and Finance Databases on the Stafford Library Website.Select
the eStatement Studies database.Using the NAICS code that you
found in the above steps, type it in the third search box, the one
identified as “Search for an industry by keyword or code.”Click
on “Search” to the right of this search box.A little farther down
the screen you will see your NAICS code as a hyperlink along
with the industry title. Click on the link for the NAICS
code.Click on the “Annual Statement Studies” link in the left
column.Click on the FRB Sales tab in the main right section of
the screen.Since it is recommended to print a copy of the pages
that follow since you will be using them in each of the
remaining weeks, click on the black print button. Choose to
open it with Adobe Reader and click “OK.” Print the PDF that
appears.You next need to locate the column of data that you
will use in your analysis. Data is categorized by the amount of
annual company sales; data for most large corporations is under
the column labeled $25MM. (Note: “M” stands for ….” )If you
are viewing the table online, look for the column labeled
“25MM and Over.”If you are looking at the pages you have
printed out, consult the second page that has a set of columns
for “Current Data Sorted by Sales.” Find the “25MM & Over”
column there.
On the FRB Sales, the first thing you must do is to locate the
column of data that you will use in your analysis. Data is
15. categorized by the amount of annual company sales; data for
most large corporations is under the column labeled $25MM.
(Note:"M" stands for thousands of dollars, "MM" stands for
millions of dollars.)
For most ratios, three numbers are listed, breaking the results
into quartiles. Presenting the data in this form offers the user a
broader perspective than a single average would provide. Using
quartiled data offers the user a broader perspective when
interpreting the results. For example, if a company’s ratio is a
bit below the median, you might be tempted to conclude that the
company is not doing well. However, you should also note that
the company’s ratio falls between the top and bottom figures,
putting the company among 50% of all companies reporting.
Use the following breakdown when evaluating the company’s
ratio against the industry average:The middle number of the
three ratios is the median, not the average.50% of the
companies reporting have a ratio between the top and bottom
number.25% of the companies have a ratio that would be above
the top number.25% of the companies have a ratio that would be
between the top and middle number.25% of the companies have
a ratio that would be between the middle and bottom
number.25% of the companies have a ratio that would be below
the bottom number.
To better understand and interpret the data, hover over the green
mega-navigation bar area labeled eStatement Studies. Click on
About eStatement Studies, then select the green button to the
left labeled Financial Ratio Benchmarks Data in the left
column. Review the links for ratios that follow.
Review the marked-up sample document in this module to
locate the relevant data for Discussions 5-8.
Interpreting Financial Ratios
Chapter 3 in the text offers a good overview of financial ratios
16. and how they are used to assess financial performance.
Investopedia’s website offers additional explanations for how
specific ratios are used. Use the search box on the site to find
more information.
Keep in mind that ratio analysis involves the evaluation of
imperfect data. Nonetheless, financial analysis must use the
data, however flawed, to make informed decisions.
Overall guidelines for Weeks 1-8 can be found in the
Discussions Overview.
FINC 350: Business Finance
css/main.css
/*! HTML5 Boilerplate v4.3.0 | MIT License | http://h5bp.com/
*/
/*
* What follows is the result of much research on cross-browser
styling.
* Credit left inline and big thanks to Nicolas Gallagher,
17. Jonathan Neal,
* Kroc Camen, and the H5BP dev community and team.
*/
/*
===============================================
===========================
Base styles: opinionated defaults
===============================================
=========================== */
button,
input,
select,
textarea {
color: #222;
}
20. /*
* Remove the gap between images, videos, audio and canvas
and the bottom of
* their containers: h5bp.com/i/440
*/
audio,
canvas,
img,
video {
vertical-align: middle;
}
/*
* Remove default fieldset styles.
*/
44. display: none !important;
visibility: hidden;
}
/*
* Hide only visually, but have it available for screenreaders:
h5bp.com/v
*/
.visuallyhidden {
border: 0;
clip: rect(0 0 0 0);
height: 1px;
margin: -1px;
overflow: hidden;
padding: 0;
position: absolute;
width: 1px;
45. }
/*
* Extends the .visuallyhidden class to allow the element to be
focusable
* when navigated to via the keyboard: h5bp.com/p
*/
.visuallyhidden.focusable:active,
.visuallyhidden.focusable:focus {
clip: auto;
height: auto;
margin: 0;
overflow: visible;
position: static;
width: auto;
}
/*
46. * Hide visually and from screenreaders, but maintain layout
*/
.invisible {
visibility: hidden;
}
/*
* Clearfix: contain floats
*
* For modern browsers
* 1. The space content is one way to avoid an Opera bug when
the
* `contenteditable` attribute is included anywhere else in the
document.
* Otherwise it causes space to appear at the top and bottom
of elements
* that receive the `clearfix` class.
* 2. The use of `table` rather than `block` is only necessary if
using
47. * `:before` to contain the top-margins of child elements.
*/
.clearfix:before,
.clearfix:after {
content: " "; /* 1 */
display: table; /* 2 */
}
.clearfix:after {
clear: both;
}
/*
* For IE 6/7 only
* Include this rule to trigger hasLayout and contain floats.
*/
48. .clearfix {
*zoom: 1;
}
/*
===============================================
===========================
EXAMPLE Media Queries for Responsive Design.
These examples override the primary ('mobile first') styles.
Modify as content requires.
===============================================
=========================== */
@media only screen and (min-width: 35em) {
/* Style adjustments for viewports that meet the condition */
}
@media print,
(-o-min-device-pixel-ratio: 5/4),
49. (-webkit-min-device-pixel-ratio: 1.25),
(min-resolution: 120dpi) {
/* Style adjustments for high resolution devices */
}
/*
===============================================
===========================
Print styles.
Inlined to avoid required HTTP connection: h5bp.com/r
===============================================
=========================== */
@media print {
* {
background: transparent !important;
color: #000 !important; /* Black prints faster: h5bp.com/s
*/
box-shadow: none !important;
50. text-shadow: none !important;
}
a,
a:visited {
text-decoration: underline;
}
a[href]:after {
content: " (" attr(href) ")";
}
abbr[title]:after {
content: " (" attr(title) ")";
}
/*
* Don't show links for images, or javascript/internal links
53. }
h2,
h3 {
page-break-after: avoid;
}
}
css/normalize.css
/*! normalize.css v1.1.3 | MIT License | git.io/normalize */
/*
===============================================
===========================
HTML5 display definitions
===============================================
=========================== */
/**
* Correct `block` display not defined in IE 6/7/8/9 and Firefox
3.
*/
article,
aside,
details,
figcaption,
54. figure,
footer,
header,
hgroup,
main,
nav,
section,
summary {
display: block;
}
/**
* Correct `inline-block` display not defined in IE 6/7/8/9 and
Firefox 3.
*/
audio,
canvas,
video {
display: inline-block;
*display: inline;
*zoom: 1;
}
/**
* Prevent modern browsers from displaying `audio` without
controls.
* Remove excess height in iOS 5 devices.
*/
audio:not([controls]) {
display: none;
height: 0;
}
/**
55. * Address styling not present in IE 7/8/9, Firefox 3, and Safari
4.
* Known issue: no IE 6 support.
*/
[hidden] {
display: none;
}
/*
===============================================
===========================
Base
===============================================
=========================== */
/**
* 1. Correct text resizing oddly in IE 6/7 when body `font-size`
is set using
* `em` units.
* 2. Prevent iOS text size adjust after orientation change,
without disabling
* user zoom.
*/
html {
font-size: 100%; /* 1 */
-ms-text-size-adjust: 100%; /* 2 */
-webkit-text-size-adjust: 100%; /* 2 */
}
/**
* Address `font-family` inconsistency between `textarea` and
other form
* elements.
65. */
fieldset {
border: 1px solid #c0c0c0;
margin: 0 2px;
padding: 0.35em 0.625em 0.75em;
}
/**
* 1. Correct color not being inherited in IE 6/7/8/9.
* 2. Correct text not wrapping in Firefox 3.
* 3. Correct alignment displayed oddly in IE 6/7.
*/
legend {
border: 0; /* 1 */
padding: 0;
white-space: normal; /* 2 */
*margin-left: -7px; /* 3 */
}
/**
* 1. Correct font size not being inherited in all browsers.
* 2. Address margins set differently in IE 6/7, Firefox 3+,
Safari 5,
* and Chrome.
* 3. Improve appearance and consistency in all browsers.
*/
button,
input,
select,
textarea {
font-size: 100%; /* 1 */
margin: 0; /* 2 */
vertical-align: baseline; /* 3 */
66. *vertical-align: middle; /* 3 */
}
/**
* Address Firefox 3+ setting `line-height` on `input` using
`!important` in
* the UA stylesheet.
*/
button,
input {
line-height: normal;
}
/**
* Address inconsistent `text-transform` inheritance for `button`
and `select`.
* All other form control elements do not inherit `text-
transform` values.
* Correct `button` style inheritance in Chrome, Safari 5+, and
IE 6+.
* Correct `select` style inheritance in Firefox 4+ and Opera.
*/
button,
select {
text-transform: none;
}
/**
* 1. Avoid the WebKit bug in Android 4.0.* where (2) destroys
native `audio`
* and `video` controls.
* 2. Correct inability to style clickable `input` types in iOS.
* 3. Improve usability and consistency of cursor style between
image-type
67. * `input` and others.
* 4. Remove inner spacing in IE 7 without affecting normal
text inputs.
* Known issue: inner spacing remains in IE 6.
*/
button,
html input[type="button"], /* 1 */
input[type="reset"],
input[type="submit"] {
-webkit-appearance: button; /* 2 */
cursor: pointer; /* 3 */
*overflow: visible; /* 4 */
}
/**
* Re-set default cursor for disabled elements.
*/
button[disabled],
html input[disabled] {
cursor: default;
}
/**
* 1. Address box sizing set to content-box in IE 8/9.
* 2. Remove excess padding in IE 8/9.
* 3. Remove excess padding in IE 7.
* Known issue: excess padding remains in IE 6.
*/
input[type="checkbox"],
input[type="radio"] {
box-sizing: border-box; /* 1 */
padding: 0; /* 2 */
*height: 13px; /* 3 */
68. *width: 13px; /* 3 */
}
/**
* 1. Address `appearance` set to `searchfield` in Safari 5 and
Chrome.
* 2. Address `box-sizing` set to `border-box` in Safari 5 and
Chrome
* (include `-moz` to future-proof).
*/
input[type="search"] {
-webkit-appearance: textfield; /* 1 */
-moz-box-sizing: content-box;
-webkit-box-sizing: content-box; /* 2 */
box-sizing: content-box;
}
/**
* Remove inner padding and search cancel button in Safari 5
and Chrome
* on OS X.
*/
input[type="search"]::-webkit-search-cancel-button,
input[type="search"]::-webkit-search-decoration {
-webkit-appearance: none;
}
/**
* Remove inner padding and border in Firefox 3+.
*/
button::-moz-focus-inner,
input::-moz-focus-inner {
border: 0;